| Multiple Linear Regression - Estimated Regression Equation |
| X2t[t] = + 25578.1303782642 -990.437503041272Yt[t] + 18.5570105455728X1t[t] + 615.08893959725X3t[t] + e[t] |
| Multiple Linear Regression - Ordinary Least Squares | |||||
| Variable | Parameter | S.D. | T-STAT H0: parameter = 0 | 2-tail p-value | 1-tail p-value |
| (Intercept) | 25578.1303782642 | 10607.785665 | 2.4113 | 0.021448 | 0.010724 |
| Yt | -990.437503041272 | 1127.032157 | -0.8788 | 0.385678 | 0.192839 |
| X1t | 18.5570105455728 | 7.513409 | 2.4699 | 0.018694 | 0.009347 |
| X3t | 615.08893959725 | 990.827211 | 0.6208 | 0.538882 | 0.269441 |
| Multiple Linear Regression - Regression Statistics | |
| Multiple R | 0.676420411214375 |
| R-squared | 0.457544572707424 |
| Adjusted R-squared | 0.40968085853455 |
| F-TEST (value) | 9.55932026200189 |
| F-TEST (DF numerator) | 3 |
| F-TEST (DF denominator) | 34 |
| p-value | 0.000101194092399060 |
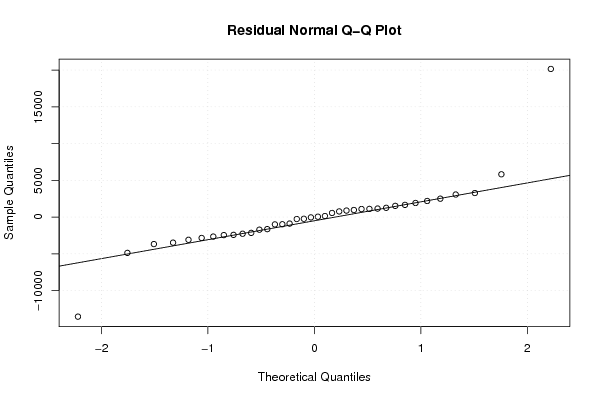
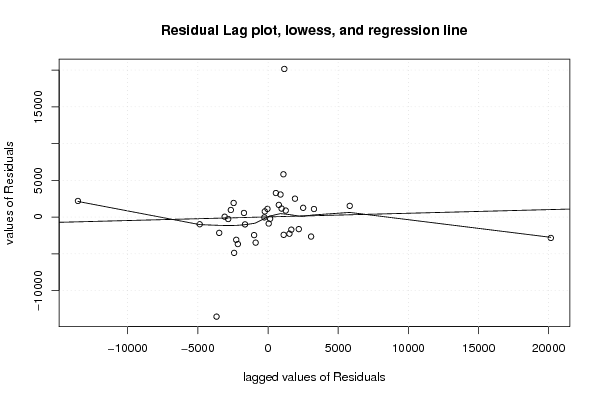
| Multiple Linear Regression - Residual Statistics | |
| Residual Standard Deviation | 4776.13028631606 |
| Sum Squared Residuals | 775588297.403426 |
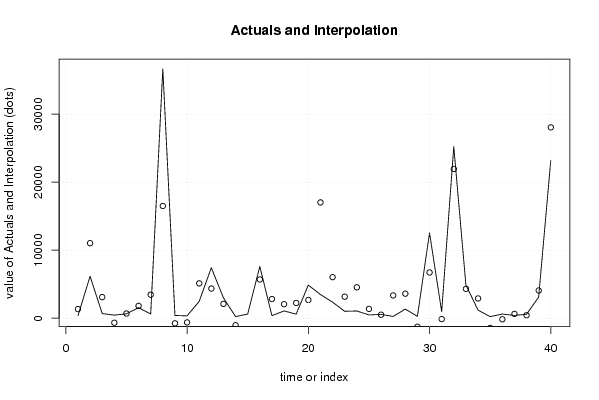
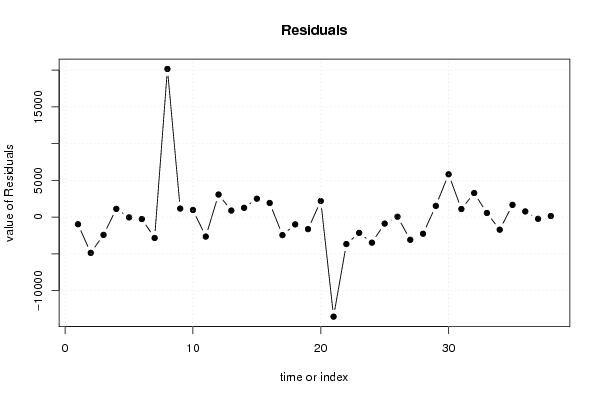
| Multiple Linear Regression - Actuals, Interpolation, and Residuals | |||
| Time or Index | Actuals | Interpolation Forecast | Residuals Prediction Error |
| 1 | 370 | 1343.09598623306 | -973.09598623306 |
| 2 | 6166 | 11034.8960860658 | -4868.89608606576 |
| 3 | 684 | 3099.96861537675 | -2415.96861537675 |
| 4 | 449 | -667.754257338434 | 1116.75425733843 |
| 5 | 643 | 682.364900741679 | -39.3649007416788 |
| 6 | 1551 | 1812.8417830824 | -261.8417830824 |
| 7 | 616 | 3455.44191788303 | -2839.44191788303 |
| 8 | 36660 | 16504.489074716 | 20155.510925284 |
| 9 | 403 | -756.21953779569 | 1159.21953779569 |
| 10 | 346 | -620.611350504895 | 966.611350504895 |
| 11 | 2471 | 5119.6409140367 | -2648.64091403670 |
| 12 | 7427 | 4357.41414046704 | 3069.58585953296 |
| 13 | 2992 | 2102.50374847152 | 889.49625152848 |
| 14 | 233 | -1028.75416276945 | 1261.75416276945 |
| 15 | 609 | -1895.11312520154 | 2504.11312520154 |
| 16 | 7615 | 5693.51889974829 | 1921.48110025171 |
| 17 | 370 | 2819.12870507590 | -2449.12870507590 |
| 18 | 1066 | 2058.29127270741 | -992.291272707413 |
| 19 | 600 | 2238.15226469135 | -1638.15226469135 |
| 20 | 4873 | 2680.47866697762 | 2192.52133302238 |
| 21 | 3485 | 17030.0173229399 | -13545.0173229399 |
| 22 | 2364 | 6033.14278330234 | -3669.14278330234 |
| 23 | 1016 | 3165.66853275586 | -2149.66853275586 |
| 24 | 1062 | 4538.88731312825 | -3476.88731312825 |
| 25 | 480 | 1361.76441651687 | -881.764416516867 |
| 26 | 559 | 509.642692359738 | 49.3573076402622 |
| 27 | 259 | 3348.34853607119 | -3089.34853607119 |
| 28 | 1340 | 3605.21625263978 | -2265.21625263978 |
| 29 | 275 | -1251.43828931633 | 1526.43828931633 |
| 30 | 12550 | 6726.5566978764 | 5823.4433021236 |
| 31 | 965 | -133.920723787436 | 1098.92072378744 |
| 32 | 25229 | 21954.6032473431 | 3274.39675265694 |
| 33 | 4883 | 4320.69386910496 | 562.306130895039 |
| 34 | 1189 | 2902.62791528493 | -1713.62791528493 |
| 35 | 226 | -1432.42259305307 | 1658.42259305307 |
| 36 | 611 | -159.633736076705 | 770.633736076705 |
| 37 | 404 | 634.666280826947 | -230.666280826947 |
| 38 | 576 | 428.804939418818 | 147.195060581182 |
| 39 | 3096 | NA | NA |
| 40 | 23193 | NA | NA |
| Goldfeld-Quandt test for Heteroskedasticity | |||
| p-values | Alternative Hypothesis | ||
| breakpoint index | greater | 2-sided | less |
| 7 | 7.35156510979815e-05 | 0.000147031302195963 | 0.999926484348902 |
| 8 | 0.99903156164834 | 0.00193687670332126 | 0.000968438351660631 |
| 9 | 0.997575271976056 | 0.00484945604788706 | 0.00242472802394353 |
| 10 | 0.99476906169955 | 0.0104618766008989 | 0.00523093830044946 |
| 11 | 0.995472090476433 | 0.00905581904713299 | 0.00452790952356649 |
| 12 | 0.996043718430613 | 0.00791256313877326 | 0.00395628156938663 |
| 13 | 0.998441174702988 | 0.00311765059402503 | 0.00155882529701251 |
| 14 | 0.99658806116768 | 0.00682387766464167 | 0.00341193883232083 |
| 15 | 0.994742702690276 | 0.0105145946194479 | 0.00525729730972396 |
| 16 | 0.994997802382926 | 0.0100043952341482 | 0.00500219761707409 |
| 17 | 0.995250705638012 | 0.0094985887239758 | 0.0047492943619879 |
| 18 | 0.99117201998372 | 0.0176559600325595 | 0.00882798001627974 |
| 19 | 0.988574037390353 | 0.0228519252192931 | 0.0114259626096466 |
| 20 | 0.983800541456962 | 0.032398917086075 | 0.0161994585430375 |
| 21 | 0.999774253441942 | 0.000451493116116514 | 0.000225746558058257 |
| 22 | 0.999844705909856 | 0.000310588180288354 | 0.000155294090144177 |
| 23 | 0.999845531849252 | 0.000308936301496924 | 0.000154468150748462 |
| 24 | 0.999881680196555 | 0.000236639606889891 | 0.000118319803444946 |
| 25 | 0.999565671762877 | 0.000868656474245455 | 0.000434328237122727 |
| 26 | 0.998587306966284 | 0.00282538606743157 | 0.00141269303371578 |
| 27 | 0.995725520155097 | 0.0085489596898066 | 0.0042744798449033 |
| 28 | 0.995886964045285 | 0.00822607190943098 | 0.00411303595471549 |
| 29 | 0.9900988838696 | 0.0198022322607982 | 0.00990111613039912 |
| 30 | 0.990908774963807 | 0.0181824500723856 | 0.00909122503619282 |
| 31 | 0.962570437927613 | 0.0748591241447737 | 0.0374295620723869 |
| 32 | 0.988556397195028 | 0.0228872056099445 | 0.0114436028049722 |
| 33 | 0.988733386529562 | 0.0225332269408753 | 0.0112666134704377 |
| Meta Analysis of Goldfeld-Quandt test for Heteroskedasticity | |||
| Description | # significant tests | % significant tests | OK/NOK |
| 1% type I error level | 16 | 0.592592592592593 | NOK |
| 5% type I error level | 26 | 0.962962962962963 | NOK |
| 10% type I error level | 27 | 1 | NOK |