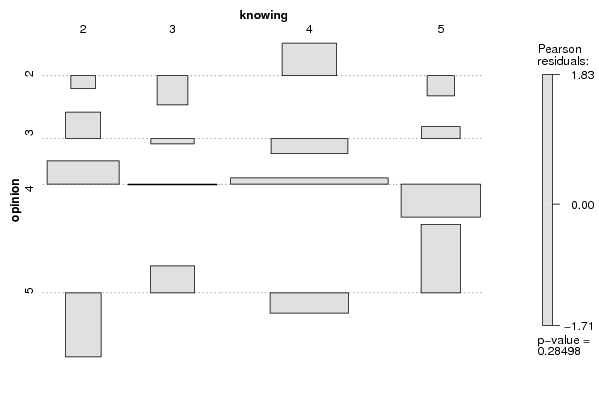
| Tabulation of Results | ||||
| opinion x knowing | ||||
| 2 | 3 | 4 | 5 | 2 | 1 | 1 | 9 | 1 | 3 | 4 | 4 | 12 | 4 | 4 | 14 | 18 | 58 | 11 | 5 | 0 | 6 | 12 | 7 |
| Tabulation of Expected Results | ||||
| opinion x knowing | ||||
| 2 | 3 | 4 | 5 | 2 | 1.41 | 2.15 | 6.74 | 1.7 | 3 | 2.81 | 4.3 | 13.48 | 3.41 | 4 | 11.85 | 18.08 | 56.73 | 14.34 | 5 | 2.93 | 4.48 | 14.04 | 3.55 |
| Statistical Results | |
| Pearson's Chi-squared test | |
| Chi Square Statistic | 10.87 |
| Degrees of Freedom | 9 |
| P value | 0.28 |