| Tabulation of Results | |||||
| experience x education | |||||
| 1 | 2 | 3 | 4 | 5 | 1 | 0 | 0 | 1 | 3 | 0 | 2 | 0 | 4 | 4 | 6 | 4 | 3 | 2 | 14 | 9 | 9 | 6 | 4 | 2 | 19 | 29 | 23 | 3 | 5 | 1 | 6 | 8 | 6 | 3 |
| Tabulation of Expected Results | |||||
| experience x education | |||||
| 1 | 2 | 3 | 4 | 5 | 1 | 0.12 | 1.06 | 1.26 | 1.16 | 0.4 | 2 | 0.56 | 4.78 | 5.67 | 5.22 | 1.78 | 3 | 1.23 | 10.62 | 12.59 | 11.6 | 3.95 | 4 | 2.35 | 20.17 | 23.93 | 22.05 | 7.51 | 5 | 0.74 | 6.37 | 7.56 | 6.96 | 2.37 |
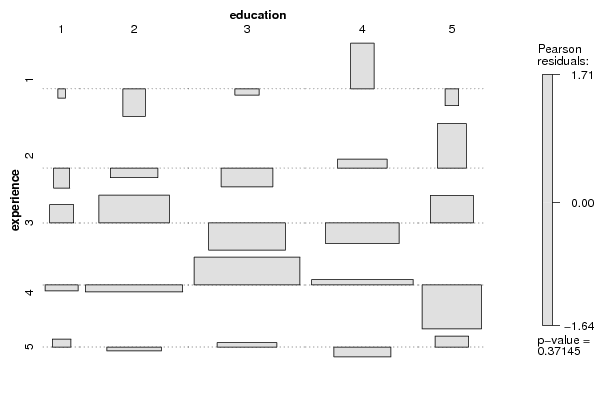
| Statistical Results | |
| Pearson's Chi-squared test | |
| Chi Square Statistic | 17.22 |
| Degrees of Freedom | 16 |
| P value | 0.37 |