| Multiple Linear Regression - Estimated Regression Equation |
| Upset[t] = + 1.74601216389936 + 0.345463384070261punished[t] -0.154588829233689highstandards[t] + 0.488395323128333outstandingperformance[t] + e[t] |
| Multiple Linear Regression - Ordinary Least Squares | |||||
| Variable | Parameter | S.D. | T-STAT H0: parameter = 0 | 2-tail p-value | 1-tail p-value |
| (Intercept) | 1.74601216389936 | 0.614826 | 2.8398 | 0.0067 | 0.00335 |
| punished | 0.345463384070261 | 0.190041 | 1.8178 | 0.075605 | 0.037802 |
| highstandards | -0.154588829233689 | 0.149388 | -1.0348 | 0.306165 | 0.153083 |
| outstandingperformance | 0.488395323128333 | 0.18699 | 2.6119 | 0.012121 | 0.00606 |
| Multiple Linear Regression - Regression Statistics | |
| Multiple R | 0.4156498702401 |
| R-squared | 0.172764814630612 |
| Adjusted R-squared | 0.118814693845652 |
| F-TEST (value) | 3.20230635477603 |
| F-TEST (DF numerator) | 3 |
| F-TEST (DF denominator) | 46 |
| p-value | 0.0318236506400493 |
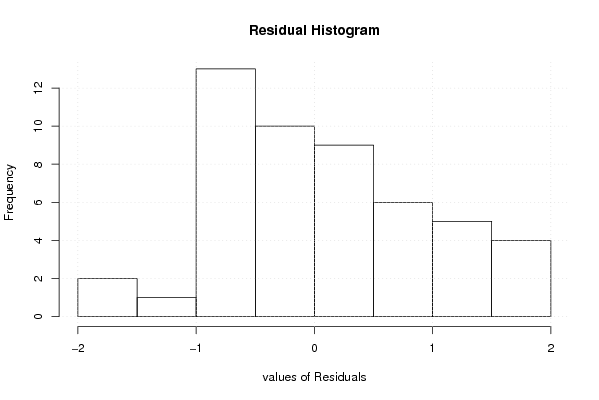
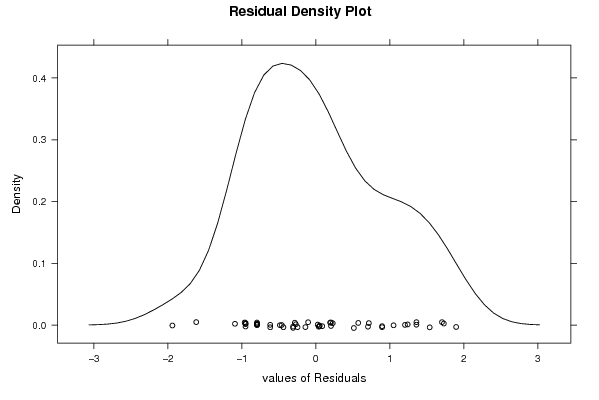
| Multiple Linear Regression - Residual Statistics | |
| Residual Standard Deviation | 0.941392931119065 |
| Sum Squared Residuals | 40.7661499350034 |
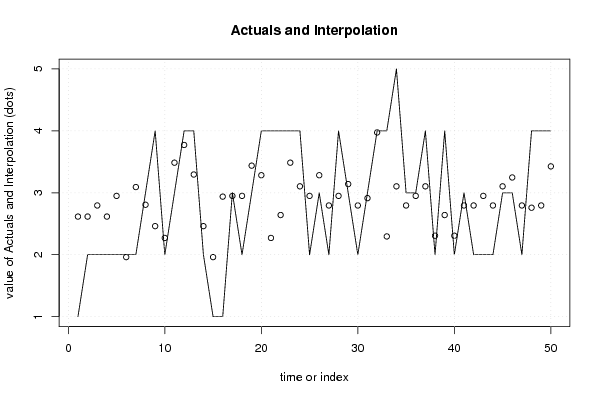
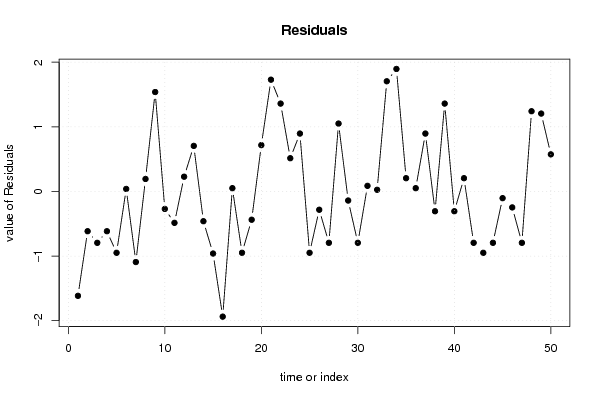
| Multiple Linear Regression - Actuals, Interpolation, and Residuals | |||
| Time or Index | Actuals | Interpolation Forecast | Residuals Prediction Error |
| 1 | 1 | 2.61615659670084 | -1.61615659670084 |
| 2 | 2 | 2.61615659670084 | -0.616156596700839 |
| 3 | 2 | 2.79537426136179 | -0.795374261361794 |
| 4 | 2 | 2.61615659670084 | -0.616156596700839 |
| 5 | 2 | 2.94996309059548 | -0.949963090595484 |
| 6 | 2 | 1.9615155541632 | 0.0384844458367991 |
| 7 | 2 | 3.09289502965356 | -1.09289502965356 |
| 8 | 3 | 2.80703115153741 | 0.192968848462588 |
| 9 | 4 | 2.46156776746715 | 1.53843223253285 |
| 10 | 2 | 2.27069321263058 | -0.270693212630578 |
| 11 | 3 | 3.48630102950232 | -0.486301029502317 |
| 12 | 4 | 3.77216490761846 | 0.227835092381539 |
| 13 | 4 | 3.29542647466574 | 0.704573525334255 |
| 14 | 2 | 2.46156776746715 | -0.461567767467151 |
| 15 | 1 | 1.9615155541632 | -0.961515554163201 |
| 16 | 1 | 2.93830620041987 | -1.93830620041987 |
| 17 | 3 | 2.94996309059548 | 0.0500369094045162 |
| 18 | 2 | 2.94996309059548 | -0.949963090595484 |
| 19 | 3 | 3.43835841372382 | -0.438358413723817 |
| 20 | 4 | 3.28376958449013 | 0.716230415509872 |
| 21 | 4 | 2.27069321263058 | 1.72930678736942 |
| 22 | 4 | 2.64078543212811 | 1.35921456787189 |
| 23 | 4 | 3.48630102950232 | 0.513698970497683 |
| 24 | 4 | 3.10455191982917 | 0.895448080170827 |
| 25 | 2 | 2.94996309059548 | -0.949963090595484 |
| 26 | 3 | 3.28376958449013 | -0.283769584490128 |
| 27 | 2 | 2.79537426136180 | -0.795374261361795 |
| 28 | 4 | 2.94996309059548 | 1.05003690940452 |
| 29 | 3 | 3.14083764543206 | -0.140837645432056 |
| 30 | 2 | 2.79537426136180 | -0.795374261361795 |
| 31 | 3 | 2.9136773649926 | 0.0863226350073999 |
| 32 | 4 | 3.97469635263065 | 0.0253036473693498 |
| 33 | 4 | 2.29532204805785 | 1.70467795194215 |
| 34 | 5 | 3.10455191982917 | 1.89544808017083 |
| 35 | 3 | 2.79537426136180 | 0.204625738638205 |
| 36 | 3 | 2.94996309059548 | 0.0500369094045162 |
| 37 | 4 | 3.10455191982917 | 0.895448080170827 |
| 38 | 2 | 2.30697893823346 | -0.306978938233462 |
| 39 | 4 | 2.64078543212811 | 1.35921456787189 |
| 40 | 2 | 2.30697893823346 | -0.306978938233462 |
| 41 | 3 | 2.79537426136180 | 0.204625738638205 |
| 42 | 2 | 2.79537426136180 | -0.795374261361795 |
| 43 | 2 | 2.94996309059548 | -0.949963090595484 |
| 44 | 2 | 2.79537426136180 | -0.795374261361795 |
| 45 | 3 | 3.10455191982917 | -0.104551919829173 |
| 46 | 3 | 3.24748385888724 | -0.247483858887244 |
| 47 | 2 | 2.79537426136180 | -0.795374261361795 |
| 48 | 4 | 2.75908853575891 | 1.24091146424109 |
| 49 | 4 | 2.79537426136180 | 1.20462573863821 |
| 50 | 4 | 3.4267015235482 | 0.5732984764518 |
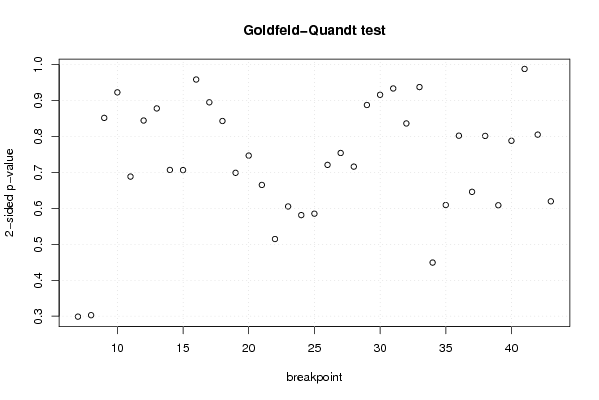
| Goldfeld-Quandt test for Heteroskedasticity | |||
| p-values | Alternative Hypothesis | ||
| breakpoint index | greater | 2-sided | less |
| 7 | 0.149378395244868 | 0.298756790489736 | 0.850621604755132 |
| 8 | 0.151407130103597 | 0.302814260207195 | 0.848592869896403 |
| 9 | 0.574156756015742 | 0.851686487968516 | 0.425843243984258 |
| 10 | 0.461351568726021 | 0.922703137452041 | 0.538648431273979 |
| 11 | 0.344207001244693 | 0.688414002489386 | 0.655792998755307 |
| 12 | 0.422189806429408 | 0.844379612858817 | 0.577810193570592 |
| 13 | 0.439004557434518 | 0.878009114869036 | 0.560995442565482 |
| 14 | 0.35341500306786 | 0.70683000613572 | 0.64658499693214 |
| 15 | 0.353283073970068 | 0.706566147940136 | 0.646716926029932 |
| 16 | 0.520770788381002 | 0.958458423237995 | 0.479229211618998 |
| 17 | 0.447507240541248 | 0.895014481082497 | 0.552492759458752 |
| 18 | 0.421514715259406 | 0.843029430518812 | 0.578485284740594 |
| 19 | 0.349439921198886 | 0.698879842397771 | 0.650560078801114 |
| 20 | 0.373394480968654 | 0.746788961937307 | 0.626605519031346 |
| 21 | 0.667434914749568 | 0.665130170500864 | 0.332565085250432 |
| 22 | 0.742630451296415 | 0.51473909740717 | 0.257369548703585 |
| 23 | 0.697342770351217 | 0.605314459297567 | 0.302657229648783 |
| 24 | 0.709375871363842 | 0.581248257272317 | 0.290624128636158 |
| 25 | 0.707381109451712 | 0.585237781096575 | 0.292618890548288 |
| 26 | 0.639498700000928 | 0.721002599998144 | 0.360501299999072 |
| 27 | 0.622970185523623 | 0.754059628952753 | 0.377029814476377 |
| 28 | 0.641942656009776 | 0.716114687980448 | 0.358057343990224 |
| 29 | 0.556222076476102 | 0.887555847047795 | 0.443777923523898 |
| 30 | 0.542021306940084 | 0.915957386119833 | 0.457978693059916 |
| 31 | 0.466781267236727 | 0.933562534473454 | 0.533218732763273 |
| 32 | 0.418116759543104 | 0.836233519086207 | 0.581883240456896 |
| 33 | 0.531281150945247 | 0.937437698109507 | 0.468718849054753 |
| 34 | 0.775410076898416 | 0.449179846203167 | 0.224589923101584 |
| 35 | 0.695327474190985 | 0.60934505161803 | 0.304672525809015 |
| 36 | 0.598928095105313 | 0.802143809789374 | 0.401071904894687 |
| 37 | 0.677031264978315 | 0.64593747004337 | 0.322968735021685 |
| 38 | 0.599262788862624 | 0.801474422274751 | 0.400737211137376 |
| 39 | 0.695687150916397 | 0.608625698167206 | 0.304312849083603 |
| 40 | 0.605998194664823 | 0.788003610670354 | 0.394001805335177 |
| 41 | 0.493922056353549 | 0.987844112707097 | 0.506077943646451 |
| 42 | 0.40255792217865 | 0.8051158443573 | 0.59744207782135 |
| 43 | 0.309812585848867 | 0.619625171697734 | 0.690187414151133 |
| Meta Analysis of Goldfeld-Quandt test for Heteroskedasticity | |||
| Description | # significant tests | % significant tests | OK/NOK |
| 1% type I error level | 0 | 0 | OK |
| 5% type I error level | 0 | 0 | OK |
| 10% type I error level | 0 | 0 | OK |