Free Statistics

of Irreproducible Research!

Author's title

Author*The author of this computation has been verified*
R Software Modulerwasp_multipleregression.wasp
Title produced by softwareMultiple Regression
Date of computationTue, 23 Nov 2010 12:18:38 +0000
Cite this page as followsStatistical Computations at FreeStatistics.org, Office for Research Development and Education, URL https://freestatistics.org/blog/index.php?v=date/2010/Nov/23/t1290514753t85vzlmsxvyt21s.htm/, Retrieved Thu, 25 Apr 2024 13:44:41 +0000
Statistical Computations at FreeStatistics.org, Office for Research Development and Education, URL https://freestatistics.org/blog/index.php?pk=98948, Retrieved Thu, 25 Apr 2024 13:44:41 +0000
QR Codes:

Original text written by user:
IsPrivate?No (this computation is public)
User-defined keywords
Estimated Impact133
Family? (F = Feedback message, R = changed R code, M = changed R Module, P = changed Parameters, D = changed Data)
-     [Multiple Regression] [Competence to learn] [2010-11-17 07:43:53] [b98453cac15ba1066b407e146608df68]
-   PD    [Multiple Regression] [ws7] [2010-11-23 12:18:38] [7a87ed98a7b21a29d6a45388a9b7b229] [Current]
-    D      [Multiple Regression] [ws7 Crime] [2010-11-23 15:19:28] [f4dc4aa51d65be851b8508203d9f6001]
Feedback Forum

Post a new message
Dataseries X:
184	40	74	11	31	20
213	32	72	11	43	18
347	57	70	18	16	16
565	31	71	11	25	19
327	67	72	9	29	24
260	25	68	8	32	15
325	34	68	12	24	14
102	33	62	13	28	11
38	36	69	7	25	12
226	31	66	9	58	15
137	35	60	13	21	9
369	30	81	4	77	36
109	44	66	9	37	12
809	32	67	11	37	16
29	30	65	12	35	11
245	16	64	10	42	14
118	29	64	12	21	10
148	36	62	7	81	27
387	30	59	15	31	16
98	23	56	15	50	15
608	33	46	22	24	8
218	35	54	14	27	13
254	38	54	20	22	11
697	44	45	26	18	8
827	28	57	12	23	11
693	35	57	9	60	18
448	31	61	19	14	12
942	39	52	17	31	10
1017	27	44	21	24	9
216	36	43	18	23	8
673	38	48	19	22	10
989	46	57	14	25	12
630	29	47	19	25	9
404	32	50	19	21	9
692	39	48	16	32	11
1517	44	49	13	31	14
879	33	72	13	13	22
631	43	59	14	21	13
1375	22	49	9	46	13
1139	30	54	13	27	12
3545	86	62	22	18	15
706	30	47	17	39	11
451	32	45	34	15	10
433	43	48	26	23	12
601	20	69	23	7	12
1024	55	42	23	23	11
457	44	49	18	30	12
1441	37	57	15	35	13
1022	82	72	22	15	16
1244	66	67	26	18	16


Summary of computational transaction
Raw Inputview raw input (R code)
Raw Outputview raw output of R engine
Computing time9 seconds
R Server'Gwilym Jenkins' @ 72.249.127.135

\begin{tabular}{lllllllll}
\hline
Summary of computational transaction \tabularnewline
Raw Input & view raw input (R code)  \tabularnewline
Raw Output & view raw output of R engine  \tabularnewline
Computing time & 9 seconds \tabularnewline
R Server & 'Gwilym Jenkins' @ 72.249.127.135 \tabularnewline
\hline
\end{tabular}
%Source: https://freestatistics.org/blog/index.php?pk=98948&T=0

[TABLE]
[ROW][C]Summary of computational transaction[/C][/ROW]
[ROW][C]Raw Input[/C][C]view raw input (R code) [/C][/ROW]
[ROW][C]Raw Output[/C][C]view raw output of R engine [/C][/ROW]
[ROW][C]Computing time[/C][C]9 seconds[/C][/ROW]
[ROW][C]R Server[/C][C]'Gwilym Jenkins' @ 72.249.127.135[/C][/ROW]
[/TABLE]
Source: https://freestatistics.org/blog/index.php?pk=98948&T=0

Globally Unique Identifier (entire table): ba.freestatistics.org/blog/index.php?pk=98948&T=0

As an alternative you can also use a QR Code:  

The GUIDs for individual cells are displayed in the table below:

Summary of computational transaction
Raw Inputview raw input (R code)
Raw Outputview raw output of R engine
Computing time9 seconds
R Server'Gwilym Jenkins' @ 72.249.127.135


Multiple Linear Regression - Estimated Regression Equation
Crimerate[t] = + 1171.26771409283 + 21.0103219132378Funding[t] -23.9108325876178`25+HSgraduate`[t] -7.09689304546211`Dropouts16-19`[t] -6.5648075481889`CollegeStudents18-24`[t] + 26.2734721567441`25+CollegeGrads`[t] + e[t]

\begin{tabular}{lllllllll}
\hline
Multiple Linear Regression - Estimated Regression Equation \tabularnewline
Crimerate[t] =  +  1171.26771409283 +  21.0103219132378Funding[t] -23.9108325876178`25+HSgraduate`[t] -7.09689304546211`Dropouts16-19`[t] -6.5648075481889`CollegeStudents18-24`[t] +  26.2734721567441`25+CollegeGrads`[t]  + e[t] \tabularnewline
\hline
\end{tabular}
%Source: https://freestatistics.org/blog/index.php?pk=98948&T=1

[TABLE]
[ROW][C]Multiple Linear Regression - Estimated Regression Equation[/C][/ROW]
[ROW][C]Crimerate[t] =  +  1171.26771409283 +  21.0103219132378Funding[t] -23.9108325876178`25+HSgraduate`[t] -7.09689304546211`Dropouts16-19`[t] -6.5648075481889`CollegeStudents18-24`[t] +  26.2734721567441`25+CollegeGrads`[t]  + e[t][/C][/ROW]
[/TABLE]
Source: https://freestatistics.org/blog/index.php?pk=98948&T=1

Globally Unique Identifier (entire table): ba.freestatistics.org/blog/index.php?pk=98948&T=1

As an alternative you can also use a QR Code:  

The GUIDs for individual cells are displayed in the table below:

Multiple Linear Regression - Estimated Regression Equation
Crimerate[t] = + 1171.26771409283 + 21.0103219132378Funding[t] -23.9108325876178`25+HSgraduate`[t] -7.09689304546211`Dropouts16-19`[t] -6.5648075481889`CollegeStudents18-24`[t] + 26.2734721567441`25+CollegeGrads`[t] + e[t]


Multiple Linear Regression - Ordinary Least Squares
VariableParameterS.D.T-STATH0: parameter = 02-tail p-value1-tail p-value
(Intercept)1171.26771409283920.5976821.27230.2099530.104976
Funding21.01032191323785.9983173.50270.001070.000535
`25+HSgraduate`-23.910832587617812.75304-1.87490.0674520.033726
`Dropouts16-19`-7.0968930454621119.593344-0.36220.718930.359465
`CollegeStudents18-24`-6.56480754818898.609098-0.76250.4498050.224902
`25+CollegeGrads`26.273472156744126.8050980.98020.3323630.166181

\begin{tabular}{lllllllll}
\hline
Multiple Linear Regression - Ordinary Least Squares \tabularnewline
Variable & Parameter & S.D. & T-STATH0: parameter = 0 & 2-tail p-value & 1-tail p-value \tabularnewline
(Intercept) & 1171.26771409283 & 920.597682 & 1.2723 & 0.209953 & 0.104976 \tabularnewline
Funding & 21.0103219132378 & 5.998317 & 3.5027 & 0.00107 & 0.000535 \tabularnewline
`25+HSgraduate` & -23.9108325876178 & 12.75304 & -1.8749 & 0.067452 & 0.033726 \tabularnewline
`Dropouts16-19` & -7.09689304546211 & 19.593344 & -0.3622 & 0.71893 & 0.359465 \tabularnewline
`CollegeStudents18-24` & -6.5648075481889 & 8.609098 & -0.7625 & 0.449805 & 0.224902 \tabularnewline
`25+CollegeGrads` & 26.2734721567441 & 26.805098 & 0.9802 & 0.332363 & 0.166181 \tabularnewline
\hline
\end{tabular}
%Source: https://freestatistics.org/blog/index.php?pk=98948&T=2

[TABLE]
[ROW][C]Multiple Linear Regression - Ordinary Least Squares[/C][/ROW]
[ROW][C]Variable[/C][C]Parameter[/C][C]S.D.[/C][C]T-STATH0: parameter = 0[/C][C]2-tail p-value[/C][C]1-tail p-value[/C][/ROW]
[ROW][C](Intercept)[/C][C]1171.26771409283[/C][C]920.597682[/C][C]1.2723[/C][C]0.209953[/C][C]0.104976[/C][/ROW]
[ROW][C]Funding[/C][C]21.0103219132378[/C][C]5.998317[/C][C]3.5027[/C][C]0.00107[/C][C]0.000535[/C][/ROW]
[ROW][C]`25+HSgraduate`[/C][C]-23.9108325876178[/C][C]12.75304[/C][C]-1.8749[/C][C]0.067452[/C][C]0.033726[/C][/ROW]
[ROW][C]`Dropouts16-19`[/C][C]-7.09689304546211[/C][C]19.593344[/C][C]-0.3622[/C][C]0.71893[/C][C]0.359465[/C][/ROW]
[ROW][C]`CollegeStudents18-24`[/C][C]-6.5648075481889[/C][C]8.609098[/C][C]-0.7625[/C][C]0.449805[/C][C]0.224902[/C][/ROW]
[ROW][C]`25+CollegeGrads`[/C][C]26.2734721567441[/C][C]26.805098[/C][C]0.9802[/C][C]0.332363[/C][C]0.166181[/C][/ROW]
[/TABLE]
Source: https://freestatistics.org/blog/index.php?pk=98948&T=2

Globally Unique Identifier (entire table): ba.freestatistics.org/blog/index.php?pk=98948&T=2

As an alternative you can also use a QR Code:  

The GUIDs for individual cells are displayed in the table below:

Multiple Linear Regression - Ordinary Least Squares
VariableParameterS.D.T-STATH0: parameter = 02-tail p-value1-tail p-value
(Intercept)1171.26771409283920.5976821.27230.2099530.104976
Funding21.01032191323785.9983173.50270.001070.000535
`25+HSgraduate`-23.910832587617812.75304-1.87490.0674520.033726
`Dropouts16-19`-7.0968930454621119.593344-0.36220.718930.359465
`CollegeStudents18-24`-6.56480754818898.609098-0.76250.4498050.224902
`25+CollegeGrads`26.273472156744126.8050980.98020.3323630.166181


Multiple Linear Regression - Regression Statistics
Multiple R0.579348289671035
R-squared0.335644440744753
Adjusted R-squared0.260149490829384
F-TEST (value)4.44591911274881
F-TEST (DF numerator)5
F-TEST (DF denominator)44
p-value0.00230284525919422
Multiple Linear Regression - Residual Statistics
Residual Standard Deviation493.499245200084
Sum Squared Residuals10715826.2205743

\begin{tabular}{lllllllll}
\hline
Multiple Linear Regression - Regression Statistics \tabularnewline
Multiple R & 0.579348289671035 \tabularnewline
R-squared & 0.335644440744753 \tabularnewline
Adjusted R-squared & 0.260149490829384 \tabularnewline
F-TEST (value) & 4.44591911274881 \tabularnewline
F-TEST (DF numerator) & 5 \tabularnewline
F-TEST (DF denominator) & 44 \tabularnewline
p-value & 0.00230284525919422 \tabularnewline
Multiple Linear Regression - Residual Statistics \tabularnewline
Residual Standard Deviation & 493.499245200084 \tabularnewline
Sum Squared Residuals & 10715826.2205743 \tabularnewline
\hline
\end{tabular}
%Source: https://freestatistics.org/blog/index.php?pk=98948&T=3

[TABLE]
[ROW][C]Multiple Linear Regression - Regression Statistics[/C][/ROW]
[ROW][C]Multiple R[/C][C]0.579348289671035[/C][/ROW]
[ROW][C]R-squared[/C][C]0.335644440744753[/C][/ROW]
[ROW][C]Adjusted R-squared[/C][C]0.260149490829384[/C][/ROW]
[ROW][C]F-TEST (value)[/C][C]4.44591911274881[/C][/ROW]
[ROW][C]F-TEST (DF numerator)[/C][C]5[/C][/ROW]
[ROW][C]F-TEST (DF denominator)[/C][C]44[/C][/ROW]
[ROW][C]p-value[/C][C]0.00230284525919422[/C][/ROW]
[ROW][C]Multiple Linear Regression - Residual Statistics[/C][/ROW]
[ROW][C]Residual Standard Deviation[/C][C]493.499245200084[/C][/ROW]
[ROW][C]Sum Squared Residuals[/C][C]10715826.2205743[/C][/ROW]
[/TABLE]
Source: https://freestatistics.org/blog/index.php?pk=98948&T=3

Globally Unique Identifier (entire table): ba.freestatistics.org/blog/index.php?pk=98948&T=3

As an alternative you can also use a QR Code:  

The GUIDs for individual cells are displayed in the table below:

Multiple Linear Regression - Regression Statistics
Multiple R0.579348289671035
R-squared0.335644440744753
Adjusted R-squared0.260149490829384
F-TEST (value)4.44591911274881
F-TEST (DF numerator)5
F-TEST (DF denominator)44
p-value0.00230284525919422
Multiple Linear Regression - Residual Statistics
Residual Standard Deviation493.499245200084
Sum Squared Residuals10715826.2205743


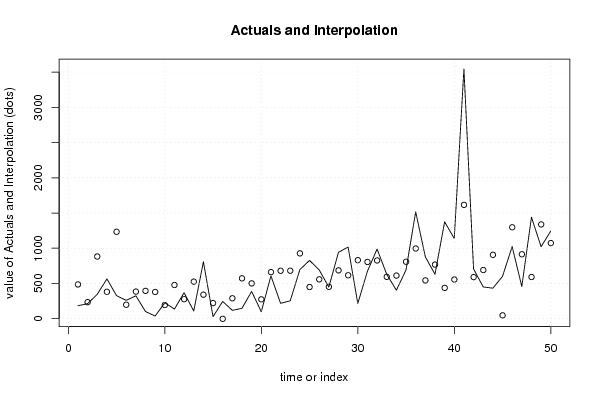
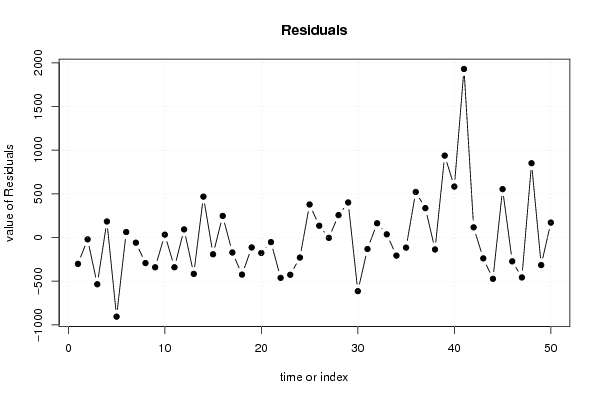
Multiple Linear Regression - Actuals, Interpolation, and Residuals
Time or IndexActualsInterpolationForecastResidualsPrediction Error
1184486.173564779561-302.173564779561
2213234.588019757143-21.5880197571431
3347882.692340932702-535.692340932702
4565381.928538455668183.071461544332
53271233.6912114265-906.6912114265
6260197.84224241118262.1577575888176
7325384.792555677241-59.7925556772414
8102395.070689581261-293.070689581261
938379.275080281733-341.275080281733
10226193.94394976747232.0560502325284
11137478.319707106806-341.319707106806
12369276.76717614331392.2328238566865
13109526.118676681298-417.118676681298
14809340.984083670878468.015916329122
1529221.450466286834-192.450466286834
16245-1.72265818704375246.722658187044
17118289.984810479114-171.984810479114
18148573.123768047641-425.123768047641
19387501.25137365263-114.251373652630
2098274.906802450486-176.906802450486
21608661.21078729651-53.2107872965103
22218680.392852924894-462.392852924894
23254681.119553819291-427.119553819291
24697927.236434037029-230.236434037029
25827449.494173739568377.505826260432
26693558.873532082838134.126467917162
27448452.560297901019-4.56029790101876
28942685.885479953707256.114520046293
291017616.340886194525400.659113805475
30216830.926630529115-614.926630529115
31673805.407970233716-132.407970233716
32989826.63003914729162.369960852710
33630594.25801080088335.7419891991172
34404611.815708970498-207.815708970498
35692808.334367958195-116.334367958195
361517996.151048091574520.848951908426
37879543.4426706521335.557329347899
38631768.310110581841-137.310110581841
391375437.565952802613937.434047197387
401139556.164664247423582.835335752577
4135451615.487677682571929.51232231743
42706590.101757443888115.898242556112
43451690.578793672533-239.578793672533
44433906.76346524697-473.76346524697
4560147.7261768099338553.273823190066
4610241297.36953071117-273.369530711173
47457914.684446098964-457.684446098964
481441591.065645557543849.934354442457
4910221338.30595895475-316.305958954752
5012441073.61297645462170.387023545379

\begin{tabular}{lllllllll}
\hline
Multiple Linear Regression - Actuals, Interpolation, and Residuals \tabularnewline
Time or Index & Actuals & InterpolationForecast & ResidualsPrediction Error \tabularnewline
1 & 184 & 486.173564779561 & -302.173564779561 \tabularnewline
2 & 213 & 234.588019757143 & -21.5880197571431 \tabularnewline
3 & 347 & 882.692340932702 & -535.692340932702 \tabularnewline
4 & 565 & 381.928538455668 & 183.071461544332 \tabularnewline
5 & 327 & 1233.6912114265 & -906.6912114265 \tabularnewline
6 & 260 & 197.842242411182 & 62.1577575888176 \tabularnewline
7 & 325 & 384.792555677241 & -59.7925556772414 \tabularnewline
8 & 102 & 395.070689581261 & -293.070689581261 \tabularnewline
9 & 38 & 379.275080281733 & -341.275080281733 \tabularnewline
10 & 226 & 193.943949767472 & 32.0560502325284 \tabularnewline
11 & 137 & 478.319707106806 & -341.319707106806 \tabularnewline
12 & 369 & 276.767176143313 & 92.2328238566865 \tabularnewline
13 & 109 & 526.118676681298 & -417.118676681298 \tabularnewline
14 & 809 & 340.984083670878 & 468.015916329122 \tabularnewline
15 & 29 & 221.450466286834 & -192.450466286834 \tabularnewline
16 & 245 & -1.72265818704375 & 246.722658187044 \tabularnewline
17 & 118 & 289.984810479114 & -171.984810479114 \tabularnewline
18 & 148 & 573.123768047641 & -425.123768047641 \tabularnewline
19 & 387 & 501.25137365263 & -114.251373652630 \tabularnewline
20 & 98 & 274.906802450486 & -176.906802450486 \tabularnewline
21 & 608 & 661.21078729651 & -53.2107872965103 \tabularnewline
22 & 218 & 680.392852924894 & -462.392852924894 \tabularnewline
23 & 254 & 681.119553819291 & -427.119553819291 \tabularnewline
24 & 697 & 927.236434037029 & -230.236434037029 \tabularnewline
25 & 827 & 449.494173739568 & 377.505826260432 \tabularnewline
26 & 693 & 558.873532082838 & 134.126467917162 \tabularnewline
27 & 448 & 452.560297901019 & -4.56029790101876 \tabularnewline
28 & 942 & 685.885479953707 & 256.114520046293 \tabularnewline
29 & 1017 & 616.340886194525 & 400.659113805475 \tabularnewline
30 & 216 & 830.926630529115 & -614.926630529115 \tabularnewline
31 & 673 & 805.407970233716 & -132.407970233716 \tabularnewline
32 & 989 & 826.63003914729 & 162.369960852710 \tabularnewline
33 & 630 & 594.258010800883 & 35.7419891991172 \tabularnewline
34 & 404 & 611.815708970498 & -207.815708970498 \tabularnewline
35 & 692 & 808.334367958195 & -116.334367958195 \tabularnewline
36 & 1517 & 996.151048091574 & 520.848951908426 \tabularnewline
37 & 879 & 543.4426706521 & 335.557329347899 \tabularnewline
38 & 631 & 768.310110581841 & -137.310110581841 \tabularnewline
39 & 1375 & 437.565952802613 & 937.434047197387 \tabularnewline
40 & 1139 & 556.164664247423 & 582.835335752577 \tabularnewline
41 & 3545 & 1615.48767768257 & 1929.51232231743 \tabularnewline
42 & 706 & 590.101757443888 & 115.898242556112 \tabularnewline
43 & 451 & 690.578793672533 & -239.578793672533 \tabularnewline
44 & 433 & 906.76346524697 & -473.76346524697 \tabularnewline
45 & 601 & 47.7261768099338 & 553.273823190066 \tabularnewline
46 & 1024 & 1297.36953071117 & -273.369530711173 \tabularnewline
47 & 457 & 914.684446098964 & -457.684446098964 \tabularnewline
48 & 1441 & 591.065645557543 & 849.934354442457 \tabularnewline
49 & 1022 & 1338.30595895475 & -316.305958954752 \tabularnewline
50 & 1244 & 1073.61297645462 & 170.387023545379 \tabularnewline
\hline
\end{tabular}
%Source: https://freestatistics.org/blog/index.php?pk=98948&T=4

[TABLE]
[ROW][C]Multiple Linear Regression - Actuals, Interpolation, and Residuals[/C][/ROW]
[ROW][C]Time or Index[/C][C]Actuals[/C][C]InterpolationForecast[/C][C]ResidualsPrediction Error[/C][/ROW]
[ROW][C]1[/C][C]184[/C][C]486.173564779561[/C][C]-302.173564779561[/C][/ROW]
[ROW][C]2[/C][C]213[/C][C]234.588019757143[/C][C]-21.5880197571431[/C][/ROW]
[ROW][C]3[/C][C]347[/C][C]882.692340932702[/C][C]-535.692340932702[/C][/ROW]
[ROW][C]4[/C][C]565[/C][C]381.928538455668[/C][C]183.071461544332[/C][/ROW]
[ROW][C]5[/C][C]327[/C][C]1233.6912114265[/C][C]-906.6912114265[/C][/ROW]
[ROW][C]6[/C][C]260[/C][C]197.842242411182[/C][C]62.1577575888176[/C][/ROW]
[ROW][C]7[/C][C]325[/C][C]384.792555677241[/C][C]-59.7925556772414[/C][/ROW]
[ROW][C]8[/C][C]102[/C][C]395.070689581261[/C][C]-293.070689581261[/C][/ROW]
[ROW][C]9[/C][C]38[/C][C]379.275080281733[/C][C]-341.275080281733[/C][/ROW]
[ROW][C]10[/C][C]226[/C][C]193.943949767472[/C][C]32.0560502325284[/C][/ROW]
[ROW][C]11[/C][C]137[/C][C]478.319707106806[/C][C]-341.319707106806[/C][/ROW]
[ROW][C]12[/C][C]369[/C][C]276.767176143313[/C][C]92.2328238566865[/C][/ROW]
[ROW][C]13[/C][C]109[/C][C]526.118676681298[/C][C]-417.118676681298[/C][/ROW]
[ROW][C]14[/C][C]809[/C][C]340.984083670878[/C][C]468.015916329122[/C][/ROW]
[ROW][C]15[/C][C]29[/C][C]221.450466286834[/C][C]-192.450466286834[/C][/ROW]
[ROW][C]16[/C][C]245[/C][C]-1.72265818704375[/C][C]246.722658187044[/C][/ROW]
[ROW][C]17[/C][C]118[/C][C]289.984810479114[/C][C]-171.984810479114[/C][/ROW]
[ROW][C]18[/C][C]148[/C][C]573.123768047641[/C][C]-425.123768047641[/C][/ROW]
[ROW][C]19[/C][C]387[/C][C]501.25137365263[/C][C]-114.251373652630[/C][/ROW]
[ROW][C]20[/C][C]98[/C][C]274.906802450486[/C][C]-176.906802450486[/C][/ROW]
[ROW][C]21[/C][C]608[/C][C]661.21078729651[/C][C]-53.2107872965103[/C][/ROW]
[ROW][C]22[/C][C]218[/C][C]680.392852924894[/C][C]-462.392852924894[/C][/ROW]
[ROW][C]23[/C][C]254[/C][C]681.119553819291[/C][C]-427.119553819291[/C][/ROW]
[ROW][C]24[/C][C]697[/C][C]927.236434037029[/C][C]-230.236434037029[/C][/ROW]
[ROW][C]25[/C][C]827[/C][C]449.494173739568[/C][C]377.505826260432[/C][/ROW]
[ROW][C]26[/C][C]693[/C][C]558.873532082838[/C][C]134.126467917162[/C][/ROW]
[ROW][C]27[/C][C]448[/C][C]452.560297901019[/C][C]-4.56029790101876[/C][/ROW]
[ROW][C]28[/C][C]942[/C][C]685.885479953707[/C][C]256.114520046293[/C][/ROW]
[ROW][C]29[/C][C]1017[/C][C]616.340886194525[/C][C]400.659113805475[/C][/ROW]
[ROW][C]30[/C][C]216[/C][C]830.926630529115[/C][C]-614.926630529115[/C][/ROW]
[ROW][C]31[/C][C]673[/C][C]805.407970233716[/C][C]-132.407970233716[/C][/ROW]
[ROW][C]32[/C][C]989[/C][C]826.63003914729[/C][C]162.369960852710[/C][/ROW]
[ROW][C]33[/C][C]630[/C][C]594.258010800883[/C][C]35.7419891991172[/C][/ROW]
[ROW][C]34[/C][C]404[/C][C]611.815708970498[/C][C]-207.815708970498[/C][/ROW]
[ROW][C]35[/C][C]692[/C][C]808.334367958195[/C][C]-116.334367958195[/C][/ROW]
[ROW][C]36[/C][C]1517[/C][C]996.151048091574[/C][C]520.848951908426[/C][/ROW]
[ROW][C]37[/C][C]879[/C][C]543.4426706521[/C][C]335.557329347899[/C][/ROW]
[ROW][C]38[/C][C]631[/C][C]768.310110581841[/C][C]-137.310110581841[/C][/ROW]
[ROW][C]39[/C][C]1375[/C][C]437.565952802613[/C][C]937.434047197387[/C][/ROW]
[ROW][C]40[/C][C]1139[/C][C]556.164664247423[/C][C]582.835335752577[/C][/ROW]
[ROW][C]41[/C][C]3545[/C][C]1615.48767768257[/C][C]1929.51232231743[/C][/ROW]
[ROW][C]42[/C][C]706[/C][C]590.101757443888[/C][C]115.898242556112[/C][/ROW]
[ROW][C]43[/C][C]451[/C][C]690.578793672533[/C][C]-239.578793672533[/C][/ROW]
[ROW][C]44[/C][C]433[/C][C]906.76346524697[/C][C]-473.76346524697[/C][/ROW]
[ROW][C]45[/C][C]601[/C][C]47.7261768099338[/C][C]553.273823190066[/C][/ROW]
[ROW][C]46[/C][C]1024[/C][C]1297.36953071117[/C][C]-273.369530711173[/C][/ROW]
[ROW][C]47[/C][C]457[/C][C]914.684446098964[/C][C]-457.684446098964[/C][/ROW]
[ROW][C]48[/C][C]1441[/C][C]591.065645557543[/C][C]849.934354442457[/C][/ROW]
[ROW][C]49[/C][C]1022[/C][C]1338.30595895475[/C][C]-316.305958954752[/C][/ROW]
[ROW][C]50[/C][C]1244[/C][C]1073.61297645462[/C][C]170.387023545379[/C][/ROW]
[/TABLE]
Source: https://freestatistics.org/blog/index.php?pk=98948&T=4

Globally Unique Identifier (entire table): ba.freestatistics.org/blog/index.php?pk=98948&T=4

As an alternative you can also use a QR Code:  

The GUIDs for individual cells are displayed in the table below:

Multiple Linear Regression - Actuals, Interpolation, and Residuals
Time or IndexActualsInterpolationForecastResidualsPrediction Error
1184486.173564779561-302.173564779561
2213234.588019757143-21.5880197571431
3347882.692340932702-535.692340932702
4565381.928538455668183.071461544332
53271233.6912114265-906.6912114265
6260197.84224241118262.1577575888176
7325384.792555677241-59.7925556772414
8102395.070689581261-293.070689581261
938379.275080281733-341.275080281733
10226193.94394976747232.0560502325284
11137478.319707106806-341.319707106806
12369276.76717614331392.2328238566865
13109526.118676681298-417.118676681298
14809340.984083670878468.015916329122
1529221.450466286834-192.450466286834
16245-1.72265818704375246.722658187044
17118289.984810479114-171.984810479114
18148573.123768047641-425.123768047641
19387501.25137365263-114.251373652630
2098274.906802450486-176.906802450486
21608661.21078729651-53.2107872965103
22218680.392852924894-462.392852924894
23254681.119553819291-427.119553819291
24697927.236434037029-230.236434037029
25827449.494173739568377.505826260432
26693558.873532082838134.126467917162
27448452.560297901019-4.56029790101876
28942685.885479953707256.114520046293
291017616.340886194525400.659113805475
30216830.926630529115-614.926630529115
31673805.407970233716-132.407970233716
32989826.63003914729162.369960852710
33630594.25801080088335.7419891991172
34404611.815708970498-207.815708970498
35692808.334367958195-116.334367958195
361517996.151048091574520.848951908426
37879543.4426706521335.557329347899
38631768.310110581841-137.310110581841
391375437.565952802613937.434047197387
401139556.164664247423582.835335752577
4135451615.487677682571929.51232231743
42706590.101757443888115.898242556112
43451690.578793672533-239.578793672533
44433906.76346524697-473.76346524697
4560147.7261768099338553.273823190066
4610241297.36953071117-273.369530711173
47457914.684446098964-457.684446098964
481441591.065645557543849.934354442457
4910221338.30595895475-316.305958954752
5012441073.61297645462170.387023545379


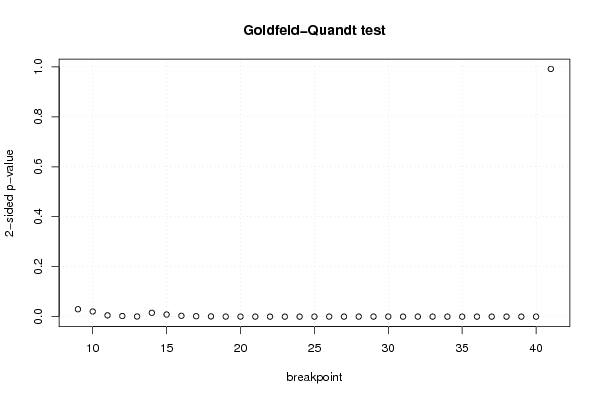
Goldfeld-Quandt test for Heteroskedasticity
p-valuesAlternative Hypothesis
breakpoint indexgreater2-sidedless
90.01487084880243180.02974169760486370.985129151197568
100.01030493471911070.02060986943822130.98969506528089
110.002634112264673030.005268224529346060.997365887735327
120.001209380996388550.002418761992777090.998790619003611
130.0003603367646157070.0007206735292314140.999639663235384
140.007765927166274260.01553185433254850.992234072833726
150.004298331891866160.008596663783732310.995701668108134
160.001723366135306960.003446732270613930.998276633864693
170.0008616410865058820.001723282173011760.999138358913494
180.0004957808673747710.0009915617347495420.999504219132625
190.0001790943456719920.0003581886913439840.999820905654328
209.36609231010158e-050.0001873218462020320.999906339076899
216.8632824701065e-050.000137265649402130.9999313671753
224.05731542604472e-058.11463085208944e-050.99995942684574
232.26132406784822e-054.52264813569645e-050.999977386759322
241.28592512865821e-052.57185025731641e-050.999987140748713
255.41325695651078e-050.0001082651391302160.999945867430435
260.0001438368013870970.0002876736027741940.999856163198613
275.50283007853729e-050.0001100566015707460.999944971699215
280.0001279483488029810.0002558966976059620.999872051651197
290.0001503642130645340.0003007284261290680.999849635786936
300.0002024629962245160.0004049259924490330.999797537003775
318.36988531055383e-050.0001673977062110770.999916301146894
320.0001483114668812790.0002966229337625570.999851688533119
335.72101955597952e-050.0001144203911195900.99994278980444
342.52450014706135e-055.04900029412271e-050.99997475499853
351.21530895831621e-052.43061791663242e-050.999987846910417
364.12944674743667e-058.25889349487334e-050.999958705532526
371.72170431611879e-053.44340863223757e-050.999982782956839
381.42908300143164e-052.85816600286328e-050.999985709169986
392.47357962928637e-054.94715925857275e-050.999975264203707
401.31996869004974e-052.63993738009949e-050.9999868003131
410.4958227579899600.9916455159799210.504177242010040

\begin{tabular}{lllllllll}
\hline
Goldfeld-Quandt test for Heteroskedasticity \tabularnewline
p-values & Alternative Hypothesis \tabularnewline
breakpoint index & greater & 2-sided & less \tabularnewline
9 & 0.0148708488024318 & 0.0297416976048637 & 0.985129151197568 \tabularnewline
10 & 0.0103049347191107 & 0.0206098694382213 & 0.98969506528089 \tabularnewline
11 & 0.00263411226467303 & 0.00526822452934606 & 0.997365887735327 \tabularnewline
12 & 0.00120938099638855 & 0.00241876199277709 & 0.998790619003611 \tabularnewline
13 & 0.000360336764615707 & 0.000720673529231414 & 0.999639663235384 \tabularnewline
14 & 0.00776592716627426 & 0.0155318543325485 & 0.992234072833726 \tabularnewline
15 & 0.00429833189186616 & 0.00859666378373231 & 0.995701668108134 \tabularnewline
16 & 0.00172336613530696 & 0.00344673227061393 & 0.998276633864693 \tabularnewline
17 & 0.000861641086505882 & 0.00172328217301176 & 0.999138358913494 \tabularnewline
18 & 0.000495780867374771 & 0.000991561734749542 & 0.999504219132625 \tabularnewline
19 & 0.000179094345671992 & 0.000358188691343984 & 0.999820905654328 \tabularnewline
20 & 9.36609231010158e-05 & 0.000187321846202032 & 0.999906339076899 \tabularnewline
21 & 6.8632824701065e-05 & 0.00013726564940213 & 0.9999313671753 \tabularnewline
22 & 4.05731542604472e-05 & 8.11463085208944e-05 & 0.99995942684574 \tabularnewline
23 & 2.26132406784822e-05 & 4.52264813569645e-05 & 0.999977386759322 \tabularnewline
24 & 1.28592512865821e-05 & 2.57185025731641e-05 & 0.999987140748713 \tabularnewline
25 & 5.41325695651078e-05 & 0.000108265139130216 & 0.999945867430435 \tabularnewline
26 & 0.000143836801387097 & 0.000287673602774194 & 0.999856163198613 \tabularnewline
27 & 5.50283007853729e-05 & 0.000110056601570746 & 0.999944971699215 \tabularnewline
28 & 0.000127948348802981 & 0.000255896697605962 & 0.999872051651197 \tabularnewline
29 & 0.000150364213064534 & 0.000300728426129068 & 0.999849635786936 \tabularnewline
30 & 0.000202462996224516 & 0.000404925992449033 & 0.999797537003775 \tabularnewline
31 & 8.36988531055383e-05 & 0.000167397706211077 & 0.999916301146894 \tabularnewline
32 & 0.000148311466881279 & 0.000296622933762557 & 0.999851688533119 \tabularnewline
33 & 5.72101955597952e-05 & 0.000114420391119590 & 0.99994278980444 \tabularnewline
34 & 2.52450014706135e-05 & 5.04900029412271e-05 & 0.99997475499853 \tabularnewline
35 & 1.21530895831621e-05 & 2.43061791663242e-05 & 0.999987846910417 \tabularnewline
36 & 4.12944674743667e-05 & 8.25889349487334e-05 & 0.999958705532526 \tabularnewline
37 & 1.72170431611879e-05 & 3.44340863223757e-05 & 0.999982782956839 \tabularnewline
38 & 1.42908300143164e-05 & 2.85816600286328e-05 & 0.999985709169986 \tabularnewline
39 & 2.47357962928637e-05 & 4.94715925857275e-05 & 0.999975264203707 \tabularnewline
40 & 1.31996869004974e-05 & 2.63993738009949e-05 & 0.9999868003131 \tabularnewline
41 & 0.495822757989960 & 0.991645515979921 & 0.504177242010040 \tabularnewline
\hline
\end{tabular}
%Source: https://freestatistics.org/blog/index.php?pk=98948&T=5

[TABLE]
[ROW][C]Goldfeld-Quandt test for Heteroskedasticity[/C][/ROW]
[ROW][C]p-values[/C][C]Alternative Hypothesis[/C][/ROW]
[ROW][C]breakpoint index[/C][C]greater[/C][C]2-sided[/C][C]less[/C][/ROW]
[ROW][C]9[/C][C]0.0148708488024318[/C][C]0.0297416976048637[/C][C]0.985129151197568[/C][/ROW]
[ROW][C]10[/C][C]0.0103049347191107[/C][C]0.0206098694382213[/C][C]0.98969506528089[/C][/ROW]
[ROW][C]11[/C][C]0.00263411226467303[/C][C]0.00526822452934606[/C][C]0.997365887735327[/C][/ROW]
[ROW][C]12[/C][C]0.00120938099638855[/C][C]0.00241876199277709[/C][C]0.998790619003611[/C][/ROW]
[ROW][C]13[/C][C]0.000360336764615707[/C][C]0.000720673529231414[/C][C]0.999639663235384[/C][/ROW]
[ROW][C]14[/C][C]0.00776592716627426[/C][C]0.0155318543325485[/C][C]0.992234072833726[/C][/ROW]
[ROW][C]15[/C][C]0.00429833189186616[/C][C]0.00859666378373231[/C][C]0.995701668108134[/C][/ROW]
[ROW][C]16[/C][C]0.00172336613530696[/C][C]0.00344673227061393[/C][C]0.998276633864693[/C][/ROW]
[ROW][C]17[/C][C]0.000861641086505882[/C][C]0.00172328217301176[/C][C]0.999138358913494[/C][/ROW]
[ROW][C]18[/C][C]0.000495780867374771[/C][C]0.000991561734749542[/C][C]0.999504219132625[/C][/ROW]
[ROW][C]19[/C][C]0.000179094345671992[/C][C]0.000358188691343984[/C][C]0.999820905654328[/C][/ROW]
[ROW][C]20[/C][C]9.36609231010158e-05[/C][C]0.000187321846202032[/C][C]0.999906339076899[/C][/ROW]
[ROW][C]21[/C][C]6.8632824701065e-05[/C][C]0.00013726564940213[/C][C]0.9999313671753[/C][/ROW]
[ROW][C]22[/C][C]4.05731542604472e-05[/C][C]8.11463085208944e-05[/C][C]0.99995942684574[/C][/ROW]
[ROW][C]23[/C][C]2.26132406784822e-05[/C][C]4.52264813569645e-05[/C][C]0.999977386759322[/C][/ROW]
[ROW][C]24[/C][C]1.28592512865821e-05[/C][C]2.57185025731641e-05[/C][C]0.999987140748713[/C][/ROW]
[ROW][C]25[/C][C]5.41325695651078e-05[/C][C]0.000108265139130216[/C][C]0.999945867430435[/C][/ROW]
[ROW][C]26[/C][C]0.000143836801387097[/C][C]0.000287673602774194[/C][C]0.999856163198613[/C][/ROW]
[ROW][C]27[/C][C]5.50283007853729e-05[/C][C]0.000110056601570746[/C][C]0.999944971699215[/C][/ROW]
[ROW][C]28[/C][C]0.000127948348802981[/C][C]0.000255896697605962[/C][C]0.999872051651197[/C][/ROW]
[ROW][C]29[/C][C]0.000150364213064534[/C][C]0.000300728426129068[/C][C]0.999849635786936[/C][/ROW]
[ROW][C]30[/C][C]0.000202462996224516[/C][C]0.000404925992449033[/C][C]0.999797537003775[/C][/ROW]
[ROW][C]31[/C][C]8.36988531055383e-05[/C][C]0.000167397706211077[/C][C]0.999916301146894[/C][/ROW]
[ROW][C]32[/C][C]0.000148311466881279[/C][C]0.000296622933762557[/C][C]0.999851688533119[/C][/ROW]
[ROW][C]33[/C][C]5.72101955597952e-05[/C][C]0.000114420391119590[/C][C]0.99994278980444[/C][/ROW]
[ROW][C]34[/C][C]2.52450014706135e-05[/C][C]5.04900029412271e-05[/C][C]0.99997475499853[/C][/ROW]
[ROW][C]35[/C][C]1.21530895831621e-05[/C][C]2.43061791663242e-05[/C][C]0.999987846910417[/C][/ROW]
[ROW][C]36[/C][C]4.12944674743667e-05[/C][C]8.25889349487334e-05[/C][C]0.999958705532526[/C][/ROW]
[ROW][C]37[/C][C]1.72170431611879e-05[/C][C]3.44340863223757e-05[/C][C]0.999982782956839[/C][/ROW]
[ROW][C]38[/C][C]1.42908300143164e-05[/C][C]2.85816600286328e-05[/C][C]0.999985709169986[/C][/ROW]
[ROW][C]39[/C][C]2.47357962928637e-05[/C][C]4.94715925857275e-05[/C][C]0.999975264203707[/C][/ROW]
[ROW][C]40[/C][C]1.31996869004974e-05[/C][C]2.63993738009949e-05[/C][C]0.9999868003131[/C][/ROW]
[ROW][C]41[/C][C]0.495822757989960[/C][C]0.991645515979921[/C][C]0.504177242010040[/C][/ROW]
[/TABLE]
Source: https://freestatistics.org/blog/index.php?pk=98948&T=5

Globally Unique Identifier (entire table): ba.freestatistics.org/blog/index.php?pk=98948&T=5

As an alternative you can also use a QR Code:  

The GUIDs for individual cells are displayed in the table below:

Goldfeld-Quandt test for Heteroskedasticity
p-valuesAlternative Hypothesis
breakpoint indexgreater2-sidedless
90.01487084880243180.02974169760486370.985129151197568
100.01030493471911070.02060986943822130.98969506528089
110.002634112264673030.005268224529346060.997365887735327
120.001209380996388550.002418761992777090.998790619003611
130.0003603367646157070.0007206735292314140.999639663235384
140.007765927166274260.01553185433254850.992234072833726
150.004298331891866160.008596663783732310.995701668108134
160.001723366135306960.003446732270613930.998276633864693
170.0008616410865058820.001723282173011760.999138358913494
180.0004957808673747710.0009915617347495420.999504219132625
190.0001790943456719920.0003581886913439840.999820905654328
209.36609231010158e-050.0001873218462020320.999906339076899
216.8632824701065e-050.000137265649402130.9999313671753
224.05731542604472e-058.11463085208944e-050.99995942684574
232.26132406784822e-054.52264813569645e-050.999977386759322
241.28592512865821e-052.57185025731641e-050.999987140748713
255.41325695651078e-050.0001082651391302160.999945867430435
260.0001438368013870970.0002876736027741940.999856163198613
275.50283007853729e-050.0001100566015707460.999944971699215
280.0001279483488029810.0002558966976059620.999872051651197
290.0001503642130645340.0003007284261290680.999849635786936
300.0002024629962245160.0004049259924490330.999797537003775
318.36988531055383e-050.0001673977062110770.999916301146894
320.0001483114668812790.0002966229337625570.999851688533119
335.72101955597952e-050.0001144203911195900.99994278980444
342.52450014706135e-055.04900029412271e-050.99997475499853
351.21530895831621e-052.43061791663242e-050.999987846910417
364.12944674743667e-058.25889349487334e-050.999958705532526
371.72170431611879e-053.44340863223757e-050.999982782956839
381.42908300143164e-052.85816600286328e-050.999985709169986
392.47357962928637e-054.94715925857275e-050.999975264203707
401.31996869004974e-052.63993738009949e-050.9999868003131
410.4958227579899600.9916455159799210.504177242010040


Meta Analysis of Goldfeld-Quandt test for Heteroskedasticity
Description# significant tests% significant testsOK/NOK
1% type I error level290.878787878787879NOK
5% type I error level320.96969696969697NOK
10% type I error level320.96969696969697NOK

\begin{tabular}{lllllllll}
\hline
Meta Analysis of Goldfeld-Quandt test for Heteroskedasticity \tabularnewline
Description & # significant tests & % significant tests & OK/NOK \tabularnewline
1% type I error level & 29 & 0.878787878787879 & NOK \tabularnewline
5% type I error level & 32 & 0.96969696969697 & NOK \tabularnewline
10% type I error level & 32 & 0.96969696969697 & NOK \tabularnewline
\hline
\end{tabular}
%Source: https://freestatistics.org/blog/index.php?pk=98948&T=6

[TABLE]
[ROW][C]Meta Analysis of Goldfeld-Quandt test for Heteroskedasticity[/C][/ROW]
[ROW][C]Description[/C][C]# significant tests[/C][C]% significant tests[/C][C]OK/NOK[/C][/ROW]
[ROW][C]1% type I error level[/C][C]29[/C][C]0.878787878787879[/C][C]NOK[/C][/ROW]
[ROW][C]5% type I error level[/C][C]32[/C][C]0.96969696969697[/C][C]NOK[/C][/ROW]
[ROW][C]10% type I error level[/C][C]32[/C][C]0.96969696969697[/C][C]NOK[/C][/ROW]
[/TABLE]
Source: https://freestatistics.org/blog/index.php?pk=98948&T=6

Globally Unique Identifier (entire table): ba.freestatistics.org/blog/index.php?pk=98948&T=6

As an alternative you can also use a QR Code:  

The GUIDs for individual cells are displayed in the table below:

Meta Analysis of Goldfeld-Quandt test for Heteroskedasticity
Description# significant tests% significant testsOK/NOK
1% type I error level290.878787878787879NOK
5% type I error level320.96969696969697NOK
10% type I error level320.96969696969697NOK


Parameters (Session):
par1 = 1 ; par2 = Do not include Seasonal Dummies ; par3 = No Linear Trend ;
Parameters (R input):
par1 = 1 ; par2 = Do not include Seasonal Dummies ; par3 = No Linear Trend ;
R code (references can be found in the software module):
library(lattice)
library(lmtest)
n25 <- 25 #minimum number of obs. for Goldfeld-Quandt test
par1 <- as.numeric(par1)
x <- t(y)
k <- length(x[1,])
n <- length(x[,1])
x1 <- cbind(x[,par1], x[,1:k!=par1])
mycolnames <- c(colnames(x)[par1], colnames(x)[1:k!=par1])
colnames(x1) <- mycolnames #colnames(x)[par1]
x <- x1
if (par3 == 'First Differences'){
x2 <- array(0, dim=c(n-1,k), dimnames=list(1:(n-1), paste('(1-B)',colnames(x),sep='')))
for (i in 1:n-1) {
for (j in 1:k) {
x2[i,j] <- x[i+1,j] - x[i,j]
}
}
x <- x2
}
if (par2 == 'Include Monthly Dummies'){
x2 <- array(0, dim=c(n,11), dimnames=list(1:n, paste('M', seq(1:11), sep ='')))
for (i in 1:11){
x2[seq(i,n,12),i] <- 1
}
x <- cbind(x, x2)
}
if (par2 == 'Include Quarterly Dummies'){
x2 <- array(0, dim=c(n,3), dimnames=list(1:n, paste('Q', seq(1:3), sep ='')))
for (i in 1:3){
x2[seq(i,n,4),i] <- 1
}
x <- cbind(x, x2)
}
k <- length(x[1,])
if (par3 == 'Linear Trend'){
x <- cbind(x, c(1:n))
colnames(x)[k+1] <- 't'
}
x
k <- length(x[1,])
df <- as.data.frame(x)
(mylm <- lm(df))
(mysum <- summary(mylm))
if (n > n25) {
kp3 <- k + 3
nmkm3 <- n - k - 3
gqarr <- array(NA, dim=c(nmkm3-kp3+1,3))
numgqtests <- 0
numsignificant1 <- 0
numsignificant5 <- 0
numsignificant10 <- 0
for (mypoint in kp3:nmkm3) {
j <- 0
numgqtests <- numgqtests + 1
for (myalt in c('greater', 'two.sided', 'less')) {
j <- j + 1
gqarr[mypoint-kp3+1,j] <- gqtest(mylm, point=mypoint, alternative=myalt)$p.value
}
if (gqarr[mypoint-kp3+1,2] < 0.01) numsignificant1 <- numsignificant1 + 1
if (gqarr[mypoint-kp3+1,2] < 0.05) numsignificant5 <- numsignificant5 + 1
if (gqarr[mypoint-kp3+1,2] < 0.10) numsignificant10 <- numsignificant10 + 1
}
gqarr
}
bitmap(file='test0.png')
plot(x[,1], type='l', main='Actuals and Interpolation', ylab='value of Actuals and Interpolation (dots)', xlab='time or index')
points(x[,1]-mysum$resid)
grid()
dev.off()
bitmap(file='test1.png')
plot(mysum$resid, type='b', pch=19, main='Residuals', ylab='value of Residuals', xlab='time or index')
grid()
dev.off()
bitmap(file='test2.png')
hist(mysum$resid, main='Residual Histogram', xlab='values of Residuals')
grid()
dev.off()
bitmap(file='test3.png')
densityplot(~mysum$resid,col='black',main='Residual Density Plot', xlab='values of Residuals')
dev.off()
bitmap(file='test4.png')
qqnorm(mysum$resid, main='Residual Normal Q-Q Plot')
qqline(mysum$resid)
grid()
dev.off()
(myerror <- as.ts(mysum$resid))
bitmap(file='test5.png')
dum <- cbind(lag(myerror,k=1),myerror)
dum
dum1 <- dum[2:length(myerror),]
dum1
z <- as.data.frame(dum1)
z
plot(z,main=paste('Residual Lag plot, lowess, and regression line'), ylab='values of Residuals', xlab='lagged values of Residuals')
lines(lowess(z))
abline(lm(z))
grid()
dev.off()
bitmap(file='test6.png')
acf(mysum$resid, lag.max=length(mysum$resid)/2, main='Residual Autocorrelation Function')
grid()
dev.off()
bitmap(file='test7.png')
pacf(mysum$resid, lag.max=length(mysum$resid)/2, main='Residual Partial Autocorrelation Function')
grid()
dev.off()
bitmap(file='test8.png')
opar <- par(mfrow = c(2,2), oma = c(0, 0, 1.1, 0))
plot(mylm, las = 1, sub='Residual Diagnostics')
par(opar)
dev.off()
if (n > n25) {
bitmap(file='test9.png')
plot(kp3:nmkm3,gqarr[,2], main='Goldfeld-Quandt test',ylab='2-sided p-value',xlab='breakpoint')
grid()
dev.off()
}
load(file='createtable')
a<-table.start()
a<-table.row.start(a)
a<-table.element(a, 'Multiple Linear Regression - Estimated Regression Equation', 1, TRUE)
a<-table.row.end(a)
myeq <- colnames(x)[1]
myeq <- paste(myeq, '[t] = ', sep='')
for (i in 1:k){
if (mysum$coefficients[i,1] > 0) myeq <- paste(myeq, '+', '')
myeq <- paste(myeq, mysum$coefficients[i,1], sep=' ')
if (rownames(mysum$coefficients)[i] != '(Intercept)') {
myeq <- paste(myeq, rownames(mysum$coefficients)[i], sep='')
if (rownames(mysum$coefficients)[i] != 't') myeq <- paste(myeq, '[t]', sep='')
}
}
myeq <- paste(myeq, ' + e[t]')
a<-table.row.start(a)
a<-table.element(a, myeq)
a<-table.row.end(a)
a<-table.end(a)
table.save(a,file='mytable1.tab')
a<-table.start()
a<-table.row.start(a)
a<-table.element(a,hyperlink('ols1.htm','Multiple Linear Regression - Ordinary Least Squares',''), 6, TRUE)
a<-table.row.end(a)
a<-table.row.start(a)
a<-table.element(a,'Variable',header=TRUE)
a<-table.element(a,'Parameter',header=TRUE)
a<-table.element(a,'S.D.',header=TRUE)
a<-table.element(a,'T-STAT
H0: parameter = 0',header=TRUE)
a<-table.element(a,'2-tail p-value',header=TRUE)
a<-table.element(a,'1-tail p-value',header=TRUE)
a<-table.row.end(a)
for (i in 1:k){
a<-table.row.start(a)
a<-table.element(a,rownames(mysum$coefficients)[i],header=TRUE)
a<-table.element(a,mysum$coefficients[i,1])
a<-table.element(a, round(mysum$coefficients[i,2],6))
a<-table.element(a, round(mysum$coefficients[i,3],4))
a<-table.element(a, round(mysum$coefficients[i,4],6))
a<-table.element(a, round(mysum$coefficients[i,4]/2,6))
a<-table.row.end(a)
}
a<-table.end(a)
table.save(a,file='mytable2.tab')
a<-table.start()
a<-table.row.start(a)
a<-table.element(a, 'Multiple Linear Regression - Regression Statistics', 2, TRUE)
a<-table.row.end(a)
a<-table.row.start(a)
a<-table.element(a, 'Multiple R',1,TRUE)
a<-table.element(a, sqrt(mysum$r.squared))
a<-table.row.end(a)
a<-table.row.start(a)
a<-table.element(a, 'R-squared',1,TRUE)
a<-table.element(a, mysum$r.squared)
a<-table.row.end(a)
a<-table.row.start(a)
a<-table.element(a, 'Adjusted R-squared',1,TRUE)
a<-table.element(a, mysum$adj.r.squared)
a<-table.row.end(a)
a<-table.row.start(a)
a<-table.element(a, 'F-TEST (value)',1,TRUE)
a<-table.element(a, mysum$fstatistic[1])
a<-table.row.end(a)
a<-table.row.start(a)
a<-table.element(a, 'F-TEST (DF numerator)',1,TRUE)
a<-table.element(a, mysum$fstatistic[2])
a<-table.row.end(a)
a<-table.row.start(a)
a<-table.element(a, 'F-TEST (DF denominator)',1,TRUE)
a<-table.element(a, mysum$fstatistic[3])
a<-table.row.end(a)
a<-table.row.start(a)
a<-table.element(a, 'p-value',1,TRUE)
a<-table.element(a, 1-pf(mysum$fstatistic[1],mysum$fstatistic[2],mysum$fstatistic[3]))
a<-table.row.end(a)
a<-table.row.start(a)
a<-table.element(a, 'Multiple Linear Regression - Residual Statistics', 2, TRUE)
a<-table.row.end(a)
a<-table.row.start(a)
a<-table.element(a, 'Residual Standard Deviation',1,TRUE)
a<-table.element(a, mysum$sigma)
a<-table.row.end(a)
a<-table.row.start(a)
a<-table.element(a, 'Sum Squared Residuals',1,TRUE)
a<-table.element(a, sum(myerror*myerror))
a<-table.row.end(a)
a<-table.end(a)
table.save(a,file='mytable3.tab')
a<-table.start()
a<-table.row.start(a)
a<-table.element(a, 'Multiple Linear Regression - Actuals, Interpolation, and Residuals', 4, TRUE)
a<-table.row.end(a)
a<-table.row.start(a)
a<-table.element(a, 'Time or Index', 1, TRUE)
a<-table.element(a, 'Actuals', 1, TRUE)
a<-table.element(a, 'Interpolation
Forecast', 1, TRUE)
a<-table.element(a, 'Residuals
Prediction Error', 1, TRUE)
a<-table.row.end(a)
for (i in 1:n) {
a<-table.row.start(a)
a<-table.element(a,i, 1, TRUE)
a<-table.element(a,x[i])
a<-table.element(a,x[i]-mysum$resid[i])
a<-table.element(a,mysum$resid[i])
a<-table.row.end(a)
}
a<-table.end(a)
table.save(a,file='mytable4.tab')
if (n > n25) {
a<-table.start()
a<-table.row.start(a)
a<-table.element(a,'Goldfeld-Quandt test for Heteroskedasticity',4,TRUE)
a<-table.row.end(a)
a<-table.row.start(a)
a<-table.element(a,'p-values',header=TRUE)
a<-table.element(a,'Alternative Hypothesis',3,header=TRUE)
a<-table.row.end(a)
a<-table.row.start(a)
a<-table.element(a,'breakpoint index',header=TRUE)
a<-table.element(a,'greater',header=TRUE)
a<-table.element(a,'2-sided',header=TRUE)
a<-table.element(a,'less',header=TRUE)
a<-table.row.end(a)
for (mypoint in kp3:nmkm3) {
a<-table.row.start(a)
a<-table.element(a,mypoint,header=TRUE)
a<-table.element(a,gqarr[mypoint-kp3+1,1])
a<-table.element(a,gqarr[mypoint-kp3+1,2])
a<-table.element(a,gqarr[mypoint-kp3+1,3])
a<-table.row.end(a)
}
a<-table.end(a)
table.save(a,file='mytable5.tab')
a<-table.start()
a<-table.row.start(a)
a<-table.element(a,'Meta Analysis of Goldfeld-Quandt test for Heteroskedasticity',4,TRUE)
a<-table.row.end(a)
a<-table.row.start(a)
a<-table.element(a,'Description',header=TRUE)
a<-table.element(a,'# significant tests',header=TRUE)
a<-table.element(a,'% significant tests',header=TRUE)
a<-table.element(a,'OK/NOK',header=TRUE)
a<-table.row.end(a)
a<-table.row.start(a)
a<-table.element(a,'1% type I error level',header=TRUE)
a<-table.element(a,numsignificant1)
a<-table.element(a,numsignificant1/numgqtests)
if (numsignificant1/numgqtests < 0.01) dum <- 'OK' else dum <- 'NOK'
a<-table.element(a,dum)
a<-table.row.end(a)
a<-table.row.start(a)
a<-table.element(a,'5% type I error level',header=TRUE)
a<-table.element(a,numsignificant5)
a<-table.element(a,numsignificant5/numgqtests)
if (numsignificant5/numgqtests < 0.05) dum <- 'OK' else dum <- 'NOK'
a<-table.element(a,dum)
a<-table.row.end(a)
a<-table.row.start(a)
a<-table.element(a,'10% type I error level',header=TRUE)
a<-table.element(a,numsignificant10)
a<-table.element(a,numsignificant10/numgqtests)
if (numsignificant10/numgqtests < 0.1) dum <- 'OK' else dum <- 'NOK'
a<-table.element(a,dum)
a<-table.row.end(a)
a<-table.end(a)
table.save(a,file='mytable6.tab')
}