| Multiple Linear Regression - Estimated Regression Equation |
| Y[t] = + 70.5119635193035 -0.0195089043548871X1[t] -0.000499639964036723X2[t] + e[t] |
| Multiple Linear Regression - Ordinary Least Squares | |||||
| Variable | Parameter | S.D. | T-STAT H0: parameter = 0 | 2-tail p-value | 1-tail p-value |
| (Intercept) | 70.5119635193035 | 1.147772 | 61.4338 | 0 | 0 |
| X1 | -0.0195089043548871 | 0.009958 | -1.9591 | 0.058102 | 0.029051 |
| X2 | -0.000499639964036723 | 0.000203 | -2.459 | 0.019021 | 0.00951 |
| Multiple Linear Regression - Regression Statistics | |
| Multiple R | 0.640195253380996 |
| R-squared | 0.409849962451558 |
| Adjusted R-squared | 0.376127103163076 |
| F-TEST (value) | 12.1534760426301 |
| F-TEST (DF numerator) | 2 |
| F-TEST (DF denominator) | 35 |
| p-value | 9.8139238571049e-05 |
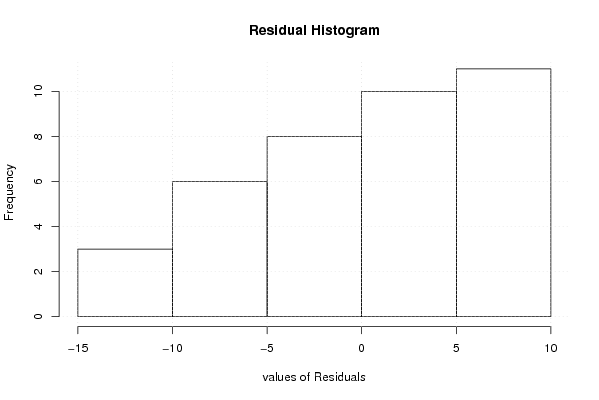
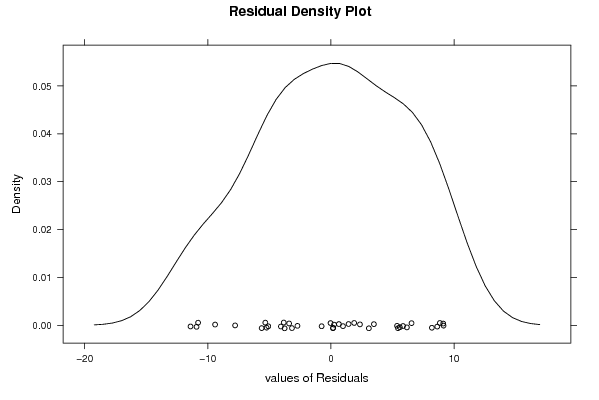
| Multiple Linear Regression - Residual Statistics | |
| Residual Standard Deviation | 6.16264161415294 |
| Sum Squared Residuals | 1329.23530825713 |
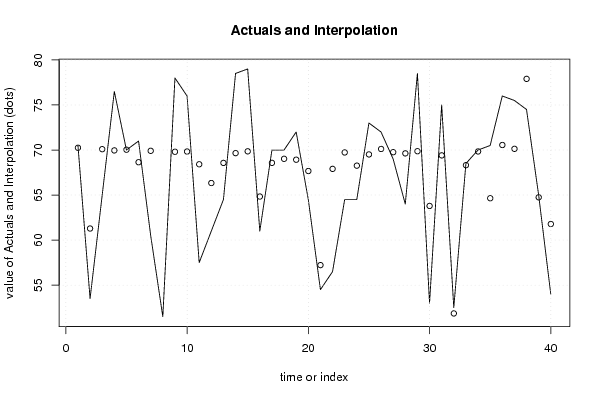
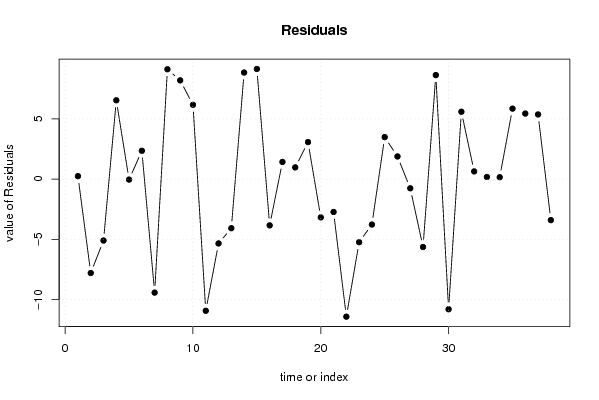
| Multiple Linear Regression - Actuals, Interpolation, and Residuals | |||
| Time or Index | Actuals | Interpolation Forecast | Residuals Prediction Error |
| 1 | 70.5 | 70.2490611151902 | 0.250938884809809 |
| 2 | 53.5 | 61.2858786292636 | -7.78587862926362 |
| 3 | 65 | 70.0921741664828 | -5.09217416648283 |
| 4 | 76.5 | 69.955973801418 | 6.54402619858207 |
| 5 | 70 | 70.0346237875888 | -0.0346237875887938 |
| 6 | 71 | 68.6445232912089 | 2.35547670879113 |
| 7 | 60.5 | 69.9115517361336 | -9.41155173613358 |
| 8 | 51.5 | 42.382183547209 | 9.117816452791 |
| 9 | 78 | 69.8033771005696 | 8.19662289943036 |
| 10 | 76 | 69.8318565785197 | 6.16814342148027 |
| 11 | 57.5 | 68.4189613765537 | -10.9189613765537 |
| 12 | 61 | 66.3329238018855 | -5.33292380188547 |
| 13 | 64.5 | 68.5683359467432 | -4.06833594674322 |
| 14 | 78.5 | 69.6542090421972 | 8.84579095780276 |
| 15 | 79 | 69.8565225028172 | 9.14347749718283 |
| 16 | 61 | 64.8343503750947 | -3.83435037509469 |
| 17 | 70 | 68.57129534067 | 1.42870465932992 |
| 18 | 70 | 69.0234110042509 | 0.976588995749112 |
| 19 | 72 | 68.9245918534589 | 3.07540814654108 |
| 20 | 64.5 | 67.6675309830999 | -3.16753098309992 |
| 21 | 54.5 | 57.2214468665424 | -2.72144686654235 |
| 22 | 56.5 | 67.906664626414 | -11.4066646264139 |
| 23 | 64.5 | 69.7312046548738 | -5.23120465487377 |
| 24 | 64.5 | 68.2645622942664 | -3.76456229426644 |
| 25 | 73 | 69.5112890667253 | 3.48871093327472 |
| 26 | 72 | 70.1156113532777 | 1.88438864672235 |
| 27 | 69 | 69.7582718292616 | -0.758271829261605 |
| 28 | 64 | 69.6278480195905 | -5.62784801959054 |
| 29 | 78.5 | 69.8673310159663 | 8.63266898403366 |
| 30 | 53 | 63.7927771704802 | -10.7927771704802 |
| 31 | 75 | 69.4055260146517 | 5.59447398534832 |
| 32 | 52.5 | 51.8576236270084 | 0.642376372991575 |
| 33 | 68.5 | 68.3203470802894 | 0.179652919710596 |
| 34 | 70 | 69.8405181743665 | 0.159481825633457 |
| 35 | 70.5 | 64.6481567882124 | 5.8518432117876 |
| 36 | 76 | 70.5564932172191 | 5.44350678278086 |
| 37 | 75.5 | 70.1316722561447 | 5.36832774385533 |
| 38 | 74.5 | 77.899319964354 | -3.39931996435408 |
| 39 | 65 | NA | NA |
| 40 | 54 | NA | NA |
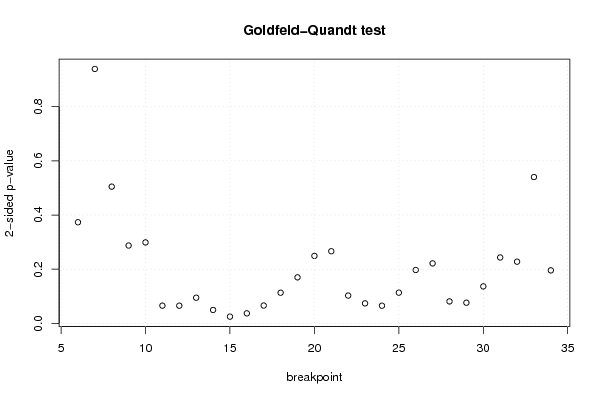
| Goldfeld-Quandt test for Heteroskedasticity | |||
| p-values | Alternative Hypothesis | ||
| breakpoint index | greater | 2-sided | less |
| 6 | 0.186713662564622 | 0.373427325129245 | 0.813286337435378 |
| 7 | 0.530407386301632 | 0.939185227396736 | 0.469592613698368 |
| 8 | 0.747601395643173 | 0.504797208713654 | 0.252398604356827 |
| 9 | 0.856277771831968 | 0.287444456336063 | 0.143722228168032 |
| 10 | 0.850481892222394 | 0.299036215555212 | 0.149518107777606 |
| 11 | 0.96719458786546 | 0.0656108242690793 | 0.0328054121345396 |
| 12 | 0.967240815798944 | 0.0655183684021113 | 0.0327591842010557 |
| 13 | 0.95256837322313 | 0.0948632535537414 | 0.0474316267768707 |
| 14 | 0.975183827105978 | 0.0496323457880445 | 0.0248161728940223 |
| 15 | 0.987491880533197 | 0.0250162389336068 | 0.0125081194668034 |
| 16 | 0.98138241446503 | 0.0372351710699400 | 0.0186175855349700 |
| 17 | 0.966978207440748 | 0.0660435851185044 | 0.0330217925592522 |
| 18 | 0.943330716661585 | 0.113338566676831 | 0.0566692833384155 |
| 19 | 0.91489496257388 | 0.170210074852240 | 0.0851050374261202 |
| 20 | 0.875371625530482 | 0.249256748939036 | 0.124628374469518 |
| 21 | 0.866765538653363 | 0.266468922693274 | 0.133234461346637 |
| 22 | 0.948580930025011 | 0.102838139949978 | 0.051419069974989 |
| 23 | 0.962959811132573 | 0.0740803777348536 | 0.0370401888674268 |
| 24 | 0.967285317600117 | 0.0654293647997664 | 0.0327146823998832 |
| 25 | 0.943198845938027 | 0.113602308123946 | 0.0568011540619729 |
| 26 | 0.901372702217384 | 0.197254595565232 | 0.0986272977826162 |
| 27 | 0.889241072986971 | 0.221517854026058 | 0.110758927013029 |
| 28 | 0.959354908872314 | 0.0812901822553714 | 0.0406450911276857 |
| 29 | 0.961783587844694 | 0.0764328243106127 | 0.0382164121553063 |
| 30 | 0.93161392890797 | 0.136772142184060 | 0.0683860710920299 |
| 31 | 0.878296719367549 | 0.243406561264903 | 0.121703280632451 |
| 32 | 0.886042570150008 | 0.227914859699984 | 0.113957429849992 |
| 33 | 0.72985853036708 | 0.540282939265839 | 0.270141469632920 |
| 34 | 0.902065168180857 | 0.195869663638285 | 0.0979348318191427 |
| Meta Analysis of Goldfeld-Quandt test for Heteroskedasticity | |||
| Description | # significant tests | % significant tests | OK/NOK |
| 1% type I error level | 0 | 0 | OK |
| 5% type I error level | 3 | 0.103448275862069 | NOK |
| 10% type I error level | 11 | 0.379310344827586 | NOK |