Free Statistics

of Irreproducible Research!

Author's title

Author*The author of this computation has been verified*
R Software Modulerwasp_multipleregression.wasp
Title produced by softwareMultiple Regression
Date of computationTue, 23 Nov 2010 11:20:27 +0000
Cite this page as followsStatistical Computations at FreeStatistics.org, Office for Research Development and Education, URL https://freestatistics.org/blog/index.php?v=date/2010/Nov/23/t1290511159kc46afgilygo7oi.htm/, Retrieved Fri, 26 Apr 2024 11:52:42 +0000
Statistical Computations at FreeStatistics.org, Office for Research Development and Education, URL https://freestatistics.org/blog/index.php?pk=98932, Retrieved Fri, 26 Apr 2024 11:52:42 +0000
QR Codes:

Original text written by user:
IsPrivate?No (this computation is public)
User-defined keywords
Estimated Impact139
Family? (F = Feedback message, R = changed R code, M = changed R Module, P = changed Parameters, D = changed Data)
-     [Multiple Regression] [Competence to learn] [2010-11-17 07:43:53] [b98453cac15ba1066b407e146608df68]
-   PD    [Multiple Regression] [Workshop 7 - regr...] [2010-11-23 11:20:27] [0605ea080d54454c99180f574351b8e4] [Current]
Feedback Forum

Post a new message
Dataseries X:
70.5	4	370
53.5	315	6166
65	4	684
76.5	17	449
70	8	643
71	56	1551
60.5	15	616
51.5	503	36660
78	26	403
76	26	346
57.5	44	2471
61	24	7427
64.5	23	2992
78.5	38	233
79	18	609
61	96	7615
70	90	370
70	49	1066
72	66	600
64.5	21	4873
54.5	592	3485
56.5	73	2364
64.5	14	1016
64.5	88	1062
73	39	480
72	6	559
69	32	259
64	11	1340
78.5	26	275
53	23	12550
75	32	965
52.5	NA	25229
68.5	11	4883
70	5	1189
70.5	3	226
76	3	611
75.5	13	404
74.5	56	576
65	29	3096
54	NA	23193


Summary of computational transaction
Raw Inputview raw input (R code)
Raw Outputview raw output of R engine
Computing time7 seconds
R Server'Gwilym Jenkins' @ 72.249.127.135

\begin{tabular}{lllllllll}
\hline
Summary of computational transaction \tabularnewline
Raw Input & view raw input (R code)  \tabularnewline
Raw Output & view raw output of R engine  \tabularnewline
Computing time & 7 seconds \tabularnewline
R Server & 'Gwilym Jenkins' @ 72.249.127.135 \tabularnewline
\hline
\end{tabular}
%Source: https://freestatistics.org/blog/index.php?pk=98932&T=0

[TABLE]
[ROW][C]Summary of computational transaction[/C][/ROW]
[ROW][C]Raw Input[/C][C]view raw input (R code) [/C][/ROW]
[ROW][C]Raw Output[/C][C]view raw output of R engine [/C][/ROW]
[ROW][C]Computing time[/C][C]7 seconds[/C][/ROW]
[ROW][C]R Server[/C][C]'Gwilym Jenkins' @ 72.249.127.135[/C][/ROW]
[/TABLE]
Source: https://freestatistics.org/blog/index.php?pk=98932&T=0

Globally Unique Identifier (entire table): ba.freestatistics.org/blog/index.php?pk=98932&T=0

As an alternative you can also use a QR Code:  

The GUIDs for individual cells are displayed in the table below:

Summary of computational transaction
Raw Inputview raw input (R code)
Raw Outputview raw output of R engine
Computing time7 seconds
R Server'Gwilym Jenkins' @ 72.249.127.135


Multiple Linear Regression - Estimated Regression Equation
Y[t] = + 70.5119635193035 -0.0195089043548871X1[t] -0.000499639964036723X2[t] + e[t]

\begin{tabular}{lllllllll}
\hline
Multiple Linear Regression - Estimated Regression Equation \tabularnewline
Y[t] =  +  70.5119635193035 -0.0195089043548871X1[t] -0.000499639964036723X2[t]  + e[t] \tabularnewline
\hline
\end{tabular}
%Source: https://freestatistics.org/blog/index.php?pk=98932&T=1

[TABLE]
[ROW][C]Multiple Linear Regression - Estimated Regression Equation[/C][/ROW]
[ROW][C]Y[t] =  +  70.5119635193035 -0.0195089043548871X1[t] -0.000499639964036723X2[t]  + e[t][/C][/ROW]
[/TABLE]
Source: https://freestatistics.org/blog/index.php?pk=98932&T=1

Globally Unique Identifier (entire table): ba.freestatistics.org/blog/index.php?pk=98932&T=1

As an alternative you can also use a QR Code:  

The GUIDs for individual cells are displayed in the table below:

Multiple Linear Regression - Estimated Regression Equation
Y[t] = + 70.5119635193035 -0.0195089043548871X1[t] -0.000499639964036723X2[t] + e[t]


Multiple Linear Regression - Ordinary Least Squares
VariableParameterS.D.T-STATH0: parameter = 02-tail p-value1-tail p-value
(Intercept)70.51196351930351.14777261.433800
X1-0.01950890435488710.009958-1.95910.0581020.029051
X2-0.0004996399640367230.000203-2.4590.0190210.00951

\begin{tabular}{lllllllll}
\hline
Multiple Linear Regression - Ordinary Least Squares \tabularnewline
Variable & Parameter & S.D. & T-STATH0: parameter = 0 & 2-tail p-value & 1-tail p-value \tabularnewline
(Intercept) & 70.5119635193035 & 1.147772 & 61.4338 & 0 & 0 \tabularnewline
X1 & -0.0195089043548871 & 0.009958 & -1.9591 & 0.058102 & 0.029051 \tabularnewline
X2 & -0.000499639964036723 & 0.000203 & -2.459 & 0.019021 & 0.00951 \tabularnewline
\hline
\end{tabular}
%Source: https://freestatistics.org/blog/index.php?pk=98932&T=2

[TABLE]
[ROW][C]Multiple Linear Regression - Ordinary Least Squares[/C][/ROW]
[ROW][C]Variable[/C][C]Parameter[/C][C]S.D.[/C][C]T-STATH0: parameter = 0[/C][C]2-tail p-value[/C][C]1-tail p-value[/C][/ROW]
[ROW][C](Intercept)[/C][C]70.5119635193035[/C][C]1.147772[/C][C]61.4338[/C][C]0[/C][C]0[/C][/ROW]
[ROW][C]X1[/C][C]-0.0195089043548871[/C][C]0.009958[/C][C]-1.9591[/C][C]0.058102[/C][C]0.029051[/C][/ROW]
[ROW][C]X2[/C][C]-0.000499639964036723[/C][C]0.000203[/C][C]-2.459[/C][C]0.019021[/C][C]0.00951[/C][/ROW]
[/TABLE]
Source: https://freestatistics.org/blog/index.php?pk=98932&T=2

Globally Unique Identifier (entire table): ba.freestatistics.org/blog/index.php?pk=98932&T=2

As an alternative you can also use a QR Code:  

The GUIDs for individual cells are displayed in the table below:

Multiple Linear Regression - Ordinary Least Squares
VariableParameterS.D.T-STATH0: parameter = 02-tail p-value1-tail p-value
(Intercept)70.51196351930351.14777261.433800
X1-0.01950890435488710.009958-1.95910.0581020.029051
X2-0.0004996399640367230.000203-2.4590.0190210.00951


Multiple Linear Regression - Regression Statistics
Multiple R0.640195253380996
R-squared0.409849962451558
Adjusted R-squared0.376127103163076
F-TEST (value)12.1534760426301
F-TEST (DF numerator)2
F-TEST (DF denominator)35
p-value9.8139238571049e-05
Multiple Linear Regression - Residual Statistics
Residual Standard Deviation6.16264161415294
Sum Squared Residuals1329.23530825713

\begin{tabular}{lllllllll}
\hline
Multiple Linear Regression - Regression Statistics \tabularnewline
Multiple R & 0.640195253380996 \tabularnewline
R-squared & 0.409849962451558 \tabularnewline
Adjusted R-squared & 0.376127103163076 \tabularnewline
F-TEST (value) & 12.1534760426301 \tabularnewline
F-TEST (DF numerator) & 2 \tabularnewline
F-TEST (DF denominator) & 35 \tabularnewline
p-value & 9.8139238571049e-05 \tabularnewline
Multiple Linear Regression - Residual Statistics \tabularnewline
Residual Standard Deviation & 6.16264161415294 \tabularnewline
Sum Squared Residuals & 1329.23530825713 \tabularnewline
\hline
\end{tabular}
%Source: https://freestatistics.org/blog/index.php?pk=98932&T=3

[TABLE]
[ROW][C]Multiple Linear Regression - Regression Statistics[/C][/ROW]
[ROW][C]Multiple R[/C][C]0.640195253380996[/C][/ROW]
[ROW][C]R-squared[/C][C]0.409849962451558[/C][/ROW]
[ROW][C]Adjusted R-squared[/C][C]0.376127103163076[/C][/ROW]
[ROW][C]F-TEST (value)[/C][C]12.1534760426301[/C][/ROW]
[ROW][C]F-TEST (DF numerator)[/C][C]2[/C][/ROW]
[ROW][C]F-TEST (DF denominator)[/C][C]35[/C][/ROW]
[ROW][C]p-value[/C][C]9.8139238571049e-05[/C][/ROW]
[ROW][C]Multiple Linear Regression - Residual Statistics[/C][/ROW]
[ROW][C]Residual Standard Deviation[/C][C]6.16264161415294[/C][/ROW]
[ROW][C]Sum Squared Residuals[/C][C]1329.23530825713[/C][/ROW]
[/TABLE]
Source: https://freestatistics.org/blog/index.php?pk=98932&T=3

Globally Unique Identifier (entire table): ba.freestatistics.org/blog/index.php?pk=98932&T=3

As an alternative you can also use a QR Code:  

The GUIDs for individual cells are displayed in the table below:

Multiple Linear Regression - Regression Statistics
Multiple R0.640195253380996
R-squared0.409849962451558
Adjusted R-squared0.376127103163076
F-TEST (value)12.1534760426301
F-TEST (DF numerator)2
F-TEST (DF denominator)35
p-value9.8139238571049e-05
Multiple Linear Regression - Residual Statistics
Residual Standard Deviation6.16264161415294
Sum Squared Residuals1329.23530825713


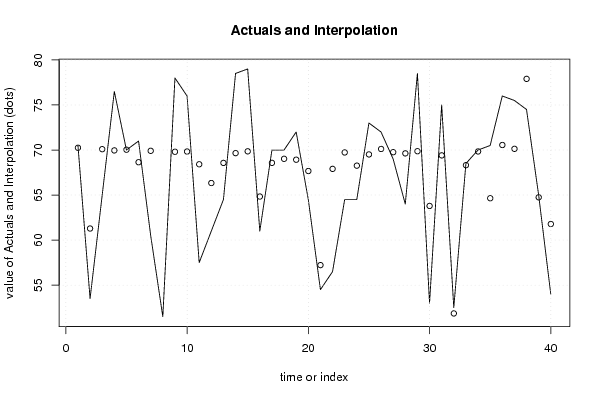
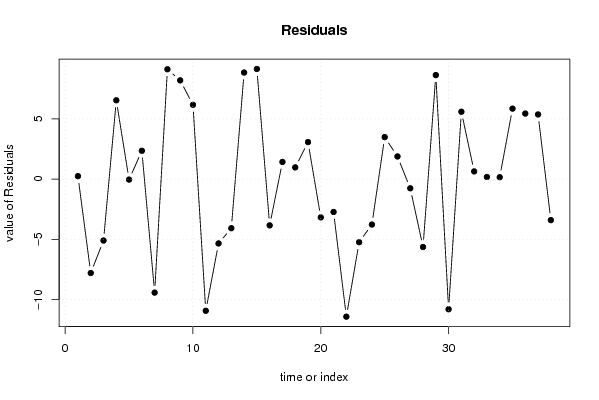
Multiple Linear Regression - Actuals, Interpolation, and Residuals
Time or IndexActualsInterpolationForecastResidualsPrediction Error
170.570.24906111519020.250938884809809
253.561.2858786292636-7.78587862926362
36570.0921741664828-5.09217416648283
476.569.9559738014186.54402619858207
57070.0346237875888-0.0346237875887938
67168.64452329120892.35547670879113
760.569.9115517361336-9.41155173613358
851.542.3821835472099.117816452791
97869.80337710056968.19662289943036
107669.83185657851976.16814342148027
1157.568.4189613765537-10.9189613765537
126166.3329238018855-5.33292380188547
1364.568.5683359467432-4.06833594674322
1478.569.65420904219728.84579095780276
157969.85652250281729.14347749718283
166164.8343503750947-3.83435037509469
177068.571295340671.42870465932992
187069.02341100425090.976588995749112
197268.92459185345893.07540814654108
2064.567.6675309830999-3.16753098309992
2154.557.2214468665424-2.72144686654235
2256.567.906664626414-11.4066646264139
2364.569.7312046548738-5.23120465487377
2464.568.2645622942664-3.76456229426644
257369.51128906672533.48871093327472
267270.11561135327771.88438864672235
276969.7582718292616-0.758271829261605
286469.6278480195905-5.62784801959054
2978.569.86733101596638.63266898403366
305363.7927771704802-10.7927771704802
317569.40552601465175.59447398534832
3252.551.85762362700840.642376372991575
3368.568.32034708028940.179652919710596
347069.84051817436650.159481825633457
3570.564.64815678821245.8518432117876
367670.55649321721915.44350678278086
3775.570.13167225614475.36832774385533
3874.577.899319964354-3.39931996435408
3965NANA
4054NANA

\begin{tabular}{lllllllll}
\hline
Multiple Linear Regression - Actuals, Interpolation, and Residuals \tabularnewline
Time or Index & Actuals & InterpolationForecast & ResidualsPrediction Error \tabularnewline
1 & 70.5 & 70.2490611151902 & 0.250938884809809 \tabularnewline
2 & 53.5 & 61.2858786292636 & -7.78587862926362 \tabularnewline
3 & 65 & 70.0921741664828 & -5.09217416648283 \tabularnewline
4 & 76.5 & 69.955973801418 & 6.54402619858207 \tabularnewline
5 & 70 & 70.0346237875888 & -0.0346237875887938 \tabularnewline
6 & 71 & 68.6445232912089 & 2.35547670879113 \tabularnewline
7 & 60.5 & 69.9115517361336 & -9.41155173613358 \tabularnewline
8 & 51.5 & 42.382183547209 & 9.117816452791 \tabularnewline
9 & 78 & 69.8033771005696 & 8.19662289943036 \tabularnewline
10 & 76 & 69.8318565785197 & 6.16814342148027 \tabularnewline
11 & 57.5 & 68.4189613765537 & -10.9189613765537 \tabularnewline
12 & 61 & 66.3329238018855 & -5.33292380188547 \tabularnewline
13 & 64.5 & 68.5683359467432 & -4.06833594674322 \tabularnewline
14 & 78.5 & 69.6542090421972 & 8.84579095780276 \tabularnewline
15 & 79 & 69.8565225028172 & 9.14347749718283 \tabularnewline
16 & 61 & 64.8343503750947 & -3.83435037509469 \tabularnewline
17 & 70 & 68.57129534067 & 1.42870465932992 \tabularnewline
18 & 70 & 69.0234110042509 & 0.976588995749112 \tabularnewline
19 & 72 & 68.9245918534589 & 3.07540814654108 \tabularnewline
20 & 64.5 & 67.6675309830999 & -3.16753098309992 \tabularnewline
21 & 54.5 & 57.2214468665424 & -2.72144686654235 \tabularnewline
22 & 56.5 & 67.906664626414 & -11.4066646264139 \tabularnewline
23 & 64.5 & 69.7312046548738 & -5.23120465487377 \tabularnewline
24 & 64.5 & 68.2645622942664 & -3.76456229426644 \tabularnewline
25 & 73 & 69.5112890667253 & 3.48871093327472 \tabularnewline
26 & 72 & 70.1156113532777 & 1.88438864672235 \tabularnewline
27 & 69 & 69.7582718292616 & -0.758271829261605 \tabularnewline
28 & 64 & 69.6278480195905 & -5.62784801959054 \tabularnewline
29 & 78.5 & 69.8673310159663 & 8.63266898403366 \tabularnewline
30 & 53 & 63.7927771704802 & -10.7927771704802 \tabularnewline
31 & 75 & 69.4055260146517 & 5.59447398534832 \tabularnewline
32 & 52.5 & 51.8576236270084 & 0.642376372991575 \tabularnewline
33 & 68.5 & 68.3203470802894 & 0.179652919710596 \tabularnewline
34 & 70 & 69.8405181743665 & 0.159481825633457 \tabularnewline
35 & 70.5 & 64.6481567882124 & 5.8518432117876 \tabularnewline
36 & 76 & 70.5564932172191 & 5.44350678278086 \tabularnewline
37 & 75.5 & 70.1316722561447 & 5.36832774385533 \tabularnewline
38 & 74.5 & 77.899319964354 & -3.39931996435408 \tabularnewline
39 & 65 & NA & NA \tabularnewline
40 & 54 & NA & NA \tabularnewline
\hline
\end{tabular}
%Source: https://freestatistics.org/blog/index.php?pk=98932&T=4

[TABLE]
[ROW][C]Multiple Linear Regression - Actuals, Interpolation, and Residuals[/C][/ROW]
[ROW][C]Time or Index[/C][C]Actuals[/C][C]InterpolationForecast[/C][C]ResidualsPrediction Error[/C][/ROW]
[ROW][C]1[/C][C]70.5[/C][C]70.2490611151902[/C][C]0.250938884809809[/C][/ROW]
[ROW][C]2[/C][C]53.5[/C][C]61.2858786292636[/C][C]-7.78587862926362[/C][/ROW]
[ROW][C]3[/C][C]65[/C][C]70.0921741664828[/C][C]-5.09217416648283[/C][/ROW]
[ROW][C]4[/C][C]76.5[/C][C]69.955973801418[/C][C]6.54402619858207[/C][/ROW]
[ROW][C]5[/C][C]70[/C][C]70.0346237875888[/C][C]-0.0346237875887938[/C][/ROW]
[ROW][C]6[/C][C]71[/C][C]68.6445232912089[/C][C]2.35547670879113[/C][/ROW]
[ROW][C]7[/C][C]60.5[/C][C]69.9115517361336[/C][C]-9.41155173613358[/C][/ROW]
[ROW][C]8[/C][C]51.5[/C][C]42.382183547209[/C][C]9.117816452791[/C][/ROW]
[ROW][C]9[/C][C]78[/C][C]69.8033771005696[/C][C]8.19662289943036[/C][/ROW]
[ROW][C]10[/C][C]76[/C][C]69.8318565785197[/C][C]6.16814342148027[/C][/ROW]
[ROW][C]11[/C][C]57.5[/C][C]68.4189613765537[/C][C]-10.9189613765537[/C][/ROW]
[ROW][C]12[/C][C]61[/C][C]66.3329238018855[/C][C]-5.33292380188547[/C][/ROW]
[ROW][C]13[/C][C]64.5[/C][C]68.5683359467432[/C][C]-4.06833594674322[/C][/ROW]
[ROW][C]14[/C][C]78.5[/C][C]69.6542090421972[/C][C]8.84579095780276[/C][/ROW]
[ROW][C]15[/C][C]79[/C][C]69.8565225028172[/C][C]9.14347749718283[/C][/ROW]
[ROW][C]16[/C][C]61[/C][C]64.8343503750947[/C][C]-3.83435037509469[/C][/ROW]
[ROW][C]17[/C][C]70[/C][C]68.57129534067[/C][C]1.42870465932992[/C][/ROW]
[ROW][C]18[/C][C]70[/C][C]69.0234110042509[/C][C]0.976588995749112[/C][/ROW]
[ROW][C]19[/C][C]72[/C][C]68.9245918534589[/C][C]3.07540814654108[/C][/ROW]
[ROW][C]20[/C][C]64.5[/C][C]67.6675309830999[/C][C]-3.16753098309992[/C][/ROW]
[ROW][C]21[/C][C]54.5[/C][C]57.2214468665424[/C][C]-2.72144686654235[/C][/ROW]
[ROW][C]22[/C][C]56.5[/C][C]67.906664626414[/C][C]-11.4066646264139[/C][/ROW]
[ROW][C]23[/C][C]64.5[/C][C]69.7312046548738[/C][C]-5.23120465487377[/C][/ROW]
[ROW][C]24[/C][C]64.5[/C][C]68.2645622942664[/C][C]-3.76456229426644[/C][/ROW]
[ROW][C]25[/C][C]73[/C][C]69.5112890667253[/C][C]3.48871093327472[/C][/ROW]
[ROW][C]26[/C][C]72[/C][C]70.1156113532777[/C][C]1.88438864672235[/C][/ROW]
[ROW][C]27[/C][C]69[/C][C]69.7582718292616[/C][C]-0.758271829261605[/C][/ROW]
[ROW][C]28[/C][C]64[/C][C]69.6278480195905[/C][C]-5.62784801959054[/C][/ROW]
[ROW][C]29[/C][C]78.5[/C][C]69.8673310159663[/C][C]8.63266898403366[/C][/ROW]
[ROW][C]30[/C][C]53[/C][C]63.7927771704802[/C][C]-10.7927771704802[/C][/ROW]
[ROW][C]31[/C][C]75[/C][C]69.4055260146517[/C][C]5.59447398534832[/C][/ROW]
[ROW][C]32[/C][C]52.5[/C][C]51.8576236270084[/C][C]0.642376372991575[/C][/ROW]
[ROW][C]33[/C][C]68.5[/C][C]68.3203470802894[/C][C]0.179652919710596[/C][/ROW]
[ROW][C]34[/C][C]70[/C][C]69.8405181743665[/C][C]0.159481825633457[/C][/ROW]
[ROW][C]35[/C][C]70.5[/C][C]64.6481567882124[/C][C]5.8518432117876[/C][/ROW]
[ROW][C]36[/C][C]76[/C][C]70.5564932172191[/C][C]5.44350678278086[/C][/ROW]
[ROW][C]37[/C][C]75.5[/C][C]70.1316722561447[/C][C]5.36832774385533[/C][/ROW]
[ROW][C]38[/C][C]74.5[/C][C]77.899319964354[/C][C]-3.39931996435408[/C][/ROW]
[ROW][C]39[/C][C]65[/C][C]NA[/C][C]NA[/C][/ROW]
[ROW][C]40[/C][C]54[/C][C]NA[/C][C]NA[/C][/ROW]
[/TABLE]
Source: https://freestatistics.org/blog/index.php?pk=98932&T=4

Globally Unique Identifier (entire table): ba.freestatistics.org/blog/index.php?pk=98932&T=4

As an alternative you can also use a QR Code:  

The GUIDs for individual cells are displayed in the table below:

Multiple Linear Regression - Actuals, Interpolation, and Residuals
Time or IndexActualsInterpolationForecastResidualsPrediction Error
170.570.24906111519020.250938884809809
253.561.2858786292636-7.78587862926362
36570.0921741664828-5.09217416648283
476.569.9559738014186.54402619858207
57070.0346237875888-0.0346237875887938
67168.64452329120892.35547670879113
760.569.9115517361336-9.41155173613358
851.542.3821835472099.117816452791
97869.80337710056968.19662289943036
107669.83185657851976.16814342148027
1157.568.4189613765537-10.9189613765537
126166.3329238018855-5.33292380188547
1364.568.5683359467432-4.06833594674322
1478.569.65420904219728.84579095780276
157969.85652250281729.14347749718283
166164.8343503750947-3.83435037509469
177068.571295340671.42870465932992
187069.02341100425090.976588995749112
197268.92459185345893.07540814654108
2064.567.6675309830999-3.16753098309992
2154.557.2214468665424-2.72144686654235
2256.567.906664626414-11.4066646264139
2364.569.7312046548738-5.23120465487377
2464.568.2645622942664-3.76456229426644
257369.51128906672533.48871093327472
267270.11561135327771.88438864672235
276969.7582718292616-0.758271829261605
286469.6278480195905-5.62784801959054
2978.569.86733101596638.63266898403366
305363.7927771704802-10.7927771704802
317569.40552601465175.59447398534832
3252.551.85762362700840.642376372991575
3368.568.32034708028940.179652919710596
347069.84051817436650.159481825633457
3570.564.64815678821245.8518432117876
367670.55649321721915.44350678278086
3775.570.13167225614475.36832774385533
3874.577.899319964354-3.39931996435408
3965NANA
4054NANA


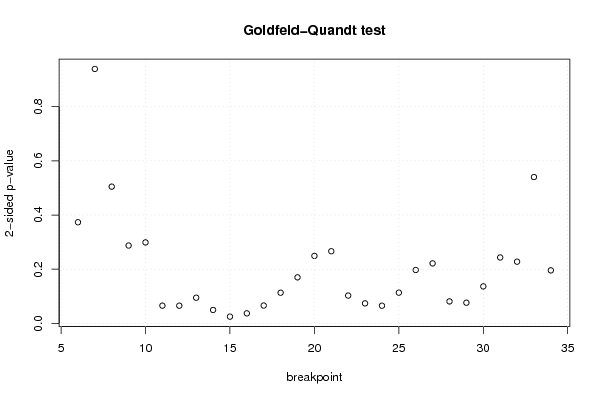
Goldfeld-Quandt test for Heteroskedasticity
p-valuesAlternative Hypothesis
breakpoint indexgreater2-sidedless
60.1867136625646220.3734273251292450.813286337435378
70.5304073863016320.9391852273967360.469592613698368
80.7476013956431730.5047972087136540.252398604356827
90.8562777718319680.2874444563360630.143722228168032
100.8504818922223940.2990362155552120.149518107777606
110.967194587865460.06561082426907930.0328054121345396
120.9672408157989440.06551836840211130.0327591842010557
130.952568373223130.09486325355374140.0474316267768707
140.9751838271059780.04963234578804450.0248161728940223
150.9874918805331970.02501623893360680.0125081194668034
160.981382414465030.03723517106994000.0186175855349700
170.9669782074407480.06604358511850440.0330217925592522
180.9433307166615850.1133385666768310.0566692833384155
190.914894962573880.1702100748522400.0851050374261202
200.8753716255304820.2492567489390360.124628374469518
210.8667655386533630.2664689226932740.133234461346637
220.9485809300250110.1028381399499780.051419069974989
230.9629598111325730.07408037773485360.0370401888674268
240.9672853176001170.06542936479976640.0327146823998832
250.9431988459380270.1136023081239460.0568011540619729
260.9013727022173840.1972545955652320.0986272977826162
270.8892410729869710.2215178540260580.110758927013029
280.9593549088723140.08129018225537140.0406450911276857
290.9617835878446940.07643282431061270.0382164121553063
300.931613928907970.1367721421840600.0683860710920299
310.8782967193675490.2434065612649030.121703280632451
320.8860425701500080.2279148596999840.113957429849992
330.729858530367080.5402829392658390.270141469632920
340.9020651681808570.1958696636382850.0979348318191427

\begin{tabular}{lllllllll}
\hline
Goldfeld-Quandt test for Heteroskedasticity \tabularnewline
p-values & Alternative Hypothesis \tabularnewline
breakpoint index & greater & 2-sided & less \tabularnewline
6 & 0.186713662564622 & 0.373427325129245 & 0.813286337435378 \tabularnewline
7 & 0.530407386301632 & 0.939185227396736 & 0.469592613698368 \tabularnewline
8 & 0.747601395643173 & 0.504797208713654 & 0.252398604356827 \tabularnewline
9 & 0.856277771831968 & 0.287444456336063 & 0.143722228168032 \tabularnewline
10 & 0.850481892222394 & 0.299036215555212 & 0.149518107777606 \tabularnewline
11 & 0.96719458786546 & 0.0656108242690793 & 0.0328054121345396 \tabularnewline
12 & 0.967240815798944 & 0.0655183684021113 & 0.0327591842010557 \tabularnewline
13 & 0.95256837322313 & 0.0948632535537414 & 0.0474316267768707 \tabularnewline
14 & 0.975183827105978 & 0.0496323457880445 & 0.0248161728940223 \tabularnewline
15 & 0.987491880533197 & 0.0250162389336068 & 0.0125081194668034 \tabularnewline
16 & 0.98138241446503 & 0.0372351710699400 & 0.0186175855349700 \tabularnewline
17 & 0.966978207440748 & 0.0660435851185044 & 0.0330217925592522 \tabularnewline
18 & 0.943330716661585 & 0.113338566676831 & 0.0566692833384155 \tabularnewline
19 & 0.91489496257388 & 0.170210074852240 & 0.0851050374261202 \tabularnewline
20 & 0.875371625530482 & 0.249256748939036 & 0.124628374469518 \tabularnewline
21 & 0.866765538653363 & 0.266468922693274 & 0.133234461346637 \tabularnewline
22 & 0.948580930025011 & 0.102838139949978 & 0.051419069974989 \tabularnewline
23 & 0.962959811132573 & 0.0740803777348536 & 0.0370401888674268 \tabularnewline
24 & 0.967285317600117 & 0.0654293647997664 & 0.0327146823998832 \tabularnewline
25 & 0.943198845938027 & 0.113602308123946 & 0.0568011540619729 \tabularnewline
26 & 0.901372702217384 & 0.197254595565232 & 0.0986272977826162 \tabularnewline
27 & 0.889241072986971 & 0.221517854026058 & 0.110758927013029 \tabularnewline
28 & 0.959354908872314 & 0.0812901822553714 & 0.0406450911276857 \tabularnewline
29 & 0.961783587844694 & 0.0764328243106127 & 0.0382164121553063 \tabularnewline
30 & 0.93161392890797 & 0.136772142184060 & 0.0683860710920299 \tabularnewline
31 & 0.878296719367549 & 0.243406561264903 & 0.121703280632451 \tabularnewline
32 & 0.886042570150008 & 0.227914859699984 & 0.113957429849992 \tabularnewline
33 & 0.72985853036708 & 0.540282939265839 & 0.270141469632920 \tabularnewline
34 & 0.902065168180857 & 0.195869663638285 & 0.0979348318191427 \tabularnewline
\hline
\end{tabular}
%Source: https://freestatistics.org/blog/index.php?pk=98932&T=5

[TABLE]
[ROW][C]Goldfeld-Quandt test for Heteroskedasticity[/C][/ROW]
[ROW][C]p-values[/C][C]Alternative Hypothesis[/C][/ROW]
[ROW][C]breakpoint index[/C][C]greater[/C][C]2-sided[/C][C]less[/C][/ROW]
[ROW][C]6[/C][C]0.186713662564622[/C][C]0.373427325129245[/C][C]0.813286337435378[/C][/ROW]
[ROW][C]7[/C][C]0.530407386301632[/C][C]0.939185227396736[/C][C]0.469592613698368[/C][/ROW]
[ROW][C]8[/C][C]0.747601395643173[/C][C]0.504797208713654[/C][C]0.252398604356827[/C][/ROW]
[ROW][C]9[/C][C]0.856277771831968[/C][C]0.287444456336063[/C][C]0.143722228168032[/C][/ROW]
[ROW][C]10[/C][C]0.850481892222394[/C][C]0.299036215555212[/C][C]0.149518107777606[/C][/ROW]
[ROW][C]11[/C][C]0.96719458786546[/C][C]0.0656108242690793[/C][C]0.0328054121345396[/C][/ROW]
[ROW][C]12[/C][C]0.967240815798944[/C][C]0.0655183684021113[/C][C]0.0327591842010557[/C][/ROW]
[ROW][C]13[/C][C]0.95256837322313[/C][C]0.0948632535537414[/C][C]0.0474316267768707[/C][/ROW]
[ROW][C]14[/C][C]0.975183827105978[/C][C]0.0496323457880445[/C][C]0.0248161728940223[/C][/ROW]
[ROW][C]15[/C][C]0.987491880533197[/C][C]0.0250162389336068[/C][C]0.0125081194668034[/C][/ROW]
[ROW][C]16[/C][C]0.98138241446503[/C][C]0.0372351710699400[/C][C]0.0186175855349700[/C][/ROW]
[ROW][C]17[/C][C]0.966978207440748[/C][C]0.0660435851185044[/C][C]0.0330217925592522[/C][/ROW]
[ROW][C]18[/C][C]0.943330716661585[/C][C]0.113338566676831[/C][C]0.0566692833384155[/C][/ROW]
[ROW][C]19[/C][C]0.91489496257388[/C][C]0.170210074852240[/C][C]0.0851050374261202[/C][/ROW]
[ROW][C]20[/C][C]0.875371625530482[/C][C]0.249256748939036[/C][C]0.124628374469518[/C][/ROW]
[ROW][C]21[/C][C]0.866765538653363[/C][C]0.266468922693274[/C][C]0.133234461346637[/C][/ROW]
[ROW][C]22[/C][C]0.948580930025011[/C][C]0.102838139949978[/C][C]0.051419069974989[/C][/ROW]
[ROW][C]23[/C][C]0.962959811132573[/C][C]0.0740803777348536[/C][C]0.0370401888674268[/C][/ROW]
[ROW][C]24[/C][C]0.967285317600117[/C][C]0.0654293647997664[/C][C]0.0327146823998832[/C][/ROW]
[ROW][C]25[/C][C]0.943198845938027[/C][C]0.113602308123946[/C][C]0.0568011540619729[/C][/ROW]
[ROW][C]26[/C][C]0.901372702217384[/C][C]0.197254595565232[/C][C]0.0986272977826162[/C][/ROW]
[ROW][C]27[/C][C]0.889241072986971[/C][C]0.221517854026058[/C][C]0.110758927013029[/C][/ROW]
[ROW][C]28[/C][C]0.959354908872314[/C][C]0.0812901822553714[/C][C]0.0406450911276857[/C][/ROW]
[ROW][C]29[/C][C]0.961783587844694[/C][C]0.0764328243106127[/C][C]0.0382164121553063[/C][/ROW]
[ROW][C]30[/C][C]0.93161392890797[/C][C]0.136772142184060[/C][C]0.0683860710920299[/C][/ROW]
[ROW][C]31[/C][C]0.878296719367549[/C][C]0.243406561264903[/C][C]0.121703280632451[/C][/ROW]
[ROW][C]32[/C][C]0.886042570150008[/C][C]0.227914859699984[/C][C]0.113957429849992[/C][/ROW]
[ROW][C]33[/C][C]0.72985853036708[/C][C]0.540282939265839[/C][C]0.270141469632920[/C][/ROW]
[ROW][C]34[/C][C]0.902065168180857[/C][C]0.195869663638285[/C][C]0.0979348318191427[/C][/ROW]
[/TABLE]
Source: https://freestatistics.org/blog/index.php?pk=98932&T=5

Globally Unique Identifier (entire table): ba.freestatistics.org/blog/index.php?pk=98932&T=5

As an alternative you can also use a QR Code:  

The GUIDs for individual cells are displayed in the table below:

Goldfeld-Quandt test for Heteroskedasticity
p-valuesAlternative Hypothesis
breakpoint indexgreater2-sidedless
60.1867136625646220.3734273251292450.813286337435378
70.5304073863016320.9391852273967360.469592613698368
80.7476013956431730.5047972087136540.252398604356827
90.8562777718319680.2874444563360630.143722228168032
100.8504818922223940.2990362155552120.149518107777606
110.967194587865460.06561082426907930.0328054121345396
120.9672408157989440.06551836840211130.0327591842010557
130.952568373223130.09486325355374140.0474316267768707
140.9751838271059780.04963234578804450.0248161728940223
150.9874918805331970.02501623893360680.0125081194668034
160.981382414465030.03723517106994000.0186175855349700
170.9669782074407480.06604358511850440.0330217925592522
180.9433307166615850.1133385666768310.0566692833384155
190.914894962573880.1702100748522400.0851050374261202
200.8753716255304820.2492567489390360.124628374469518
210.8667655386533630.2664689226932740.133234461346637
220.9485809300250110.1028381399499780.051419069974989
230.9629598111325730.07408037773485360.0370401888674268
240.9672853176001170.06542936479976640.0327146823998832
250.9431988459380270.1136023081239460.0568011540619729
260.9013727022173840.1972545955652320.0986272977826162
270.8892410729869710.2215178540260580.110758927013029
280.9593549088723140.08129018225537140.0406450911276857
290.9617835878446940.07643282431061270.0382164121553063
300.931613928907970.1367721421840600.0683860710920299
310.8782967193675490.2434065612649030.121703280632451
320.8860425701500080.2279148596999840.113957429849992
330.729858530367080.5402829392658390.270141469632920
340.9020651681808570.1958696636382850.0979348318191427


Meta Analysis of Goldfeld-Quandt test for Heteroskedasticity
Description# significant tests% significant testsOK/NOK
1% type I error level00OK
5% type I error level30.103448275862069NOK
10% type I error level110.379310344827586NOK

\begin{tabular}{lllllllll}
\hline
Meta Analysis of Goldfeld-Quandt test for Heteroskedasticity \tabularnewline
Description & # significant tests & % significant tests & OK/NOK \tabularnewline
1% type I error level & 0 & 0 & OK \tabularnewline
5% type I error level & 3 & 0.103448275862069 & NOK \tabularnewline
10% type I error level & 11 & 0.379310344827586 & NOK \tabularnewline
\hline
\end{tabular}
%Source: https://freestatistics.org/blog/index.php?pk=98932&T=6

[TABLE]
[ROW][C]Meta Analysis of Goldfeld-Quandt test for Heteroskedasticity[/C][/ROW]
[ROW][C]Description[/C][C]# significant tests[/C][C]% significant tests[/C][C]OK/NOK[/C][/ROW]
[ROW][C]1% type I error level[/C][C]0[/C][C]0[/C][C]OK[/C][/ROW]
[ROW][C]5% type I error level[/C][C]3[/C][C]0.103448275862069[/C][C]NOK[/C][/ROW]
[ROW][C]10% type I error level[/C][C]11[/C][C]0.379310344827586[/C][C]NOK[/C][/ROW]
[/TABLE]
Source: https://freestatistics.org/blog/index.php?pk=98932&T=6

Globally Unique Identifier (entire table): ba.freestatistics.org/blog/index.php?pk=98932&T=6

As an alternative you can also use a QR Code:  

The GUIDs for individual cells are displayed in the table below:

Meta Analysis of Goldfeld-Quandt test for Heteroskedasticity
Description# significant tests% significant testsOK/NOK
1% type I error level00OK
5% type I error level30.103448275862069NOK
10% type I error level110.379310344827586NOK


Parameters (Session):
par1 = 1 ; par2 = Do not include Seasonal Dummies ; par3 = No Linear Trend ;
Parameters (R input):
par1 = 1 ; par2 = Do not include Seasonal Dummies ; par3 = No Linear Trend ;
R code (references can be found in the software module):
library(lattice)
library(lmtest)
n25 <- 25 #minimum number of obs. for Goldfeld-Quandt test
par1 <- as.numeric(par1)
x <- t(y)
k <- length(x[1,])
n <- length(x[,1])
x1 <- cbind(x[,par1], x[,1:k!=par1])
mycolnames <- c(colnames(x)[par1], colnames(x)[1:k!=par1])
colnames(x1) <- mycolnames #colnames(x)[par1]
x <- x1
if (par3 == 'First Differences'){
x2 <- array(0, dim=c(n-1,k), dimnames=list(1:(n-1), paste('(1-B)',colnames(x),sep='')))
for (i in 1:n-1) {
for (j in 1:k) {
x2[i,j] <- x[i+1,j] - x[i,j]
}
}
x <- x2
}
if (par2 == 'Include Monthly Dummies'){
x2 <- array(0, dim=c(n,11), dimnames=list(1:n, paste('M', seq(1:11), sep ='')))
for (i in 1:11){
x2[seq(i,n,12),i] <- 1
}
x <- cbind(x, x2)
}
if (par2 == 'Include Quarterly Dummies'){
x2 <- array(0, dim=c(n,3), dimnames=list(1:n, paste('Q', seq(1:3), sep ='')))
for (i in 1:3){
x2[seq(i,n,4),i] <- 1
}
x <- cbind(x, x2)
}
k <- length(x[1,])
if (par3 == 'Linear Trend'){
x <- cbind(x, c(1:n))
colnames(x)[k+1] <- 't'
}
x
k <- length(x[1,])
df <- as.data.frame(x)
(mylm <- lm(df))
(mysum <- summary(mylm))
if (n > n25) {
kp3 <- k + 3
nmkm3 <- n - k - 3
gqarr <- array(NA, dim=c(nmkm3-kp3+1,3))
numgqtests <- 0
numsignificant1 <- 0
numsignificant5 <- 0
numsignificant10 <- 0
for (mypoint in kp3:nmkm3) {
j <- 0
numgqtests <- numgqtests + 1
for (myalt in c('greater', 'two.sided', 'less')) {
j <- j + 1
gqarr[mypoint-kp3+1,j] <- gqtest(mylm, point=mypoint, alternative=myalt)$p.value
}
if (gqarr[mypoint-kp3+1,2] < 0.01) numsignificant1 <- numsignificant1 + 1
if (gqarr[mypoint-kp3+1,2] < 0.05) numsignificant5 <- numsignificant5 + 1
if (gqarr[mypoint-kp3+1,2] < 0.10) numsignificant10 <- numsignificant10 + 1
}
gqarr
}
bitmap(file='test0.png')
plot(x[,1], type='l', main='Actuals and Interpolation', ylab='value of Actuals and Interpolation (dots)', xlab='time or index')
points(x[,1]-mysum$resid)
grid()
dev.off()
bitmap(file='test1.png')
plot(mysum$resid, type='b', pch=19, main='Residuals', ylab='value of Residuals', xlab='time or index')
grid()
dev.off()
bitmap(file='test2.png')
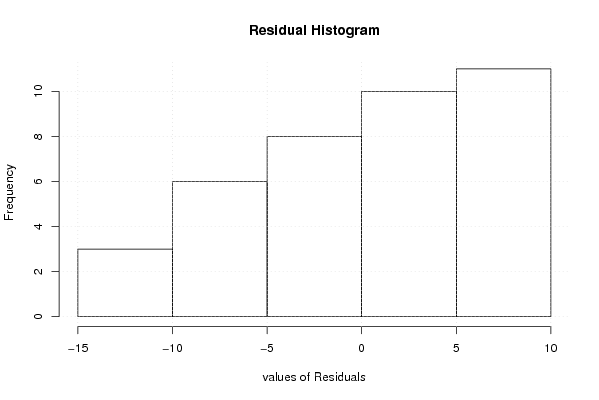
hist(mysum$resid, main='Residual Histogram', xlab='values of Residuals')
grid()
dev.off()
bitmap(file='test3.png')
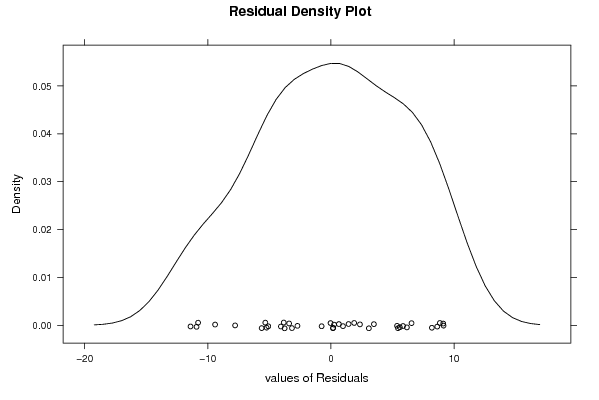
densityplot(~mysum$resid,col='black',main='Residual Density Plot', xlab='values of Residuals')
dev.off()
bitmap(file='test4.png')
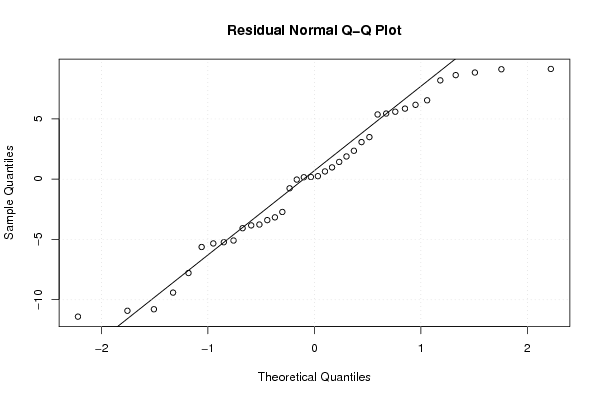
qqnorm(mysum$resid, main='Residual Normal Q-Q Plot')
qqline(mysum$resid)
grid()
dev.off()
(myerror <- as.ts(mysum$resid))
bitmap(file='test5.png')
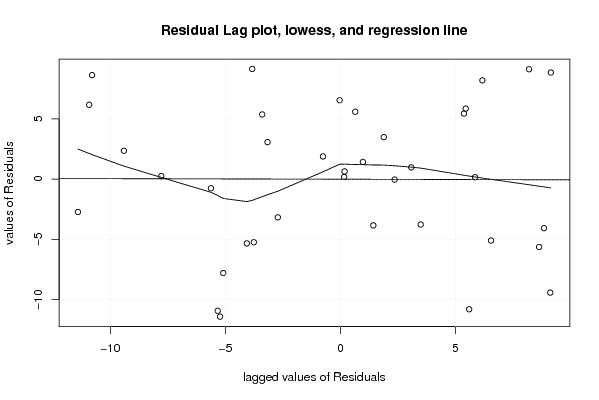
dum <- cbind(lag(myerror,k=1),myerror)
dum
dum1 <- dum[2:length(myerror),]
dum1
z <- as.data.frame(dum1)
z
plot(z,main=paste('Residual Lag plot, lowess, and regression line'), ylab='values of Residuals', xlab='lagged values of Residuals')
lines(lowess(z))
abline(lm(z))
grid()
dev.off()
bitmap(file='test6.png')
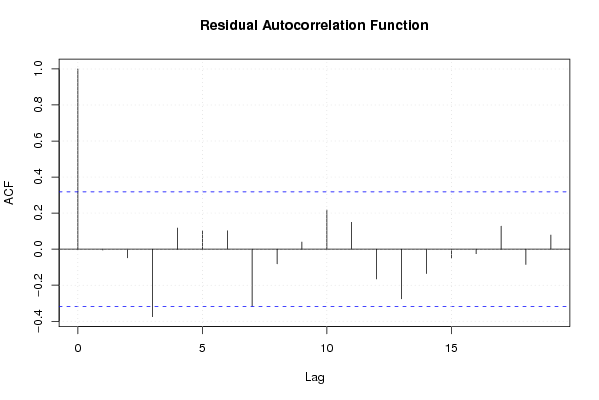
acf(mysum$resid, lag.max=length(mysum$resid)/2, main='Residual Autocorrelation Function')
grid()
dev.off()
bitmap(file='test7.png')
pacf(mysum$resid, lag.max=length(mysum$resid)/2, main='Residual Partial Autocorrelation Function')
grid()
dev.off()
bitmap(file='test8.png')
opar <- par(mfrow = c(2,2), oma = c(0, 0, 1.1, 0))
plot(mylm, las = 1, sub='Residual Diagnostics')
par(opar)
dev.off()
if (n > n25) {
bitmap(file='test9.png')
plot(kp3:nmkm3,gqarr[,2], main='Goldfeld-Quandt test',ylab='2-sided p-value',xlab='breakpoint')
grid()
dev.off()
}
load(file='createtable')
a<-table.start()
a<-table.row.start(a)
a<-table.element(a, 'Multiple Linear Regression - Estimated Regression Equation', 1, TRUE)
a<-table.row.end(a)
myeq <- colnames(x)[1]
myeq <- paste(myeq, '[t] = ', sep='')
for (i in 1:k){
if (mysum$coefficients[i,1] > 0) myeq <- paste(myeq, '+', '')
myeq <- paste(myeq, mysum$coefficients[i,1], sep=' ')
if (rownames(mysum$coefficients)[i] != '(Intercept)') {
myeq <- paste(myeq, rownames(mysum$coefficients)[i], sep='')
if (rownames(mysum$coefficients)[i] != 't') myeq <- paste(myeq, '[t]', sep='')
}
}
myeq <- paste(myeq, ' + e[t]')
a<-table.row.start(a)
a<-table.element(a, myeq)
a<-table.row.end(a)
a<-table.end(a)
table.save(a,file='mytable1.tab')
a<-table.start()
a<-table.row.start(a)
a<-table.element(a,hyperlink('ols1.htm','Multiple Linear Regression - Ordinary Least Squares',''), 6, TRUE)
a<-table.row.end(a)
a<-table.row.start(a)
a<-table.element(a,'Variable',header=TRUE)
a<-table.element(a,'Parameter',header=TRUE)
a<-table.element(a,'S.D.',header=TRUE)
a<-table.element(a,'T-STAT
H0: parameter = 0',header=TRUE)
a<-table.element(a,'2-tail p-value',header=TRUE)
a<-table.element(a,'1-tail p-value',header=TRUE)
a<-table.row.end(a)
for (i in 1:k){
a<-table.row.start(a)
a<-table.element(a,rownames(mysum$coefficients)[i],header=TRUE)
a<-table.element(a,mysum$coefficients[i,1])
a<-table.element(a, round(mysum$coefficients[i,2],6))
a<-table.element(a, round(mysum$coefficients[i,3],4))
a<-table.element(a, round(mysum$coefficients[i,4],6))
a<-table.element(a, round(mysum$coefficients[i,4]/2,6))
a<-table.row.end(a)
}
a<-table.end(a)
table.save(a,file='mytable2.tab')
a<-table.start()
a<-table.row.start(a)
a<-table.element(a, 'Multiple Linear Regression - Regression Statistics', 2, TRUE)
a<-table.row.end(a)
a<-table.row.start(a)
a<-table.element(a, 'Multiple R',1,TRUE)
a<-table.element(a, sqrt(mysum$r.squared))
a<-table.row.end(a)
a<-table.row.start(a)
a<-table.element(a, 'R-squared',1,TRUE)
a<-table.element(a, mysum$r.squared)
a<-table.row.end(a)
a<-table.row.start(a)
a<-table.element(a, 'Adjusted R-squared',1,TRUE)
a<-table.element(a, mysum$adj.r.squared)
a<-table.row.end(a)
a<-table.row.start(a)
a<-table.element(a, 'F-TEST (value)',1,TRUE)
a<-table.element(a, mysum$fstatistic[1])
a<-table.row.end(a)
a<-table.row.start(a)
a<-table.element(a, 'F-TEST (DF numerator)',1,TRUE)
a<-table.element(a, mysum$fstatistic[2])
a<-table.row.end(a)
a<-table.row.start(a)
a<-table.element(a, 'F-TEST (DF denominator)',1,TRUE)
a<-table.element(a, mysum$fstatistic[3])
a<-table.row.end(a)
a<-table.row.start(a)
a<-table.element(a, 'p-value',1,TRUE)
a<-table.element(a, 1-pf(mysum$fstatistic[1],mysum$fstatistic[2],mysum$fstatistic[3]))
a<-table.row.end(a)
a<-table.row.start(a)
a<-table.element(a, 'Multiple Linear Regression - Residual Statistics', 2, TRUE)
a<-table.row.end(a)
a<-table.row.start(a)
a<-table.element(a, 'Residual Standard Deviation',1,TRUE)
a<-table.element(a, mysum$sigma)
a<-table.row.end(a)
a<-table.row.start(a)
a<-table.element(a, 'Sum Squared Residuals',1,TRUE)
a<-table.element(a, sum(myerror*myerror))
a<-table.row.end(a)
a<-table.end(a)
table.save(a,file='mytable3.tab')
a<-table.start()
a<-table.row.start(a)
a<-table.element(a, 'Multiple Linear Regression - Actuals, Interpolation, and Residuals', 4, TRUE)
a<-table.row.end(a)
a<-table.row.start(a)
a<-table.element(a, 'Time or Index', 1, TRUE)
a<-table.element(a, 'Actuals', 1, TRUE)
a<-table.element(a, 'Interpolation
Forecast', 1, TRUE)
a<-table.element(a, 'Residuals
Prediction Error', 1, TRUE)
a<-table.row.end(a)
for (i in 1:n) {
a<-table.row.start(a)
a<-table.element(a,i, 1, TRUE)
a<-table.element(a,x[i])
a<-table.element(a,x[i]-mysum$resid[i])
a<-table.element(a,mysum$resid[i])
a<-table.row.end(a)
}
a<-table.end(a)
table.save(a,file='mytable4.tab')
if (n > n25) {
a<-table.start()
a<-table.row.start(a)
a<-table.element(a,'Goldfeld-Quandt test for Heteroskedasticity',4,TRUE)
a<-table.row.end(a)
a<-table.row.start(a)
a<-table.element(a,'p-values',header=TRUE)
a<-table.element(a,'Alternative Hypothesis',3,header=TRUE)
a<-table.row.end(a)
a<-table.row.start(a)
a<-table.element(a,'breakpoint index',header=TRUE)
a<-table.element(a,'greater',header=TRUE)
a<-table.element(a,'2-sided',header=TRUE)
a<-table.element(a,'less',header=TRUE)
a<-table.row.end(a)
for (mypoint in kp3:nmkm3) {
a<-table.row.start(a)
a<-table.element(a,mypoint,header=TRUE)
a<-table.element(a,gqarr[mypoint-kp3+1,1])
a<-table.element(a,gqarr[mypoint-kp3+1,2])
a<-table.element(a,gqarr[mypoint-kp3+1,3])
a<-table.row.end(a)
}
a<-table.end(a)
table.save(a,file='mytable5.tab')
a<-table.start()
a<-table.row.start(a)
a<-table.element(a,'Meta Analysis of Goldfeld-Quandt test for Heteroskedasticity',4,TRUE)
a<-table.row.end(a)
a<-table.row.start(a)
a<-table.element(a,'Description',header=TRUE)
a<-table.element(a,'# significant tests',header=TRUE)
a<-table.element(a,'% significant tests',header=TRUE)
a<-table.element(a,'OK/NOK',header=TRUE)
a<-table.row.end(a)
a<-table.row.start(a)
a<-table.element(a,'1% type I error level',header=TRUE)
a<-table.element(a,numsignificant1)
a<-table.element(a,numsignificant1/numgqtests)
if (numsignificant1/numgqtests < 0.01) dum <- 'OK' else dum <- 'NOK'
a<-table.element(a,dum)
a<-table.row.end(a)
a<-table.row.start(a)
a<-table.element(a,'5% type I error level',header=TRUE)
a<-table.element(a,numsignificant5)
a<-table.element(a,numsignificant5/numgqtests)
if (numsignificant5/numgqtests < 0.05) dum <- 'OK' else dum <- 'NOK'
a<-table.element(a,dum)
a<-table.row.end(a)
a<-table.row.start(a)
a<-table.element(a,'10% type I error level',header=TRUE)
a<-table.element(a,numsignificant10)
a<-table.element(a,numsignificant10/numgqtests)
if (numsignificant10/numgqtests < 0.1) dum <- 'OK' else dum <- 'NOK'
a<-table.element(a,dum)
a<-table.row.end(a)
a<-table.end(a)
table.save(a,file='mytable6.tab')
}