| Multiple Linear Regression - Estimated Regression Equation |
| Yt[t] = -91.9080275778757 + 0.529691487502998X1t[t] -0.00320282046758429X2t[t] -29.4520792768385X3t[t] + 38.120187685799X4t[t] + e[t] |
| Multiple Linear Regression - Ordinary Least Squares | |||||
| Variable | Parameter | S.D. | T-STAT H0: parameter = 0 | 2-tail p-value | 1-tail p-value |
| (Intercept) | -91.9080275778757 | 750.240579 | -0.1225 | 0.903242 | 0.451621 |
| X1t | 0.529691487502998 | 0.533294 | 0.9932 | 0.327819 | 0.163909 |
| X2t | -0.00320282046758429 | 0.011209 | -0.2857 | 0.776861 | 0.38843 |
| X3t | -29.4520792768385 | 28.448859 | -1.0353 | 0.308073 | 0.154036 |
| X4t | 38.120187685799 | 37.246024 | 1.0235 | 0.31353 | 0.156765 |
| Multiple Linear Regression - Regression Statistics | |
| Multiple R | 0.24378174897495 |
| R-squared | 0.0594295411332856 |
| Adjusted R-squared | -0.0545789993354069 |
| F-TEST (value) | 0.52127271245618 |
| F-TEST (DF numerator) | 4 |
| F-TEST (DF denominator) | 33 |
| p-value | 0.720694215763594 |
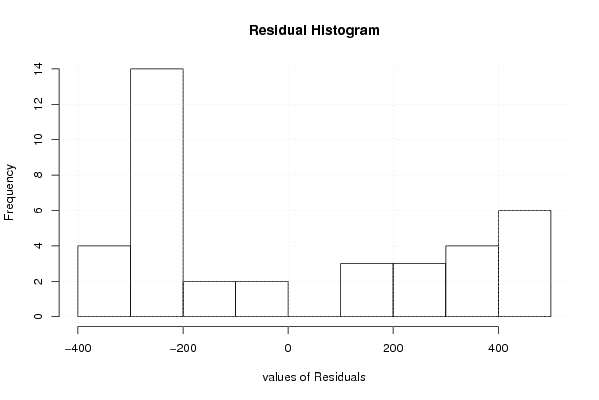
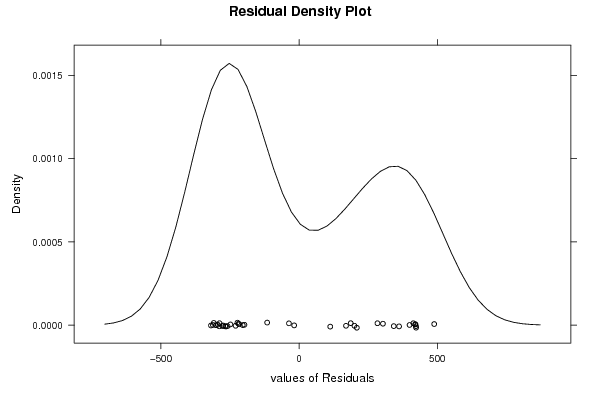
| Multiple Linear Regression - Residual Statistics | |
| Residual Standard Deviation | 312.156639267537 |
| Sum Squared Residuals | 3215578.3254805 |
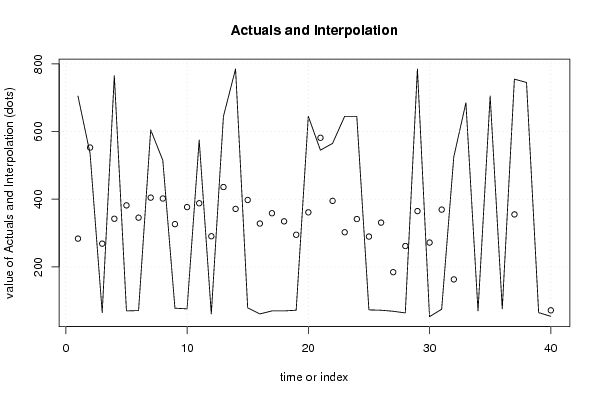
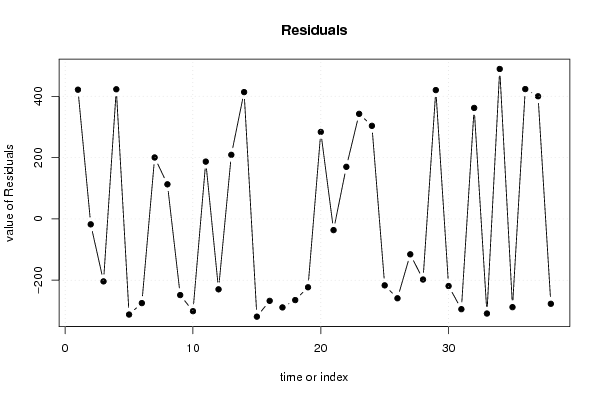
| Multiple Linear Regression - Actuals, Interpolation, and Residuals | |||
| Time or Index | Actuals | Interpolation Forecast | Residuals Prediction Error |
| 1 | 705 | 283.624403261612 | 421.375596738388 |
| 2 | 535 | 552.72613334315 | -17.7261333431495 |
| 3 | 65 | 268.730254866829 | -203.730254866829 |
| 4 | 765 | 342.266020235977 | 422.733979764023 |
| 5 | 70 | 381.893145463452 | -311.893145463452 |
| 6 | 71 | 345.506017325352 | -274.506017325352 |
| 7 | 605 | 404.698832587429 | 200.301167412571 |
| 8 | 515 | 402.160574912002 | 112.839425087998 |
| 9 | 78 | 326.396602497135 | -248.396602497135 |
| 10 | 76 | 376.815213408504 | -300.815213408504 |
| 11 | 575 | 388.114328530766 | 186.885671469234 |
| 12 | 61 | 290.627299530763 | -229.627299530763 |
| 13 | 645 | 435.998896692315 | 209.001103307685 |
| 14 | 785 | 371.417567512459 | 413.582432487541 |
| 15 | 79 | 397.739664952386 | -318.739664952386 |
| 16 | 61 | 328.162956383073 | -267.162956383073 |
| 17 | 70 | 358.629950463710 | -288.629950463710 |
| 18 | 70 | 334.683436430649 | -264.683436430649 |
| 19 | 72 | 294.944655911377 | -222.944655911377 |
| 20 | 645 | 361.342741455145 | 283.657258544855 |
| 21 | 545 | 581.561011538759 | -36.5610115387589 |
| 22 | 565 | 395.149975049424 | 169.850024950576 |
| 23 | 645 | 302.415912623459 | 342.584087376541 |
| 24 | 645 | 341.465752957172 | 303.534247042828 |
| 25 | 73 | 289.695432613867 | -216.695432613867 |
| 26 | 72 | 330.866749263006 | -258.866749263006 |
| 27 | 69 | 184.450714926203 | -115.450714926203 |
| 28 | 64 | 261.668936643654 | -197.668936643654 |
| 29 | 785 | 364.926751202785 | 420.073248797215 |
| 30 | 53 | 271.916958478780 | -218.916958478780 |
| 31 | 75 | 369.342708055126 | -294.342708055126 |
| 32 | 525 | 163.113965048644 | 361.886034951356 |
| 33 | 685 | 993.555331025642 | -308.555331025642 |
| 34 | 70 | -419.016349041194 | 489.016349041194 |
| 35 | 705 | 992.783561772025 | -287.783561772025 |
| 36 | 76 | -347.376727201954 | 423.376727201954 |
| 37 | 755 | 355.181013231290 | 399.81898676871 |
| 38 | 745 | 1021.81960604923 | -276.819606049228 |
| 39 | 65 | NA | NA |
| 40 | 54 | NA | NA |
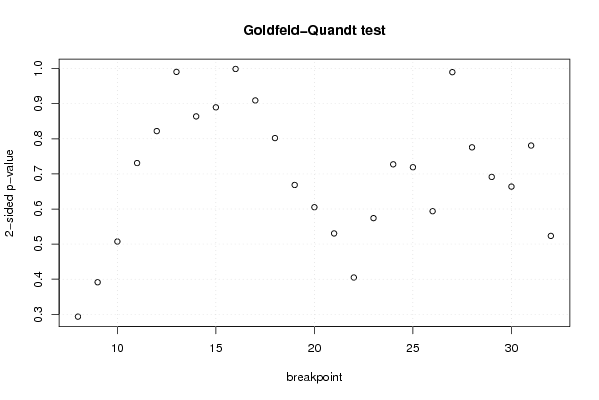
| Goldfeld-Quandt test for Heteroskedasticity | |||
| p-values | Alternative Hypothesis | ||
| breakpoint index | greater | 2-sided | less |
| 8 | 0.85329551068609 | 0.293408978627821 | 0.146704489313910 |
| 9 | 0.804307766262607 | 0.391384467474787 | 0.195692233737393 |
| 10 | 0.746312211989338 | 0.507375576021324 | 0.253687788010662 |
| 11 | 0.634572141484175 | 0.730855717031651 | 0.365427858515825 |
| 12 | 0.589060799662832 | 0.821878400674335 | 0.410939200337168 |
| 13 | 0.504757020161617 | 0.990485959676766 | 0.495242979838383 |
| 14 | 0.568117835979543 | 0.863764328040914 | 0.431882164020457 |
| 15 | 0.555226723063998 | 0.889546553872005 | 0.444773276936002 |
| 16 | 0.499436730052759 | 0.998873460105519 | 0.500563269947241 |
| 17 | 0.454586125077531 | 0.909172250155063 | 0.545413874922469 |
| 18 | 0.401015707960732 | 0.802031415921464 | 0.598984292039268 |
| 19 | 0.334241282302742 | 0.668482564605485 | 0.665758717697257 |
| 20 | 0.302533755637166 | 0.605067511274332 | 0.697466244362834 |
| 21 | 0.265208725386530 | 0.530417450773059 | 0.73479127461347 |
| 22 | 0.202453589319409 | 0.404907178638818 | 0.797546410680591 |
| 23 | 0.286981185323985 | 0.57396237064797 | 0.713018814676015 |
| 24 | 0.363628166638834 | 0.727256333277667 | 0.636371833361166 |
| 25 | 0.359481692969189 | 0.718963385938378 | 0.640518307030811 |
| 26 | 0.296858306594669 | 0.593716613189338 | 0.703141693405331 |
| 27 | 0.505130016158556 | 0.989739967682888 | 0.494869983841444 |
| 28 | 0.387814660932727 | 0.775629321865454 | 0.612185339067273 |
| 29 | 0.345699413688532 | 0.691398827377063 | 0.654300586311468 |
| 30 | 0.331892130806295 | 0.66378426161259 | 0.668107869193705 |
| 31 | 0.390366405623601 | 0.780732811247203 | 0.609633594376399 |
| 32 | 0.26170626796914 | 0.52341253593828 | 0.73829373203086 |
| Meta Analysis of Goldfeld-Quandt test for Heteroskedasticity | |||
| Description | # significant tests | % significant tests | OK/NOK |
| 1% type I error level | 0 | 0 | OK |
| 5% type I error level | 0 | 0 | OK |
| 10% type I error level | 0 | 0 | OK |