Free Statistics

of Irreproducible Research!

Author's title

Author*The author of this computation has been verified*
R Software Modulerwasp_multipleregression.wasp
Title produced by softwareMultiple Regression
Date of computationTue, 23 Nov 2010 11:00:50 +0000
Cite this page as followsStatistical Computations at FreeStatistics.org, Office for Research Development and Education, URL https://freestatistics.org/blog/index.php?v=date/2010/Nov/23/t129051008015nasv1v8lv33fx.htm/, Retrieved Fri, 19 Apr 2024 22:20:43 +0000
Statistical Computations at FreeStatistics.org, Office for Research Development and Education, URL https://freestatistics.org/blog/index.php?pk=98928, Retrieved Fri, 19 Apr 2024 22:20:43 +0000
QR Codes:

Original text written by user:
IsPrivate?No (this computation is public)
User-defined keywords
Estimated Impact134
Family? (F = Feedback message, R = changed R code, M = changed R Module, P = changed Parameters, D = changed Data)
-     [Multiple Regression] [Competence to learn] [2010-11-17 07:43:53] [b98453cac15ba1066b407e146608df68]
-   PD    [Multiple Regression] [Workshop 7 - regr...] [2010-11-23 11:00:50] [0605ea080d54454c99180f574351b8e4] [Current]
Feedback Forum

Post a new message
Dataseries X:
705	4	370	 74	67
535	315	6166	 53	54
65	4	684	 68	62
765	17	449	 80	73
70	8	643	 72	68
71	56	1551	 74	68
605	15	616	 61	60
515	503	36660 53	50
78	26	403	 82	74
76	26	346	 79	73
575	44	2471	 58	57
61	24	7427	 63	59
645	23	2992	 65	64
785	38	233	 82	75
79	18	609	 82	76
61	96	7615	 63	59
70	90	370	 73	67
70	49	1066	 73	67
72	66	600	 76	68
645	21	4873	 66	63
545	592	3485	 56	53
565	73	2364	 57	56
645	14	1016	 67	62
645	88	1062	 67	62
73	39	480	 77	69
72	6	559	 75	69
69	32	259	 74	64
64	11	1340	 67	61
785	26	275	 82	75
53	23	12550 54	52
75	32	965	 78	72
525	NA	25229 55	50
685	11	4883	 71	66
70	5	1189	 72	68
705	3	226	 75	66
76	3	611	 79	73
755	13	404	 79	72
745	56	576	 78	71
65	29	3096	 67	63
54	NA	23193 56	52


Summary of computational transaction
Raw Inputview raw input (R code)
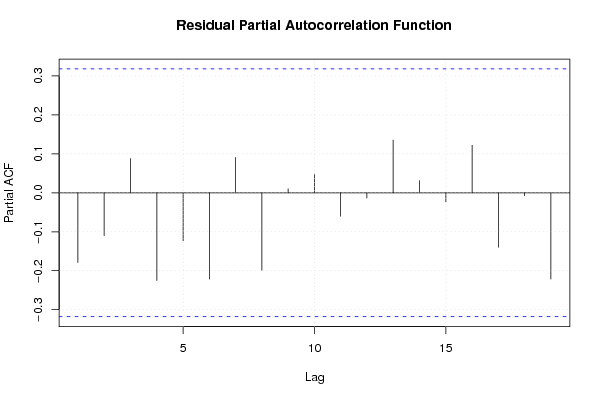
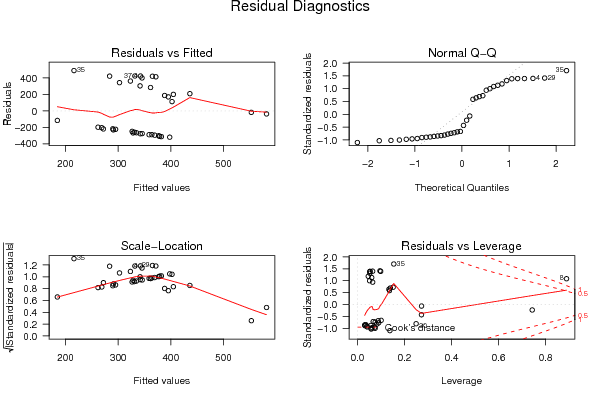
Raw Outputview raw output of R engine
Computing time6 seconds
R Server'Gwilym Jenkins' @ 72.249.127.135

\begin{tabular}{lllllllll}
\hline
Summary of computational transaction \tabularnewline
Raw Input & view raw input (R code)  \tabularnewline
Raw Output & view raw output of R engine  \tabularnewline
Computing time & 6 seconds \tabularnewline
R Server & 'Gwilym Jenkins' @ 72.249.127.135 \tabularnewline
\hline
\end{tabular}
%Source: https://freestatistics.org/blog/index.php?pk=98928&T=0

[TABLE]
[ROW][C]Summary of computational transaction[/C][/ROW]
[ROW][C]Raw Input[/C][C]view raw input (R code) [/C][/ROW]
[ROW][C]Raw Output[/C][C]view raw output of R engine [/C][/ROW]
[ROW][C]Computing time[/C][C]6 seconds[/C][/ROW]
[ROW][C]R Server[/C][C]'Gwilym Jenkins' @ 72.249.127.135[/C][/ROW]
[/TABLE]
Source: https://freestatistics.org/blog/index.php?pk=98928&T=0

Globally Unique Identifier (entire table): ba.freestatistics.org/blog/index.php?pk=98928&T=0

As an alternative you can also use a QR Code:  

The GUIDs for individual cells are displayed in the table below:

Summary of computational transaction
Raw Inputview raw input (R code)
Raw Outputview raw output of R engine
Computing time6 seconds
R Server'Gwilym Jenkins' @ 72.249.127.135


Multiple Linear Regression - Estimated Regression Equation
Yt[t] = -91.9080275778757 + 0.529691487502998X1t[t] -0.00320282046758429X2t[t] -29.4520792768385X3t[t] + 38.120187685799X4t[t] + e[t]

\begin{tabular}{lllllllll}
\hline
Multiple Linear Regression - Estimated Regression Equation \tabularnewline
Yt[t] =  -91.9080275778757 +  0.529691487502998X1t[t] -0.00320282046758429X2t[t] -29.4520792768385X3t[t] +  38.120187685799X4t[t]  + e[t] \tabularnewline
\hline
\end{tabular}
%Source: https://freestatistics.org/blog/index.php?pk=98928&T=1

[TABLE]
[ROW][C]Multiple Linear Regression - Estimated Regression Equation[/C][/ROW]
[ROW][C]Yt[t] =  -91.9080275778757 +  0.529691487502998X1t[t] -0.00320282046758429X2t[t] -29.4520792768385X3t[t] +  38.120187685799X4t[t]  + e[t][/C][/ROW]
[/TABLE]
Source: https://freestatistics.org/blog/index.php?pk=98928&T=1

Globally Unique Identifier (entire table): ba.freestatistics.org/blog/index.php?pk=98928&T=1

As an alternative you can also use a QR Code:  

The GUIDs for individual cells are displayed in the table below:

Multiple Linear Regression - Estimated Regression Equation
Yt[t] = -91.9080275778757 + 0.529691487502998X1t[t] -0.00320282046758429X2t[t] -29.4520792768385X3t[t] + 38.120187685799X4t[t] + e[t]


Multiple Linear Regression - Ordinary Least Squares
VariableParameterS.D.T-STATH0: parameter = 02-tail p-value1-tail p-value
(Intercept)-91.9080275778757750.240579-0.12250.9032420.451621
X1t0.5296914875029980.5332940.99320.3278190.163909
X2t-0.003202820467584290.011209-0.28570.7768610.38843
X3t-29.452079276838528.448859-1.03530.3080730.154036
X4t38.12018768579937.2460241.02350.313530.156765

\begin{tabular}{lllllllll}
\hline
Multiple Linear Regression - Ordinary Least Squares \tabularnewline
Variable & Parameter & S.D. & T-STATH0: parameter = 0 & 2-tail p-value & 1-tail p-value \tabularnewline
(Intercept) & -91.9080275778757 & 750.240579 & -0.1225 & 0.903242 & 0.451621 \tabularnewline
X1t & 0.529691487502998 & 0.533294 & 0.9932 & 0.327819 & 0.163909 \tabularnewline
X2t & -0.00320282046758429 & 0.011209 & -0.2857 & 0.776861 & 0.38843 \tabularnewline
X3t & -29.4520792768385 & 28.448859 & -1.0353 & 0.308073 & 0.154036 \tabularnewline
X4t & 38.120187685799 & 37.246024 & 1.0235 & 0.31353 & 0.156765 \tabularnewline
\hline
\end{tabular}
%Source: https://freestatistics.org/blog/index.php?pk=98928&T=2

[TABLE]
[ROW][C]Multiple Linear Regression - Ordinary Least Squares[/C][/ROW]
[ROW][C]Variable[/C][C]Parameter[/C][C]S.D.[/C][C]T-STATH0: parameter = 0[/C][C]2-tail p-value[/C][C]1-tail p-value[/C][/ROW]
[ROW][C](Intercept)[/C][C]-91.9080275778757[/C][C]750.240579[/C][C]-0.1225[/C][C]0.903242[/C][C]0.451621[/C][/ROW]
[ROW][C]X1t[/C][C]0.529691487502998[/C][C]0.533294[/C][C]0.9932[/C][C]0.327819[/C][C]0.163909[/C][/ROW]
[ROW][C]X2t[/C][C]-0.00320282046758429[/C][C]0.011209[/C][C]-0.2857[/C][C]0.776861[/C][C]0.38843[/C][/ROW]
[ROW][C]X3t[/C][C]-29.4520792768385[/C][C]28.448859[/C][C]-1.0353[/C][C]0.308073[/C][C]0.154036[/C][/ROW]
[ROW][C]X4t[/C][C]38.120187685799[/C][C]37.246024[/C][C]1.0235[/C][C]0.31353[/C][C]0.156765[/C][/ROW]
[/TABLE]
Source: https://freestatistics.org/blog/index.php?pk=98928&T=2

Globally Unique Identifier (entire table): ba.freestatistics.org/blog/index.php?pk=98928&T=2

As an alternative you can also use a QR Code:  

The GUIDs for individual cells are displayed in the table below:

Multiple Linear Regression - Ordinary Least Squares
VariableParameterS.D.T-STATH0: parameter = 02-tail p-value1-tail p-value
(Intercept)-91.9080275778757750.240579-0.12250.9032420.451621
X1t0.5296914875029980.5332940.99320.3278190.163909
X2t-0.003202820467584290.011209-0.28570.7768610.38843
X3t-29.452079276838528.448859-1.03530.3080730.154036
X4t38.12018768579937.2460241.02350.313530.156765


Multiple Linear Regression - Regression Statistics
Multiple R0.24378174897495
R-squared0.0594295411332856
Adjusted R-squared-0.0545789993354069
F-TEST (value)0.52127271245618
F-TEST (DF numerator)4
F-TEST (DF denominator)33
p-value0.720694215763594
Multiple Linear Regression - Residual Statistics
Residual Standard Deviation312.156639267537
Sum Squared Residuals3215578.3254805

\begin{tabular}{lllllllll}
\hline
Multiple Linear Regression - Regression Statistics \tabularnewline
Multiple R & 0.24378174897495 \tabularnewline
R-squared & 0.0594295411332856 \tabularnewline
Adjusted R-squared & -0.0545789993354069 \tabularnewline
F-TEST (value) & 0.52127271245618 \tabularnewline
F-TEST (DF numerator) & 4 \tabularnewline
F-TEST (DF denominator) & 33 \tabularnewline
p-value & 0.720694215763594 \tabularnewline
Multiple Linear Regression - Residual Statistics \tabularnewline
Residual Standard Deviation & 312.156639267537 \tabularnewline
Sum Squared Residuals & 3215578.3254805 \tabularnewline
\hline
\end{tabular}
%Source: https://freestatistics.org/blog/index.php?pk=98928&T=3

[TABLE]
[ROW][C]Multiple Linear Regression - Regression Statistics[/C][/ROW]
[ROW][C]Multiple R[/C][C]0.24378174897495[/C][/ROW]
[ROW][C]R-squared[/C][C]0.0594295411332856[/C][/ROW]
[ROW][C]Adjusted R-squared[/C][C]-0.0545789993354069[/C][/ROW]
[ROW][C]F-TEST (value)[/C][C]0.52127271245618[/C][/ROW]
[ROW][C]F-TEST (DF numerator)[/C][C]4[/C][/ROW]
[ROW][C]F-TEST (DF denominator)[/C][C]33[/C][/ROW]
[ROW][C]p-value[/C][C]0.720694215763594[/C][/ROW]
[ROW][C]Multiple Linear Regression - Residual Statistics[/C][/ROW]
[ROW][C]Residual Standard Deviation[/C][C]312.156639267537[/C][/ROW]
[ROW][C]Sum Squared Residuals[/C][C]3215578.3254805[/C][/ROW]
[/TABLE]
Source: https://freestatistics.org/blog/index.php?pk=98928&T=3

Globally Unique Identifier (entire table): ba.freestatistics.org/blog/index.php?pk=98928&T=3

As an alternative you can also use a QR Code:  

The GUIDs for individual cells are displayed in the table below:

Multiple Linear Regression - Regression Statistics
Multiple R0.24378174897495
R-squared0.0594295411332856
Adjusted R-squared-0.0545789993354069
F-TEST (value)0.52127271245618
F-TEST (DF numerator)4
F-TEST (DF denominator)33
p-value0.720694215763594
Multiple Linear Regression - Residual Statistics
Residual Standard Deviation312.156639267537
Sum Squared Residuals3215578.3254805


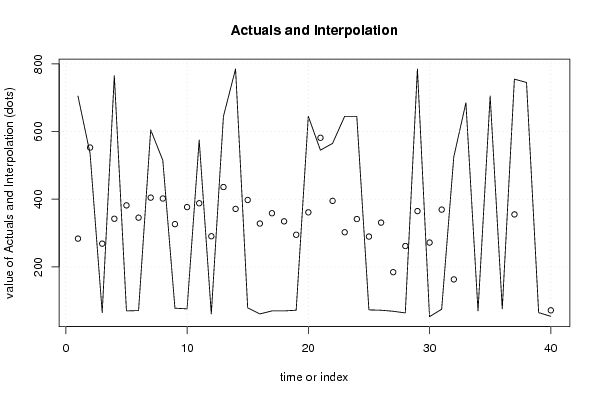
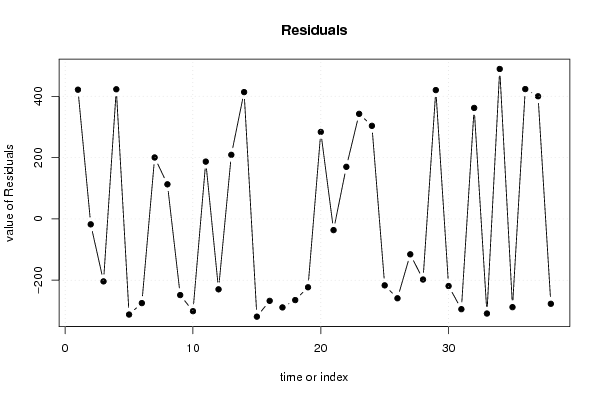
Multiple Linear Regression - Actuals, Interpolation, and Residuals
Time or IndexActualsInterpolationForecastResidualsPrediction Error
1705283.624403261612421.375596738388
2535552.72613334315-17.7261333431495
365268.730254866829-203.730254866829
4765342.266020235977422.733979764023
570381.893145463452-311.893145463452
671345.506017325352-274.506017325352
7605404.698832587429200.301167412571
8515402.160574912002112.839425087998
978326.396602497135-248.396602497135
1076376.815213408504-300.815213408504
11575388.114328530766186.885671469234
1261290.627299530763-229.627299530763
13645435.998896692315209.001103307685
14785371.417567512459413.582432487541
1579397.739664952386-318.739664952386
1661328.162956383073-267.162956383073
1770358.629950463710-288.629950463710
1870334.683436430649-264.683436430649
1972294.944655911377-222.944655911377
20645361.342741455145283.657258544855
21545581.561011538759-36.5610115387589
22565395.149975049424169.850024950576
23645302.415912623459342.584087376541
24645341.465752957172303.534247042828
2573289.695432613867-216.695432613867
2672330.866749263006-258.866749263006
2769184.450714926203-115.450714926203
2864261.668936643654-197.668936643654
29785364.926751202785420.073248797215
3053271.916958478780-218.916958478780
3175369.342708055126-294.342708055126
32525163.113965048644361.886034951356
33685993.555331025642-308.555331025642
3470-419.016349041194489.016349041194
35705992.783561772025-287.783561772025
3676-347.376727201954423.376727201954
37755355.181013231290399.81898676871
387451021.81960604923-276.819606049228
3965NANA
4054NANA

\begin{tabular}{lllllllll}
\hline
Multiple Linear Regression - Actuals, Interpolation, and Residuals \tabularnewline
Time or Index & Actuals & InterpolationForecast & ResidualsPrediction Error \tabularnewline
1 & 705 & 283.624403261612 & 421.375596738388 \tabularnewline
2 & 535 & 552.72613334315 & -17.7261333431495 \tabularnewline
3 & 65 & 268.730254866829 & -203.730254866829 \tabularnewline
4 & 765 & 342.266020235977 & 422.733979764023 \tabularnewline
5 & 70 & 381.893145463452 & -311.893145463452 \tabularnewline
6 & 71 & 345.506017325352 & -274.506017325352 \tabularnewline
7 & 605 & 404.698832587429 & 200.301167412571 \tabularnewline
8 & 515 & 402.160574912002 & 112.839425087998 \tabularnewline
9 & 78 & 326.396602497135 & -248.396602497135 \tabularnewline
10 & 76 & 376.815213408504 & -300.815213408504 \tabularnewline
11 & 575 & 388.114328530766 & 186.885671469234 \tabularnewline
12 & 61 & 290.627299530763 & -229.627299530763 \tabularnewline
13 & 645 & 435.998896692315 & 209.001103307685 \tabularnewline
14 & 785 & 371.417567512459 & 413.582432487541 \tabularnewline
15 & 79 & 397.739664952386 & -318.739664952386 \tabularnewline
16 & 61 & 328.162956383073 & -267.162956383073 \tabularnewline
17 & 70 & 358.629950463710 & -288.629950463710 \tabularnewline
18 & 70 & 334.683436430649 & -264.683436430649 \tabularnewline
19 & 72 & 294.944655911377 & -222.944655911377 \tabularnewline
20 & 645 & 361.342741455145 & 283.657258544855 \tabularnewline
21 & 545 & 581.561011538759 & -36.5610115387589 \tabularnewline
22 & 565 & 395.149975049424 & 169.850024950576 \tabularnewline
23 & 645 & 302.415912623459 & 342.584087376541 \tabularnewline
24 & 645 & 341.465752957172 & 303.534247042828 \tabularnewline
25 & 73 & 289.695432613867 & -216.695432613867 \tabularnewline
26 & 72 & 330.866749263006 & -258.866749263006 \tabularnewline
27 & 69 & 184.450714926203 & -115.450714926203 \tabularnewline
28 & 64 & 261.668936643654 & -197.668936643654 \tabularnewline
29 & 785 & 364.926751202785 & 420.073248797215 \tabularnewline
30 & 53 & 271.916958478780 & -218.916958478780 \tabularnewline
31 & 75 & 369.342708055126 & -294.342708055126 \tabularnewline
32 & 525 & 163.113965048644 & 361.886034951356 \tabularnewline
33 & 685 & 993.555331025642 & -308.555331025642 \tabularnewline
34 & 70 & -419.016349041194 & 489.016349041194 \tabularnewline
35 & 705 & 992.783561772025 & -287.783561772025 \tabularnewline
36 & 76 & -347.376727201954 & 423.376727201954 \tabularnewline
37 & 755 & 355.181013231290 & 399.81898676871 \tabularnewline
38 & 745 & 1021.81960604923 & -276.819606049228 \tabularnewline
39 & 65 & NA & NA \tabularnewline
40 & 54 & NA & NA \tabularnewline
\hline
\end{tabular}
%Source: https://freestatistics.org/blog/index.php?pk=98928&T=4

[TABLE]
[ROW][C]Multiple Linear Regression - Actuals, Interpolation, and Residuals[/C][/ROW]
[ROW][C]Time or Index[/C][C]Actuals[/C][C]InterpolationForecast[/C][C]ResidualsPrediction Error[/C][/ROW]
[ROW][C]1[/C][C]705[/C][C]283.624403261612[/C][C]421.375596738388[/C][/ROW]
[ROW][C]2[/C][C]535[/C][C]552.72613334315[/C][C]-17.7261333431495[/C][/ROW]
[ROW][C]3[/C][C]65[/C][C]268.730254866829[/C][C]-203.730254866829[/C][/ROW]
[ROW][C]4[/C][C]765[/C][C]342.266020235977[/C][C]422.733979764023[/C][/ROW]
[ROW][C]5[/C][C]70[/C][C]381.893145463452[/C][C]-311.893145463452[/C][/ROW]
[ROW][C]6[/C][C]71[/C][C]345.506017325352[/C][C]-274.506017325352[/C][/ROW]
[ROW][C]7[/C][C]605[/C][C]404.698832587429[/C][C]200.301167412571[/C][/ROW]
[ROW][C]8[/C][C]515[/C][C]402.160574912002[/C][C]112.839425087998[/C][/ROW]
[ROW][C]9[/C][C]78[/C][C]326.396602497135[/C][C]-248.396602497135[/C][/ROW]
[ROW][C]10[/C][C]76[/C][C]376.815213408504[/C][C]-300.815213408504[/C][/ROW]
[ROW][C]11[/C][C]575[/C][C]388.114328530766[/C][C]186.885671469234[/C][/ROW]
[ROW][C]12[/C][C]61[/C][C]290.627299530763[/C][C]-229.627299530763[/C][/ROW]
[ROW][C]13[/C][C]645[/C][C]435.998896692315[/C][C]209.001103307685[/C][/ROW]
[ROW][C]14[/C][C]785[/C][C]371.417567512459[/C][C]413.582432487541[/C][/ROW]
[ROW][C]15[/C][C]79[/C][C]397.739664952386[/C][C]-318.739664952386[/C][/ROW]
[ROW][C]16[/C][C]61[/C][C]328.162956383073[/C][C]-267.162956383073[/C][/ROW]
[ROW][C]17[/C][C]70[/C][C]358.629950463710[/C][C]-288.629950463710[/C][/ROW]
[ROW][C]18[/C][C]70[/C][C]334.683436430649[/C][C]-264.683436430649[/C][/ROW]
[ROW][C]19[/C][C]72[/C][C]294.944655911377[/C][C]-222.944655911377[/C][/ROW]
[ROW][C]20[/C][C]645[/C][C]361.342741455145[/C][C]283.657258544855[/C][/ROW]
[ROW][C]21[/C][C]545[/C][C]581.561011538759[/C][C]-36.5610115387589[/C][/ROW]
[ROW][C]22[/C][C]565[/C][C]395.149975049424[/C][C]169.850024950576[/C][/ROW]
[ROW][C]23[/C][C]645[/C][C]302.415912623459[/C][C]342.584087376541[/C][/ROW]
[ROW][C]24[/C][C]645[/C][C]341.465752957172[/C][C]303.534247042828[/C][/ROW]
[ROW][C]25[/C][C]73[/C][C]289.695432613867[/C][C]-216.695432613867[/C][/ROW]
[ROW][C]26[/C][C]72[/C][C]330.866749263006[/C][C]-258.866749263006[/C][/ROW]
[ROW][C]27[/C][C]69[/C][C]184.450714926203[/C][C]-115.450714926203[/C][/ROW]
[ROW][C]28[/C][C]64[/C][C]261.668936643654[/C][C]-197.668936643654[/C][/ROW]
[ROW][C]29[/C][C]785[/C][C]364.926751202785[/C][C]420.073248797215[/C][/ROW]
[ROW][C]30[/C][C]53[/C][C]271.916958478780[/C][C]-218.916958478780[/C][/ROW]
[ROW][C]31[/C][C]75[/C][C]369.342708055126[/C][C]-294.342708055126[/C][/ROW]
[ROW][C]32[/C][C]525[/C][C]163.113965048644[/C][C]361.886034951356[/C][/ROW]
[ROW][C]33[/C][C]685[/C][C]993.555331025642[/C][C]-308.555331025642[/C][/ROW]
[ROW][C]34[/C][C]70[/C][C]-419.016349041194[/C][C]489.016349041194[/C][/ROW]
[ROW][C]35[/C][C]705[/C][C]992.783561772025[/C][C]-287.783561772025[/C][/ROW]
[ROW][C]36[/C][C]76[/C][C]-347.376727201954[/C][C]423.376727201954[/C][/ROW]
[ROW][C]37[/C][C]755[/C][C]355.181013231290[/C][C]399.81898676871[/C][/ROW]
[ROW][C]38[/C][C]745[/C][C]1021.81960604923[/C][C]-276.819606049228[/C][/ROW]
[ROW][C]39[/C][C]65[/C][C]NA[/C][C]NA[/C][/ROW]
[ROW][C]40[/C][C]54[/C][C]NA[/C][C]NA[/C][/ROW]
[/TABLE]
Source: https://freestatistics.org/blog/index.php?pk=98928&T=4

Globally Unique Identifier (entire table): ba.freestatistics.org/blog/index.php?pk=98928&T=4

As an alternative you can also use a QR Code:  

The GUIDs for individual cells are displayed in the table below:

Multiple Linear Regression - Actuals, Interpolation, and Residuals
Time or IndexActualsInterpolationForecastResidualsPrediction Error
1705283.624403261612421.375596738388
2535552.72613334315-17.7261333431495
365268.730254866829-203.730254866829
4765342.266020235977422.733979764023
570381.893145463452-311.893145463452
671345.506017325352-274.506017325352
7605404.698832587429200.301167412571
8515402.160574912002112.839425087998
978326.396602497135-248.396602497135
1076376.815213408504-300.815213408504
11575388.114328530766186.885671469234
1261290.627299530763-229.627299530763
13645435.998896692315209.001103307685
14785371.417567512459413.582432487541
1579397.739664952386-318.739664952386
1661328.162956383073-267.162956383073
1770358.629950463710-288.629950463710
1870334.683436430649-264.683436430649
1972294.944655911377-222.944655911377
20645361.342741455145283.657258544855
21545581.561011538759-36.5610115387589
22565395.149975049424169.850024950576
23645302.415912623459342.584087376541
24645341.465752957172303.534247042828
2573289.695432613867-216.695432613867
2672330.866749263006-258.866749263006
2769184.450714926203-115.450714926203
2864261.668936643654-197.668936643654
29785364.926751202785420.073248797215
3053271.916958478780-218.916958478780
3175369.342708055126-294.342708055126
32525163.113965048644361.886034951356
33685993.555331025642-308.555331025642
3470-419.016349041194489.016349041194
35705992.783561772025-287.783561772025
3676-347.376727201954423.376727201954
37755355.181013231290399.81898676871
387451021.81960604923-276.819606049228
3965NANA
4054NANA


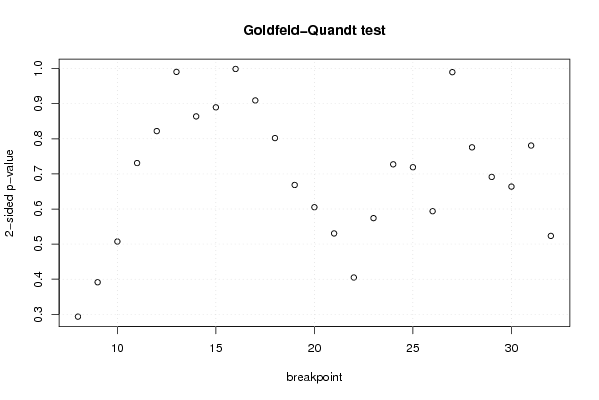
Goldfeld-Quandt test for Heteroskedasticity
p-valuesAlternative Hypothesis
breakpoint indexgreater2-sidedless
80.853295510686090.2934089786278210.146704489313910
90.8043077662626070.3913844674747870.195692233737393
100.7463122119893380.5073755760213240.253687788010662
110.6345721414841750.7308557170316510.365427858515825
120.5890607996628320.8218784006743350.410939200337168
130.5047570201616170.9904859596767660.495242979838383
140.5681178359795430.8637643280409140.431882164020457
150.5552267230639980.8895465538720050.444773276936002
160.4994367300527590.9988734601055190.500563269947241
170.4545861250775310.9091722501550630.545413874922469
180.4010157079607320.8020314159214640.598984292039268
190.3342412823027420.6684825646054850.665758717697257
200.3025337556371660.6050675112743320.697466244362834
210.2652087253865300.5304174507730590.73479127461347
220.2024535893194090.4049071786388180.797546410680591
230.2869811853239850.573962370647970.713018814676015
240.3636281666388340.7272563332776670.636371833361166
250.3594816929691890.7189633859383780.640518307030811
260.2968583065946690.5937166131893380.703141693405331
270.5051300161585560.9897399676828880.494869983841444
280.3878146609327270.7756293218654540.612185339067273
290.3456994136885320.6913988273770630.654300586311468
300.3318921308062950.663784261612590.668107869193705
310.3903664056236010.7807328112472030.609633594376399
320.261706267969140.523412535938280.73829373203086

\begin{tabular}{lllllllll}
\hline
Goldfeld-Quandt test for Heteroskedasticity \tabularnewline
p-values & Alternative Hypothesis \tabularnewline
breakpoint index & greater & 2-sided & less \tabularnewline
8 & 0.85329551068609 & 0.293408978627821 & 0.146704489313910 \tabularnewline
9 & 0.804307766262607 & 0.391384467474787 & 0.195692233737393 \tabularnewline
10 & 0.746312211989338 & 0.507375576021324 & 0.253687788010662 \tabularnewline
11 & 0.634572141484175 & 0.730855717031651 & 0.365427858515825 \tabularnewline
12 & 0.589060799662832 & 0.821878400674335 & 0.410939200337168 \tabularnewline
13 & 0.504757020161617 & 0.990485959676766 & 0.495242979838383 \tabularnewline
14 & 0.568117835979543 & 0.863764328040914 & 0.431882164020457 \tabularnewline
15 & 0.555226723063998 & 0.889546553872005 & 0.444773276936002 \tabularnewline
16 & 0.499436730052759 & 0.998873460105519 & 0.500563269947241 \tabularnewline
17 & 0.454586125077531 & 0.909172250155063 & 0.545413874922469 \tabularnewline
18 & 0.401015707960732 & 0.802031415921464 & 0.598984292039268 \tabularnewline
19 & 0.334241282302742 & 0.668482564605485 & 0.665758717697257 \tabularnewline
20 & 0.302533755637166 & 0.605067511274332 & 0.697466244362834 \tabularnewline
21 & 0.265208725386530 & 0.530417450773059 & 0.73479127461347 \tabularnewline
22 & 0.202453589319409 & 0.404907178638818 & 0.797546410680591 \tabularnewline
23 & 0.286981185323985 & 0.57396237064797 & 0.713018814676015 \tabularnewline
24 & 0.363628166638834 & 0.727256333277667 & 0.636371833361166 \tabularnewline
25 & 0.359481692969189 & 0.718963385938378 & 0.640518307030811 \tabularnewline
26 & 0.296858306594669 & 0.593716613189338 & 0.703141693405331 \tabularnewline
27 & 0.505130016158556 & 0.989739967682888 & 0.494869983841444 \tabularnewline
28 & 0.387814660932727 & 0.775629321865454 & 0.612185339067273 \tabularnewline
29 & 0.345699413688532 & 0.691398827377063 & 0.654300586311468 \tabularnewline
30 & 0.331892130806295 & 0.66378426161259 & 0.668107869193705 \tabularnewline
31 & 0.390366405623601 & 0.780732811247203 & 0.609633594376399 \tabularnewline
32 & 0.26170626796914 & 0.52341253593828 & 0.73829373203086 \tabularnewline
\hline
\end{tabular}
%Source: https://freestatistics.org/blog/index.php?pk=98928&T=5

[TABLE]
[ROW][C]Goldfeld-Quandt test for Heteroskedasticity[/C][/ROW]
[ROW][C]p-values[/C][C]Alternative Hypothesis[/C][/ROW]
[ROW][C]breakpoint index[/C][C]greater[/C][C]2-sided[/C][C]less[/C][/ROW]
[ROW][C]8[/C][C]0.85329551068609[/C][C]0.293408978627821[/C][C]0.146704489313910[/C][/ROW]
[ROW][C]9[/C][C]0.804307766262607[/C][C]0.391384467474787[/C][C]0.195692233737393[/C][/ROW]
[ROW][C]10[/C][C]0.746312211989338[/C][C]0.507375576021324[/C][C]0.253687788010662[/C][/ROW]
[ROW][C]11[/C][C]0.634572141484175[/C][C]0.730855717031651[/C][C]0.365427858515825[/C][/ROW]
[ROW][C]12[/C][C]0.589060799662832[/C][C]0.821878400674335[/C][C]0.410939200337168[/C][/ROW]
[ROW][C]13[/C][C]0.504757020161617[/C][C]0.990485959676766[/C][C]0.495242979838383[/C][/ROW]
[ROW][C]14[/C][C]0.568117835979543[/C][C]0.863764328040914[/C][C]0.431882164020457[/C][/ROW]
[ROW][C]15[/C][C]0.555226723063998[/C][C]0.889546553872005[/C][C]0.444773276936002[/C][/ROW]
[ROW][C]16[/C][C]0.499436730052759[/C][C]0.998873460105519[/C][C]0.500563269947241[/C][/ROW]
[ROW][C]17[/C][C]0.454586125077531[/C][C]0.909172250155063[/C][C]0.545413874922469[/C][/ROW]
[ROW][C]18[/C][C]0.401015707960732[/C][C]0.802031415921464[/C][C]0.598984292039268[/C][/ROW]
[ROW][C]19[/C][C]0.334241282302742[/C][C]0.668482564605485[/C][C]0.665758717697257[/C][/ROW]
[ROW][C]20[/C][C]0.302533755637166[/C][C]0.605067511274332[/C][C]0.697466244362834[/C][/ROW]
[ROW][C]21[/C][C]0.265208725386530[/C][C]0.530417450773059[/C][C]0.73479127461347[/C][/ROW]
[ROW][C]22[/C][C]0.202453589319409[/C][C]0.404907178638818[/C][C]0.797546410680591[/C][/ROW]
[ROW][C]23[/C][C]0.286981185323985[/C][C]0.57396237064797[/C][C]0.713018814676015[/C][/ROW]
[ROW][C]24[/C][C]0.363628166638834[/C][C]0.727256333277667[/C][C]0.636371833361166[/C][/ROW]
[ROW][C]25[/C][C]0.359481692969189[/C][C]0.718963385938378[/C][C]0.640518307030811[/C][/ROW]
[ROW][C]26[/C][C]0.296858306594669[/C][C]0.593716613189338[/C][C]0.703141693405331[/C][/ROW]
[ROW][C]27[/C][C]0.505130016158556[/C][C]0.989739967682888[/C][C]0.494869983841444[/C][/ROW]
[ROW][C]28[/C][C]0.387814660932727[/C][C]0.775629321865454[/C][C]0.612185339067273[/C][/ROW]
[ROW][C]29[/C][C]0.345699413688532[/C][C]0.691398827377063[/C][C]0.654300586311468[/C][/ROW]
[ROW][C]30[/C][C]0.331892130806295[/C][C]0.66378426161259[/C][C]0.668107869193705[/C][/ROW]
[ROW][C]31[/C][C]0.390366405623601[/C][C]0.780732811247203[/C][C]0.609633594376399[/C][/ROW]
[ROW][C]32[/C][C]0.26170626796914[/C][C]0.52341253593828[/C][C]0.73829373203086[/C][/ROW]
[/TABLE]
Source: https://freestatistics.org/blog/index.php?pk=98928&T=5

Globally Unique Identifier (entire table): ba.freestatistics.org/blog/index.php?pk=98928&T=5

As an alternative you can also use a QR Code:  

The GUIDs for individual cells are displayed in the table below:

Goldfeld-Quandt test for Heteroskedasticity
p-valuesAlternative Hypothesis
breakpoint indexgreater2-sidedless
80.853295510686090.2934089786278210.146704489313910
90.8043077662626070.3913844674747870.195692233737393
100.7463122119893380.5073755760213240.253687788010662
110.6345721414841750.7308557170316510.365427858515825
120.5890607996628320.8218784006743350.410939200337168
130.5047570201616170.9904859596767660.495242979838383
140.5681178359795430.8637643280409140.431882164020457
150.5552267230639980.8895465538720050.444773276936002
160.4994367300527590.9988734601055190.500563269947241
170.4545861250775310.9091722501550630.545413874922469
180.4010157079607320.8020314159214640.598984292039268
190.3342412823027420.6684825646054850.665758717697257
200.3025337556371660.6050675112743320.697466244362834
210.2652087253865300.5304174507730590.73479127461347
220.2024535893194090.4049071786388180.797546410680591
230.2869811853239850.573962370647970.713018814676015
240.3636281666388340.7272563332776670.636371833361166
250.3594816929691890.7189633859383780.640518307030811
260.2968583065946690.5937166131893380.703141693405331
270.5051300161585560.9897399676828880.494869983841444
280.3878146609327270.7756293218654540.612185339067273
290.3456994136885320.6913988273770630.654300586311468
300.3318921308062950.663784261612590.668107869193705
310.3903664056236010.7807328112472030.609633594376399
320.261706267969140.523412535938280.73829373203086


Meta Analysis of Goldfeld-Quandt test for Heteroskedasticity
Description# significant tests% significant testsOK/NOK
1% type I error level00OK
5% type I error level00OK
10% type I error level00OK

\begin{tabular}{lllllllll}
\hline
Meta Analysis of Goldfeld-Quandt test for Heteroskedasticity \tabularnewline
Description & # significant tests & % significant tests & OK/NOK \tabularnewline
1% type I error level & 0 & 0 & OK \tabularnewline
5% type I error level & 0 & 0 & OK \tabularnewline
10% type I error level & 0 & 0 & OK \tabularnewline
\hline
\end{tabular}
%Source: https://freestatistics.org/blog/index.php?pk=98928&T=6

[TABLE]
[ROW][C]Meta Analysis of Goldfeld-Quandt test for Heteroskedasticity[/C][/ROW]
[ROW][C]Description[/C][C]# significant tests[/C][C]% significant tests[/C][C]OK/NOK[/C][/ROW]
[ROW][C]1% type I error level[/C][C]0[/C][C]0[/C][C]OK[/C][/ROW]
[ROW][C]5% type I error level[/C][C]0[/C][C]0[/C][C]OK[/C][/ROW]
[ROW][C]10% type I error level[/C][C]0[/C][C]0[/C][C]OK[/C][/ROW]
[/TABLE]
Source: https://freestatistics.org/blog/index.php?pk=98928&T=6

Globally Unique Identifier (entire table): ba.freestatistics.org/blog/index.php?pk=98928&T=6

As an alternative you can also use a QR Code:  

The GUIDs for individual cells are displayed in the table below:

Meta Analysis of Goldfeld-Quandt test for Heteroskedasticity
Description# significant tests% significant testsOK/NOK
1% type I error level00OK
5% type I error level00OK
10% type I error level00OK


Parameters (Session):
par1 = 1 ; par2 = Do not include Seasonal Dummies ; par3 = No Linear Trend ;
Parameters (R input):
par1 = 1 ; par2 = Do not include Seasonal Dummies ; par3 = No Linear Trend ;
R code (references can be found in the software module):
library(lattice)
library(lmtest)
n25 <- 25 #minimum number of obs. for Goldfeld-Quandt test
par1 <- as.numeric(par1)
x <- t(y)
k <- length(x[1,])
n <- length(x[,1])
x1 <- cbind(x[,par1], x[,1:k!=par1])
mycolnames <- c(colnames(x)[par1], colnames(x)[1:k!=par1])
colnames(x1) <- mycolnames #colnames(x)[par1]
x <- x1
if (par3 == 'First Differences'){
x2 <- array(0, dim=c(n-1,k), dimnames=list(1:(n-1), paste('(1-B)',colnames(x),sep='')))
for (i in 1:n-1) {
for (j in 1:k) {
x2[i,j] <- x[i+1,j] - x[i,j]
}
}
x <- x2
}
if (par2 == 'Include Monthly Dummies'){
x2 <- array(0, dim=c(n,11), dimnames=list(1:n, paste('M', seq(1:11), sep ='')))
for (i in 1:11){
x2[seq(i,n,12),i] <- 1
}
x <- cbind(x, x2)
}
if (par2 == 'Include Quarterly Dummies'){
x2 <- array(0, dim=c(n,3), dimnames=list(1:n, paste('Q', seq(1:3), sep ='')))
for (i in 1:3){
x2[seq(i,n,4),i] <- 1
}
x <- cbind(x, x2)
}
k <- length(x[1,])
if (par3 == 'Linear Trend'){
x <- cbind(x, c(1:n))
colnames(x)[k+1] <- 't'
}
x
k <- length(x[1,])
df <- as.data.frame(x)
(mylm <- lm(df))
(mysum <- summary(mylm))
if (n > n25) {
kp3 <- k + 3
nmkm3 <- n - k - 3
gqarr <- array(NA, dim=c(nmkm3-kp3+1,3))
numgqtests <- 0
numsignificant1 <- 0
numsignificant5 <- 0
numsignificant10 <- 0
for (mypoint in kp3:nmkm3) {
j <- 0
numgqtests <- numgqtests + 1
for (myalt in c('greater', 'two.sided', 'less')) {
j <- j + 1
gqarr[mypoint-kp3+1,j] <- gqtest(mylm, point=mypoint, alternative=myalt)$p.value
}
if (gqarr[mypoint-kp3+1,2] < 0.01) numsignificant1 <- numsignificant1 + 1
if (gqarr[mypoint-kp3+1,2] < 0.05) numsignificant5 <- numsignificant5 + 1
if (gqarr[mypoint-kp3+1,2] < 0.10) numsignificant10 <- numsignificant10 + 1
}
gqarr
}
bitmap(file='test0.png')
plot(x[,1], type='l', main='Actuals and Interpolation', ylab='value of Actuals and Interpolation (dots)', xlab='time or index')
points(x[,1]-mysum$resid)
grid()
dev.off()
bitmap(file='test1.png')
plot(mysum$resid, type='b', pch=19, main='Residuals', ylab='value of Residuals', xlab='time or index')
grid()
dev.off()
bitmap(file='test2.png')
hist(mysum$resid, main='Residual Histogram', xlab='values of Residuals')
grid()
dev.off()
bitmap(file='test3.png')
densityplot(~mysum$resid,col='black',main='Residual Density Plot', xlab='values of Residuals')
dev.off()
bitmap(file='test4.png')
qqnorm(mysum$resid, main='Residual Normal Q-Q Plot')
qqline(mysum$resid)
grid()
dev.off()
(myerror <- as.ts(mysum$resid))
bitmap(file='test5.png')
dum <- cbind(lag(myerror,k=1),myerror)
dum
dum1 <- dum[2:length(myerror),]
dum1
z <- as.data.frame(dum1)
z
plot(z,main=paste('Residual Lag plot, lowess, and regression line'), ylab='values of Residuals', xlab='lagged values of Residuals')
lines(lowess(z))
abline(lm(z))
grid()
dev.off()
bitmap(file='test6.png')
acf(mysum$resid, lag.max=length(mysum$resid)/2, main='Residual Autocorrelation Function')
grid()
dev.off()
bitmap(file='test7.png')
pacf(mysum$resid, lag.max=length(mysum$resid)/2, main='Residual Partial Autocorrelation Function')
grid()
dev.off()
bitmap(file='test8.png')
opar <- par(mfrow = c(2,2), oma = c(0, 0, 1.1, 0))
plot(mylm, las = 1, sub='Residual Diagnostics')
par(opar)
dev.off()
if (n > n25) {
bitmap(file='test9.png')
plot(kp3:nmkm3,gqarr[,2], main='Goldfeld-Quandt test',ylab='2-sided p-value',xlab='breakpoint')
grid()
dev.off()
}
load(file='createtable')
a<-table.start()
a<-table.row.start(a)
a<-table.element(a, 'Multiple Linear Regression - Estimated Regression Equation', 1, TRUE)
a<-table.row.end(a)
myeq <- colnames(x)[1]
myeq <- paste(myeq, '[t] = ', sep='')
for (i in 1:k){
if (mysum$coefficients[i,1] > 0) myeq <- paste(myeq, '+', '')
myeq <- paste(myeq, mysum$coefficients[i,1], sep=' ')
if (rownames(mysum$coefficients)[i] != '(Intercept)') {
myeq <- paste(myeq, rownames(mysum$coefficients)[i], sep='')
if (rownames(mysum$coefficients)[i] != 't') myeq <- paste(myeq, '[t]', sep='')
}
}
myeq <- paste(myeq, ' + e[t]')
a<-table.row.start(a)
a<-table.element(a, myeq)
a<-table.row.end(a)
a<-table.end(a)
table.save(a,file='mytable1.tab')
a<-table.start()
a<-table.row.start(a)
a<-table.element(a,hyperlink('ols1.htm','Multiple Linear Regression - Ordinary Least Squares',''), 6, TRUE)
a<-table.row.end(a)
a<-table.row.start(a)
a<-table.element(a,'Variable',header=TRUE)
a<-table.element(a,'Parameter',header=TRUE)
a<-table.element(a,'S.D.',header=TRUE)
a<-table.element(a,'T-STAT
H0: parameter = 0',header=TRUE)
a<-table.element(a,'2-tail p-value',header=TRUE)
a<-table.element(a,'1-tail p-value',header=TRUE)
a<-table.row.end(a)
for (i in 1:k){
a<-table.row.start(a)
a<-table.element(a,rownames(mysum$coefficients)[i],header=TRUE)
a<-table.element(a,mysum$coefficients[i,1])
a<-table.element(a, round(mysum$coefficients[i,2],6))
a<-table.element(a, round(mysum$coefficients[i,3],4))
a<-table.element(a, round(mysum$coefficients[i,4],6))
a<-table.element(a, round(mysum$coefficients[i,4]/2,6))
a<-table.row.end(a)
}
a<-table.end(a)
table.save(a,file='mytable2.tab')
a<-table.start()
a<-table.row.start(a)
a<-table.element(a, 'Multiple Linear Regression - Regression Statistics', 2, TRUE)
a<-table.row.end(a)
a<-table.row.start(a)
a<-table.element(a, 'Multiple R',1,TRUE)
a<-table.element(a, sqrt(mysum$r.squared))
a<-table.row.end(a)
a<-table.row.start(a)
a<-table.element(a, 'R-squared',1,TRUE)
a<-table.element(a, mysum$r.squared)
a<-table.row.end(a)
a<-table.row.start(a)
a<-table.element(a, 'Adjusted R-squared',1,TRUE)
a<-table.element(a, mysum$adj.r.squared)
a<-table.row.end(a)
a<-table.row.start(a)
a<-table.element(a, 'F-TEST (value)',1,TRUE)
a<-table.element(a, mysum$fstatistic[1])
a<-table.row.end(a)
a<-table.row.start(a)
a<-table.element(a, 'F-TEST (DF numerator)',1,TRUE)
a<-table.element(a, mysum$fstatistic[2])
a<-table.row.end(a)
a<-table.row.start(a)
a<-table.element(a, 'F-TEST (DF denominator)',1,TRUE)
a<-table.element(a, mysum$fstatistic[3])
a<-table.row.end(a)
a<-table.row.start(a)
a<-table.element(a, 'p-value',1,TRUE)
a<-table.element(a, 1-pf(mysum$fstatistic[1],mysum$fstatistic[2],mysum$fstatistic[3]))
a<-table.row.end(a)
a<-table.row.start(a)
a<-table.element(a, 'Multiple Linear Regression - Residual Statistics', 2, TRUE)
a<-table.row.end(a)
a<-table.row.start(a)
a<-table.element(a, 'Residual Standard Deviation',1,TRUE)
a<-table.element(a, mysum$sigma)
a<-table.row.end(a)
a<-table.row.start(a)
a<-table.element(a, 'Sum Squared Residuals',1,TRUE)
a<-table.element(a, sum(myerror*myerror))
a<-table.row.end(a)
a<-table.end(a)
table.save(a,file='mytable3.tab')
a<-table.start()
a<-table.row.start(a)
a<-table.element(a, 'Multiple Linear Regression - Actuals, Interpolation, and Residuals', 4, TRUE)
a<-table.row.end(a)
a<-table.row.start(a)
a<-table.element(a, 'Time or Index', 1, TRUE)
a<-table.element(a, 'Actuals', 1, TRUE)
a<-table.element(a, 'Interpolation
Forecast', 1, TRUE)
a<-table.element(a, 'Residuals
Prediction Error', 1, TRUE)
a<-table.row.end(a)
for (i in 1:n) {
a<-table.row.start(a)
a<-table.element(a,i, 1, TRUE)
a<-table.element(a,x[i])
a<-table.element(a,x[i]-mysum$resid[i])
a<-table.element(a,mysum$resid[i])
a<-table.row.end(a)
}
a<-table.end(a)
table.save(a,file='mytable4.tab')
if (n > n25) {
a<-table.start()
a<-table.row.start(a)
a<-table.element(a,'Goldfeld-Quandt test for Heteroskedasticity',4,TRUE)
a<-table.row.end(a)
a<-table.row.start(a)
a<-table.element(a,'p-values',header=TRUE)
a<-table.element(a,'Alternative Hypothesis',3,header=TRUE)
a<-table.row.end(a)
a<-table.row.start(a)
a<-table.element(a,'breakpoint index',header=TRUE)
a<-table.element(a,'greater',header=TRUE)
a<-table.element(a,'2-sided',header=TRUE)
a<-table.element(a,'less',header=TRUE)
a<-table.row.end(a)
for (mypoint in kp3:nmkm3) {
a<-table.row.start(a)
a<-table.element(a,mypoint,header=TRUE)
a<-table.element(a,gqarr[mypoint-kp3+1,1])
a<-table.element(a,gqarr[mypoint-kp3+1,2])
a<-table.element(a,gqarr[mypoint-kp3+1,3])
a<-table.row.end(a)
}
a<-table.end(a)
table.save(a,file='mytable5.tab')
a<-table.start()
a<-table.row.start(a)
a<-table.element(a,'Meta Analysis of Goldfeld-Quandt test for Heteroskedasticity',4,TRUE)
a<-table.row.end(a)
a<-table.row.start(a)
a<-table.element(a,'Description',header=TRUE)
a<-table.element(a,'# significant tests',header=TRUE)
a<-table.element(a,'% significant tests',header=TRUE)
a<-table.element(a,'OK/NOK',header=TRUE)
a<-table.row.end(a)
a<-table.row.start(a)
a<-table.element(a,'1% type I error level',header=TRUE)
a<-table.element(a,numsignificant1)
a<-table.element(a,numsignificant1/numgqtests)
if (numsignificant1/numgqtests < 0.01) dum <- 'OK' else dum <- 'NOK'
a<-table.element(a,dum)
a<-table.row.end(a)
a<-table.row.start(a)
a<-table.element(a,'5% type I error level',header=TRUE)
a<-table.element(a,numsignificant5)
a<-table.element(a,numsignificant5/numgqtests)
if (numsignificant5/numgqtests < 0.05) dum <- 'OK' else dum <- 'NOK'
a<-table.element(a,dum)
a<-table.row.end(a)
a<-table.row.start(a)
a<-table.element(a,'10% type I error level',header=TRUE)
a<-table.element(a,numsignificant10)
a<-table.element(a,numsignificant10/numgqtests)
if (numsignificant10/numgqtests < 0.1) dum <- 'OK' else dum <- 'NOK'
a<-table.element(a,dum)
a<-table.row.end(a)
a<-table.end(a)
table.save(a,file='mytable6.tab')
}