| Multiple Linear Regression - Estimated Regression Equation |
| Invoer[t] = + 1840687.45143576 + 0.905502755008777Uitvoer[t] + e[t] |
| Multiple Linear Regression - Ordinary Least Squares | |||||
| Variable | Parameter | S.D. | T-STAT H0: parameter = 0 | 2-tail p-value | 1-tail p-value |
| (Intercept) | 1840687.45143576 | 822921.763846 | 2.2368 | 0.029161 | 0.01458 |
| Uitvoer | 0.905502755008777 | 0.047639 | 19.0076 | 0 | 0 |
| Multiple Linear Regression - Regression Statistics | |
| Multiple R | 0.92826203881921 |
| R-squared | 0.861670412712797 |
| Adjusted R-squared | 0.859285419828535 |
| F-TEST (value) | 361.288462703060 |
| F-TEST (DF numerator) | 1 |
| F-TEST (DF denominator) | 58 |
| p-value | 0 |
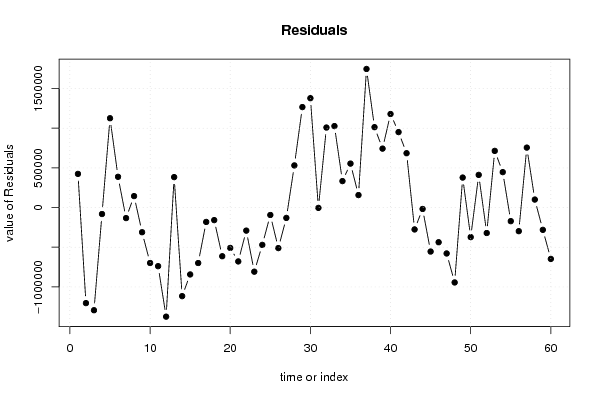
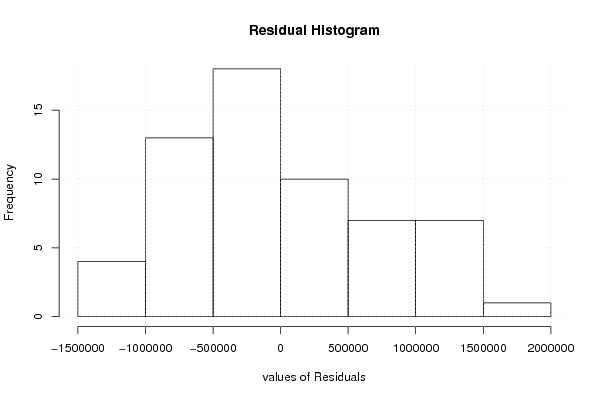
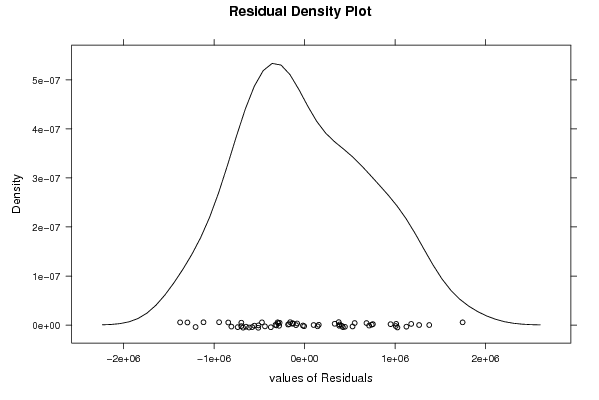
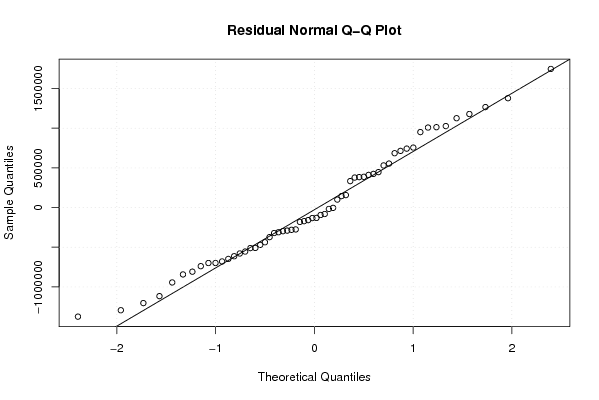
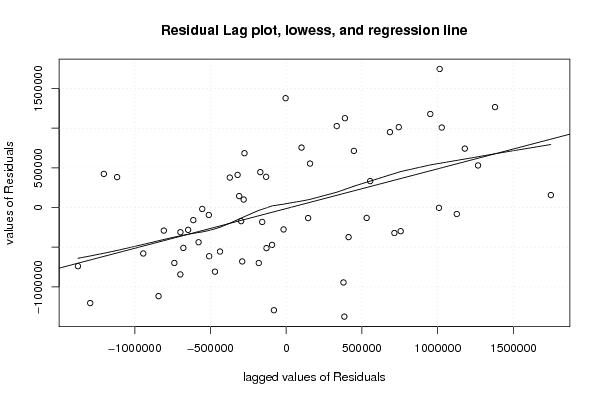
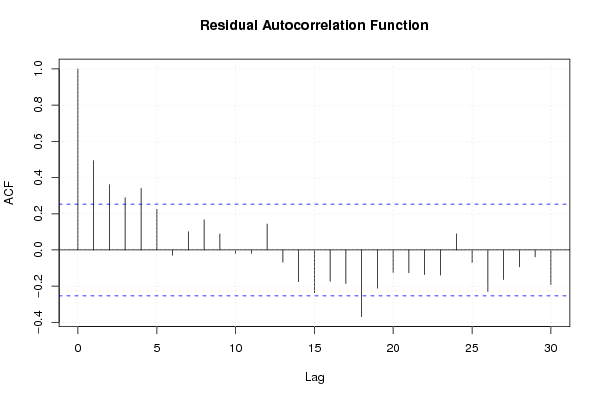
| Multiple Linear Regression - Residual Statistics | |
| Residual Standard Deviation | 727953.374739135 |
| Sum Squared Residuals | 30735134716057.5 |
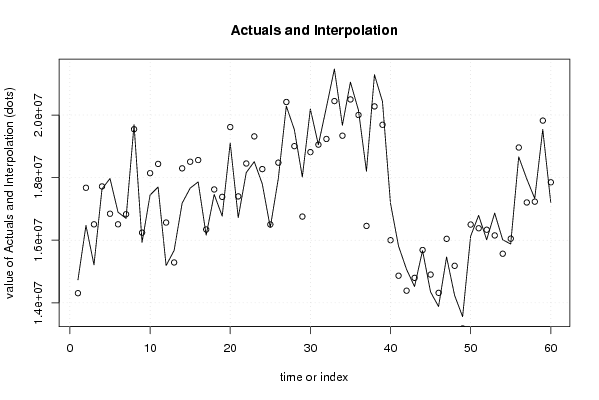
| Multiple Linear Regression - Actuals, Interpolation, and Residuals | |||
| Time or Index | Actuals | Interpolation Forecast | Residuals Prediction Error |
| 1 | 14731798.37 | 14307685.7292772 | 424112.640722816 |
| 2 | 16471559.62 | 17675694.6514213 | -1204135.03142125 |
| 3 | 15213975.95 | 16508117.1780753 | -1294141.22807532 |
| 4 | 17637387.4 | 17718828.9180630 | -81441.5180630424 |
| 5 | 17972385.83 | 16846472.2906120 | 1125913.53938803 |
| 6 | 16896235.55 | 16508829.3922122 | 387406.157787759 |
| 7 | 16697955.94 | 16830595.5041216 | -132639.564121553 |
| 8 | 19691579.52 | 19547048.0263983 | 144531.493601713 |
| 9 | 15930700.75 | 16241588.0562556 | -310887.306255565 |
| 10 | 17444615.98 | 18143161.3360872 | -698545.356087222 |
| 11 | 17699369.88 | 18438200.1487632 | -738830.268763235 |
| 12 | 15189796.81 | 16564826.3617091 | -1375029.55170905 |
| 13 | 15672722.75 | 15289168.3692862 | 383554.380713841 |
| 14 | 17180794.3 | 18297356.4935738 | -1116562.19357383 |
| 15 | 17664893.45 | 18507871.2059137 | -842977.755913708 |
| 16 | 17862884.98 | 18562117.3315035 | -699232.351503542 |
| 17 | 16162288.88 | 16343694.6024016 | -181405.722401607 |
| 18 | 17463628.82 | 17622204.4757514 | -158575.655751400 |
| 19 | 16772112.17 | 17385626.5780088 | -613514.408008799 |
| 20 | 19106861.48 | 19615695.3040239 | -508833.824023891 |
| 21 | 16721314.25 | 17400510.8610395 | -679196.611039503 |
| 22 | 18161267.85 | 18451825.6743041 | -290557.824304146 |
| 23 | 18509941.2 | 19318195.1899793 | -808253.989979325 |
| 24 | 17802737.97 | 18273265.8100975 | -470527.840097479 |
| 25 | 16409869.75 | 16503411.3617528 | -93541.6117527855 |
| 26 | 17967742.04 | 18478775.9264258 | -511033.886425786 |
| 27 | 20286602.27 | 20417250.2816946 | -130648.011694643 |
| 28 | 19537280.81 | 19006499.8533355 | 530780.956664467 |
| 29 | 18021889.62 | 16755702.8200592 | 1266186.79994082 |
| 30 | 20194317.23 | 18815978.5150559 | 1378338.71494414 |
| 31 | 19049596.62 | 19053800.0483922 | -4203.4283922442 |
| 32 | 20244720.94 | 19236462.5554263 | 1008258.38457372 |
| 33 | 21473302.24 | 20446644.5310272 | 1026657.70897281 |
| 34 | 19673603.19 | 19340210.9682227 | 333392.221777266 |
| 35 | 21053177.29 | 20499063.0260764 | 554114.263923579 |
| 36 | 20159479.84 | 20002279.2952428 | 157200.544757212 |
| 37 | 18203628.31 | 16456814.6427314 | 1746813.66726859 |
| 38 | 21289464.94 | 20276536.3035548 | 1012928.63644522 |
| 39 | 20432335.71 | 19689553.2429230 | 742782.467076975 |
| 40 | 17180395.07 | 16001465.3597128 | 1178929.71028715 |
| 41 | 15816786.32 | 14865879.1538209 | 950907.16617906 |
| 42 | 15071819.75 | 14386986.0204398 | 684833.729560221 |
| 43 | 14521120.61 | 14796925.5355583 | -275804.925558291 |
| 44 | 15668789.39 | 15686387.2911520 | -17597.9011520303 |
| 45 | 14346884.11 | 14901437.8214238 | -554553.71142384 |
| 46 | 13881008.13 | 14318227.0037742 | -437218.873774207 |
| 47 | 15465943.69 | 16044719.6326348 | -578775.942634767 |
| 48 | 14238232.92 | 15182209.4511967 | -943976.531196686 |
| 49 | 13557713.21 | 13179843.8356975 | 377869.374302509 |
| 50 | 16127590.29 | 16500218.8759646 | -372628.585964589 |
| 51 | 16793894.2 | 16382267.7973363 | 411626.402663736 |
| 52 | 16014007.43 | 16335181.6631308 | -321174.233130834 |
| 53 | 16867867.15 | 16153826.7292401 | 714040.420759884 |
| 54 | 16014583.21 | 15568064.9654492 | 446518.244550820 |
| 55 | 15878594.85 | 16049967.2293657 | -171372.379365677 |
| 56 | 18664899.14 | 18962720.5246411 | -297821.384641119 |
| 57 | 17962530.06 | 17206961.8294180 | 755568.230581982 |
| 58 | 17332692.2 | 17231950.4094262 | 100741.790573769 |
| 59 | 19542066.35 | 19822954.0638875 | -280887.713887473 |
| 60 | 17203555.19 | 17851035.7159297 | -647480.525929652 |
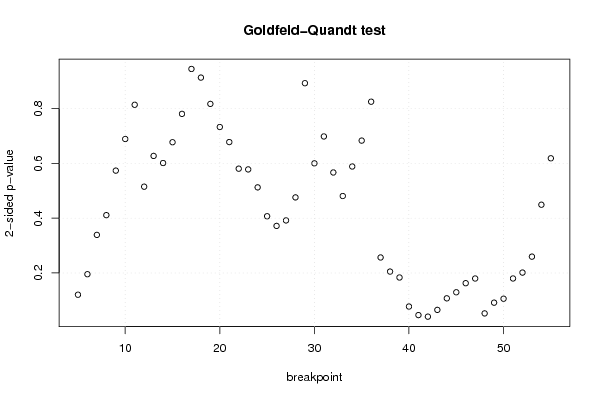
| Goldfeld-Quandt test for Heteroskedasticity | |||
| p-values | Alternative Hypothesis | ||
| breakpoint index | greater | 2-sided | less |
| 5 | 0.93971569595487 | 0.120568608090259 | 0.0602843040451295 |
| 6 | 0.902251991028378 | 0.195496017943245 | 0.0977480089716224 |
| 7 | 0.830512542960936 | 0.338974914078127 | 0.169487457039064 |
| 8 | 0.794485105839819 | 0.411029788320363 | 0.205514894160181 |
| 9 | 0.713235593850829 | 0.573528812298342 | 0.286764406149171 |
| 10 | 0.655505488861211 | 0.688989022277577 | 0.344494511138789 |
| 11 | 0.593082450867116 | 0.813835098265768 | 0.406917549132884 |
| 12 | 0.742534791503924 | 0.514930416992151 | 0.257465208496076 |
| 13 | 0.686417599110339 | 0.627164801779322 | 0.313582400889661 |
| 14 | 0.699361378094633 | 0.601277243810733 | 0.300638621905367 |
| 15 | 0.661405397376594 | 0.677189205246812 | 0.338594602623406 |
| 16 | 0.609691101352668 | 0.780617797294663 | 0.390308898647332 |
| 17 | 0.527698547279297 | 0.944602905441406 | 0.472301452720703 |
| 18 | 0.456533772604555 | 0.91306754520911 | 0.543466227395445 |
| 19 | 0.408532873168605 | 0.81706574633721 | 0.591467126831395 |
| 20 | 0.366351531161413 | 0.732703062322826 | 0.633648468838587 |
| 21 | 0.338867150399734 | 0.677734300799468 | 0.661132849600266 |
| 22 | 0.290306265266983 | 0.580612530533965 | 0.709693734733017 |
| 23 | 0.288964700686768 | 0.577929401373537 | 0.711035299313232 |
| 24 | 0.256190208553536 | 0.512380417107071 | 0.743809791446465 |
| 25 | 0.203495661627798 | 0.406991323255596 | 0.796504338372202 |
| 26 | 0.185895464187861 | 0.371790928375723 | 0.814104535812139 |
| 27 | 0.195868916903932 | 0.391737833807865 | 0.804131083096068 |
| 28 | 0.237917997047005 | 0.475835994094010 | 0.762082002952995 |
| 29 | 0.446297542697191 | 0.892595085394382 | 0.553702457302809 |
| 30 | 0.699956892973355 | 0.60008621405329 | 0.300043107026645 |
| 31 | 0.650885422705684 | 0.698229154588633 | 0.349114577294316 |
| 32 | 0.716610702769206 | 0.566778594461587 | 0.283389297230794 |
| 33 | 0.75959976759998 | 0.480800464800041 | 0.240400232400020 |
| 34 | 0.70570809403793 | 0.58858381192414 | 0.29429190596207 |
| 35 | 0.658452148377835 | 0.683095703244331 | 0.341547851622165 |
| 36 | 0.587462037912933 | 0.825075924174133 | 0.412537962087067 |
| 37 | 0.871729026598817 | 0.256541946802365 | 0.128270973401183 |
| 38 | 0.897445902514425 | 0.205108194971149 | 0.102554097485574 |
| 39 | 0.908238610724834 | 0.183522778550331 | 0.0917613892751657 |
| 40 | 0.961269059016168 | 0.0774618819676634 | 0.0387309409838317 |
| 41 | 0.976880786722956 | 0.0462384265540883 | 0.0231192132770441 |
| 42 | 0.97972118507264 | 0.0405576298547211 | 0.0202788149273606 |
| 43 | 0.967359566703972 | 0.0652808665920566 | 0.0326404332960283 |
| 44 | 0.946271373726713 | 0.107457252546575 | 0.0537286262732874 |
| 45 | 0.935238640888294 | 0.129522718223412 | 0.064761359111706 |
| 46 | 0.918653237304903 | 0.162693525390194 | 0.081346762695097 |
| 47 | 0.91010365762374 | 0.179792684752519 | 0.0898963423762593 |
| 48 | 0.973775540772444 | 0.052448918455113 | 0.0262244592275565 |
| 49 | 0.95419957601197 | 0.0916008479760598 | 0.0458004239880299 |
| 50 | 0.946979780752776 | 0.106040438494449 | 0.0530202192472244 |
| 51 | 0.910024761136154 | 0.179950477727693 | 0.0899752388638464 |
| 52 | 0.899295412437805 | 0.20140917512439 | 0.100704587562195 |
| 53 | 0.870212627805282 | 0.259574744389436 | 0.129787372194718 |
| 54 | 0.77546577790189 | 0.44906844419622 | 0.22453422209811 |
| 55 | 0.690745837840894 | 0.618508324318211 | 0.309254162159106 |
| Meta Analysis of Goldfeld-Quandt test for Heteroskedasticity | |||
| Description | # significant tests | % significant tests | OK/NOK |
| 1% type I error level | 0 | 0 | OK |
| 5% type I error level | 2 | 0.0392156862745098 | OK |
| 10% type I error level | 6 | 0.117647058823529 | NOK |