| Multiple Linear Regression - Estimated Regression Equation |
| eu/us[t] = + 2.81747388264865 -1.31118267745398`us/ch`[t] + e[t] |
| Multiple Linear Regression - Ordinary Least Squares | |||||
| Variable | Parameter | S.D. | T-STAT H0: parameter = 0 | 2-tail p-value | 1-tail p-value |
| (Intercept) | 2.81747388264865 | 0.039141 | 71.9828 | 0 | 0 |
| `us/ch` | -1.31118267745398 | 0.03603 | -36.3916 | 0 | 0 |
| Multiple Linear Regression - Regression Statistics | |
| Multiple R | 0.981284059913598 |
| R-squared | 0.962918406240514 |
| Adjusted R-squared | 0.962191316166798 |
| F-TEST (value) | 1324.34541613258 |
| F-TEST (DF numerator) | 1 |
| F-TEST (DF denominator) | 51 |
| p-value | 0 |
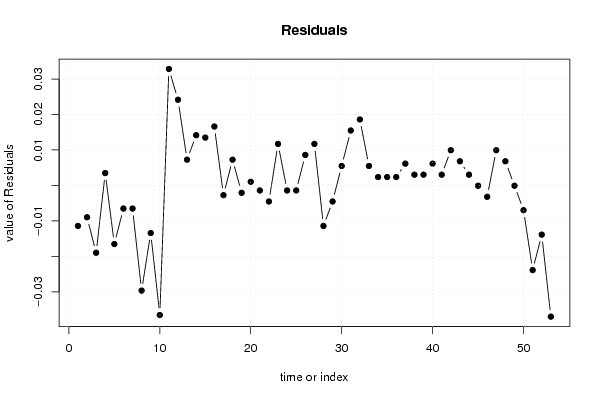
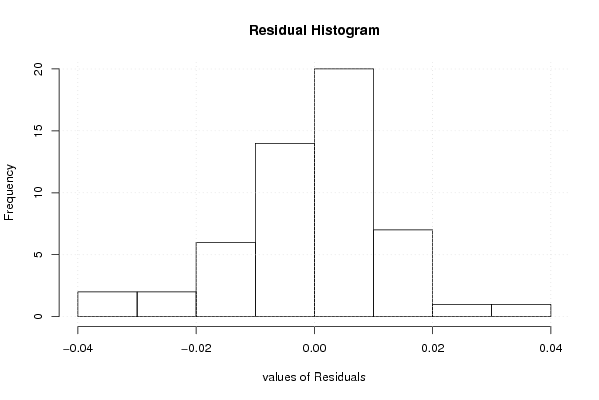
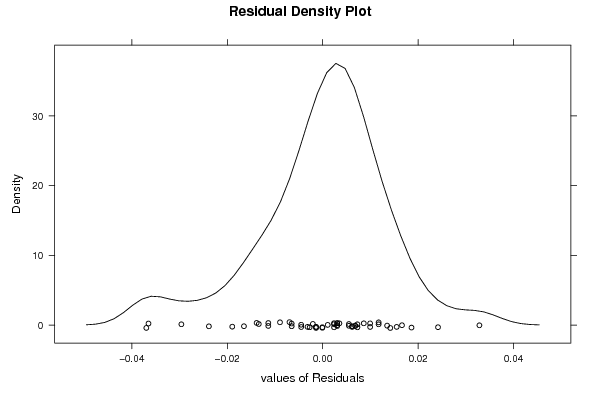
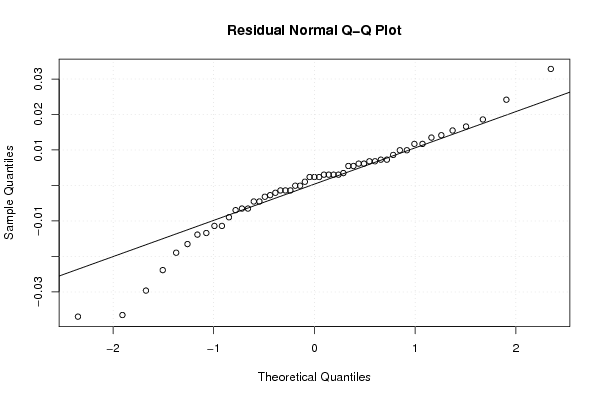
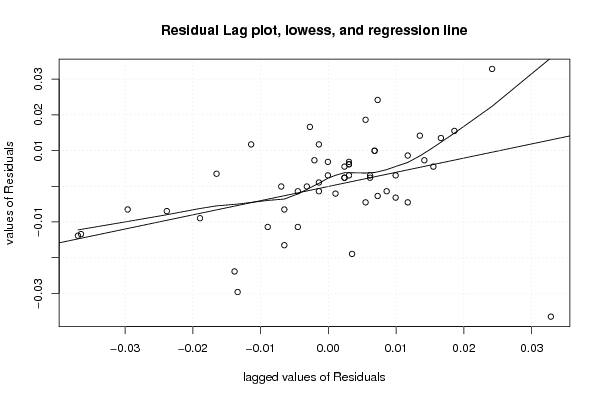
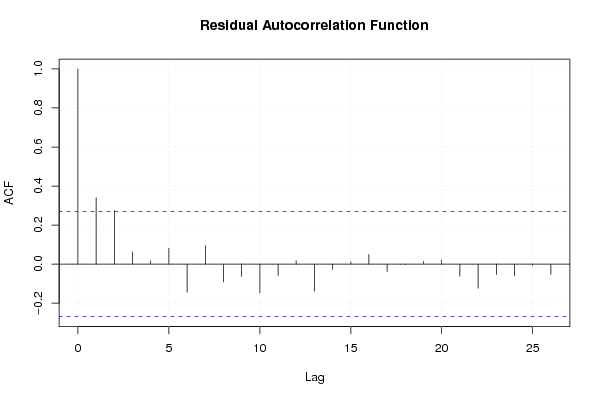
| Multiple Linear Regression - Residual Statistics | |
| Residual Standard Deviation | 0.0136782808318764 |
| Sum Squared Residuals | 0.00954186369229955 |
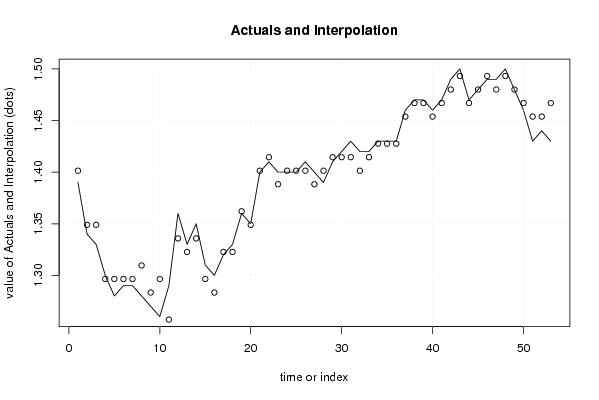
| Multiple Linear Regression - Actuals, Interpolation, and Residuals | |||
| Time or Index | Actuals | Interpolation Forecast | Residuals Prediction Error |
| 1 | 1.39 | 1.40139659099835 | -0.0113965909983464 |
| 2 | 1.34 | 1.34894928390019 | -0.008949283900191 |
| 3 | 1.33 | 1.34894928390019 | -0.0189492839001910 |
| 4 | 1.3 | 1.29650197680203 | 0.00349802319796813 |
| 5 | 1.28 | 1.29650197680203 | -0.0165019768020319 |
| 6 | 1.29 | 1.29650197680203 | -0.00650197680203188 |
| 7 | 1.29 | 1.29650197680203 | -0.00650197680203188 |
| 8 | 1.28 | 1.30961380357657 | -0.0296138035765717 |
| 9 | 1.27 | 1.28339015002749 | -0.0133901500274921 |
| 10 | 1.26 | 1.29650197680203 | -0.0365019768020319 |
| 11 | 1.29 | 1.25716649647841 | 0.0328335035215877 |
| 12 | 1.36 | 1.33583745712565 | 0.0241625428743486 |
| 13 | 1.33 | 1.32272563035111 | 0.00727436964888843 |
| 14 | 1.35 | 1.33583745712565 | 0.0141625428743486 |
| 15 | 1.31 | 1.29650197680203 | 0.0134980231979681 |
| 16 | 1.3 | 1.28339015002749 | 0.0166098499725080 |
| 17 | 1.32 | 1.32272563035111 | -0.00272563035111158 |
| 18 | 1.33 | 1.32272563035111 | 0.00727436964888843 |
| 19 | 1.36 | 1.36206111067473 | -0.00206111067473081 |
| 20 | 1.35 | 1.34894928390019 | 0.00105071609980903 |
| 21 | 1.4 | 1.40139659099835 | -0.00139659099835056 |
| 22 | 1.41 | 1.41450841777289 | -0.00450841777289041 |
| 23 | 1.4 | 1.38828476422381 | 0.0117152357761893 |
| 24 | 1.4 | 1.40139659099835 | -0.00139659099835056 |
| 25 | 1.4 | 1.40139659099835 | -0.00139659099835056 |
| 26 | 1.41 | 1.40139659099835 | 0.00860340900164945 |
| 27 | 1.4 | 1.38828476422381 | 0.0117152357761893 |
| 28 | 1.39 | 1.40139659099835 | -0.0113965909983506 |
| 29 | 1.41 | 1.41450841777289 | -0.00450841777289041 |
| 30 | 1.42 | 1.41450841777289 | 0.0054915822271096 |
| 31 | 1.43 | 1.41450841777289 | 0.0154915822271096 |
| 32 | 1.42 | 1.40139659099835 | 0.0186034090016495 |
| 33 | 1.42 | 1.41450841777289 | 0.0054915822271096 |
| 34 | 1.43 | 1.42762024454743 | 0.00237975545256975 |
| 35 | 1.43 | 1.42762024454743 | 0.00237975545256975 |
| 36 | 1.43 | 1.42762024454743 | 0.00237975545256975 |
| 37 | 1.46 | 1.45384389809651 | 0.00615610190349007 |
| 38 | 1.47 | 1.46695572487105 | 0.00304427512895021 |
| 39 | 1.47 | 1.46695572487105 | 0.00304427512895021 |
| 40 | 1.46 | 1.45384389809651 | 0.00615610190349007 |
| 41 | 1.47 | 1.46695572487105 | 0.00304427512895021 |
| 42 | 1.49 | 1.48006755164559 | 0.00993244835441039 |
| 43 | 1.5 | 1.49317937842013 | 0.00682062157987055 |
| 44 | 1.47 | 1.46695572487105 | 0.00304427512895021 |
| 45 | 1.48 | 1.48006755164559 | -6.75516455896238e-05 |
| 46 | 1.49 | 1.49317937842013 | -0.00317937842012946 |
| 47 | 1.49 | 1.48006755164559 | 0.00993244835441039 |
| 48 | 1.5 | 1.49317937842013 | 0.00682062157987055 |
| 49 | 1.48 | 1.48006755164559 | -6.75516455896238e-05 |
| 50 | 1.46 | 1.46695572487105 | -0.0069557248710498 |
| 51 | 1.43 | 1.45384389809651 | -0.0238438980965100 |
| 52 | 1.44 | 1.45384389809651 | -0.0138438980965099 |
| 53 | 1.43 | 1.46695572487105 | -0.0369557248710498 |
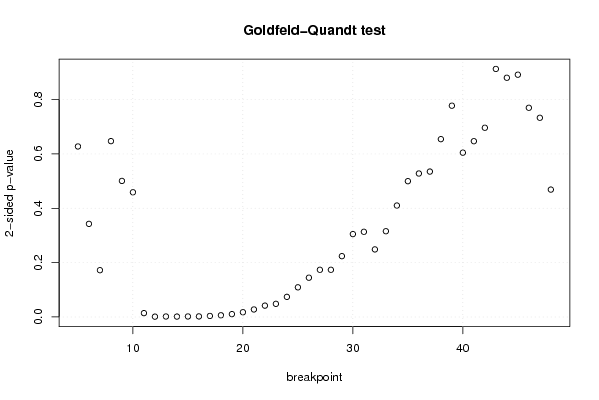
| Goldfeld-Quandt test for Heteroskedasticity | |||
| p-values | Alternative Hypothesis | ||
| breakpoint index | greater | 2-sided | less |
| 5 | 0.313746225999553 | 0.627492451999106 | 0.686253774000447 |
| 6 | 0.171315934096949 | 0.342631868193897 | 0.828684065903051 |
| 7 | 0.0861208821893242 | 0.172241764378648 | 0.913879117810676 |
| 8 | 0.323557837045587 | 0.647115674091173 | 0.676442162954413 |
| 9 | 0.250287600178877 | 0.500575200357754 | 0.749712399821123 |
| 10 | 0.770540113343542 | 0.458919773312915 | 0.229459886656458 |
| 11 | 0.99286726981463 | 0.0142654603707388 | 0.00713273018536942 |
| 12 | 0.999377884814268 | 0.00124423037146334 | 0.000622115185731669 |
| 13 | 0.999106550553382 | 0.00178689889323586 | 0.000893449446617928 |
| 14 | 0.999241171114927 | 0.00151765777014608 | 0.000758828885073039 |
| 15 | 0.999027748391961 | 0.00194450321607752 | 0.000972251608038762 |
| 16 | 0.998932287373444 | 0.00213542525311212 | 0.00106771262655606 |
| 17 | 0.998095215270129 | 0.00380956945974258 | 0.00190478472987129 |
| 18 | 0.996853023402968 | 0.00629395319406446 | 0.00314697659703223 |
| 19 | 0.9947004238804 | 0.0105991522392001 | 0.00529957611960006 |
| 20 | 0.991219366892004 | 0.0175612662159911 | 0.00878063310799553 |
| 21 | 0.986140138887108 | 0.0277197222257835 | 0.0138598611128917 |
| 22 | 0.979106094989216 | 0.0417878100215682 | 0.0208939050107841 |
| 23 | 0.97582740015438 | 0.048345199691239 | 0.0241725998456195 |
| 24 | 0.962979384696863 | 0.0740412306062742 | 0.0370206153031371 |
| 25 | 0.945407859700664 | 0.109184280598672 | 0.0545921402993361 |
| 26 | 0.927741832422426 | 0.144516335155148 | 0.0722581675775742 |
| 27 | 0.91317636560864 | 0.173647268782719 | 0.0868236343913595 |
| 28 | 0.9131423906896 | 0.173715218620799 | 0.0868576093103997 |
| 29 | 0.888092116677861 | 0.223815766644278 | 0.111907883322139 |
| 30 | 0.847476785926414 | 0.305046428147173 | 0.152523214073586 |
| 31 | 0.843273341621624 | 0.313453316756752 | 0.156726658378376 |
| 32 | 0.87567110067609 | 0.248657798647822 | 0.124328899323911 |
| 33 | 0.84223770201654 | 0.31552459596692 | 0.15776229798346 |
| 34 | 0.794987995870136 | 0.410024008259729 | 0.205012004129864 |
| 35 | 0.750126923054113 | 0.499746153891774 | 0.249873076945887 |
| 36 | 0.736044946847992 | 0.527910106304015 | 0.263955053152008 |
| 37 | 0.732474096266359 | 0.535051807467281 | 0.267525903733641 |
| 38 | 0.672850581656471 | 0.654298836687058 | 0.327149418343529 |
| 39 | 0.611288518268456 | 0.777422963463088 | 0.388711481731544 |
| 40 | 0.697699373021766 | 0.604601253956468 | 0.302300626978234 |
| 41 | 0.676607795578726 | 0.646784408842547 | 0.323392204421274 |
| 42 | 0.651887027883729 | 0.696225944232542 | 0.348112972116271 |
| 43 | 0.543684817525358 | 0.912630364949285 | 0.456315182474642 |
| 44 | 0.559887307457068 | 0.880225385085864 | 0.440112692542932 |
| 45 | 0.445737403924325 | 0.891474807848651 | 0.554262596075675 |
| 46 | 0.38487677793764 | 0.76975355587528 | 0.61512322206236 |
| 47 | 0.36648118615386 | 0.73296237230772 | 0.63351881384614 |
| 48 | 0.234382347510309 | 0.468764695020617 | 0.765617652489691 |
| Meta Analysis of Goldfeld-Quandt test for Heteroskedasticity | |||
| Description | # significant tests | % significant tests | OK/NOK |
| 1% type I error level | 7 | 0.159090909090909 | NOK |
| 5% type I error level | 13 | 0.295454545454545 | NOK |
| 10% type I error level | 14 | 0.318181818181818 | NOK |