| Multiple Linear Regression - Estimated Regression Equation |
| Y[t] = + 96.9593479050537 -0.353104493599339X[t] + 78.2367269043976M1[t] + 65.5045507310806M2[t] + 80.0304820791604M3[t] + 68.2989565870068M4[t] + 48.9024598680309M5[t] + 54.1156516904293M6[t] + 32.8436739015588M7[t] + 20.6493513373682M8[t] + 28.2559611305234M9[t] + 44.9505653708961M10[t] + 25.0197460877297M11[t] + e[t] |
| Multiple Linear Regression - Ordinary Least Squares | |||||
| Variable | Parameter | S.D. | T-STAT H0: parameter = 0 | 2-tail p-value | 1-tail p-value |
| (Intercept) | 96.9593479050537 | 74.908481 | 1.2944 | 0.201861 | 0.100931 |
| X | -0.353104493599339 | 0.680962 | -0.5185 | 0.606516 | 0.303258 |
| M1 | 78.2367269043976 | 6.12216 | 12.7793 | 0 | 0 |
| M2 | 65.5045507310806 | 6.09107 | 10.7542 | 0 | 0 |
| M3 | 80.0304820791604 | 6.072771 | 13.1786 | 0 | 0 |
| M4 | 68.2989565870068 | 6.071602 | 11.2489 | 0 | 0 |
| M5 | 48.9024598680309 | 6.080223 | 8.0429 | 0 | 0 |
| M6 | 54.1156516904293 | 6.074923 | 8.908 | 0 | 0 |
| M7 | 32.8436739015588 | 6.068442 | 5.4122 | 2e-06 | 1e-06 |
| M8 | 20.6493513373682 | 6.061858 | 3.4064 | 0.001357 | 0.000679 |
| M9 | 28.2559611305234 | 6.058787 | 4.6636 | 2.6e-05 | 1.3e-05 |
| M10 | 44.9505653708961 | 6.057369 | 7.4208 | 0 | 0 |
| M11 | 25.0197460877297 | 6.057117 | 4.1306 | 0.000147 | 7.4e-05 |
| Multiple Linear Regression - Regression Statistics | |
| Multiple R | 0.942832350779459 |
| R-squared | 0.88893284167632 |
| Adjusted R-squared | 0.86057526933836 |
| F-TEST (value) | 31.3472828732364 |
| F-TEST (DF numerator) | 12 |
| F-TEST (DF denominator) | 47 |
| p-value | 0 |
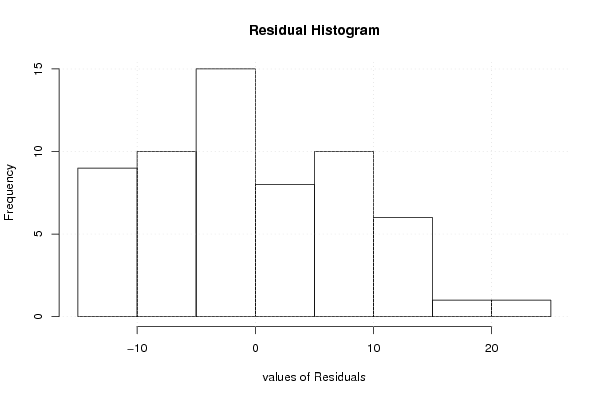
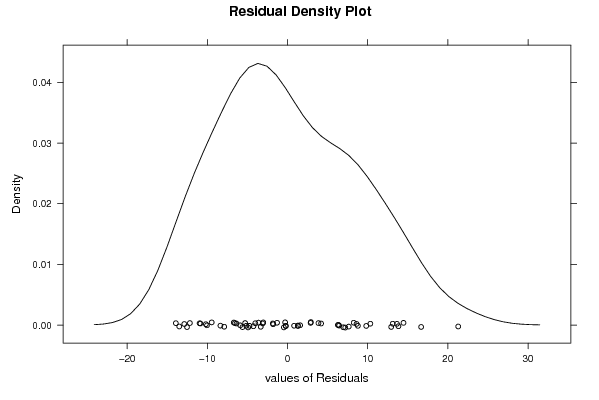
| Multiple Linear Regression - Residual Statistics | |
| Residual Standard Deviation | 9.57635585105123 |
| Sum Squared Residuals | 4310.20979514027 |
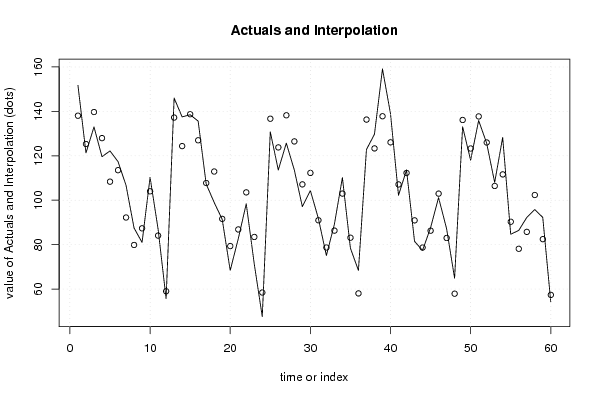
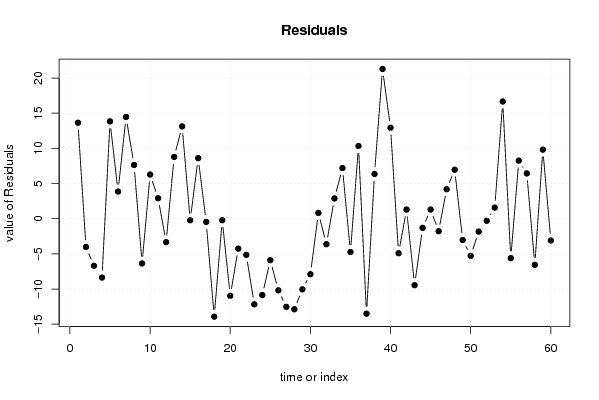
| Multiple Linear Regression - Actuals, Interpolation, and Residuals | |||
| Time or Index | Actuals | Interpolation Forecast | Residuals Prediction Error |
| 1 | 151.7 | 138.049482082801 | 13.6505179171987 |
| 2 | 121.3 | 125.317305909484 | -4.017305909484 |
| 3 | 133 | 139.701995460124 | -6.70199546012401 |
| 4 | 119.6 | 127.970469967970 | -8.3704699679704 |
| 5 | 122.2 | 108.362110552835 | 13.8378894471651 |
| 6 | 117.4 | 113.539991925873 | 3.86000807412670 |
| 7 | 106.7 | 92.232703687643 | 14.4672963123571 |
| 8 | 87.5 | 79.8618288766528 | 7.63817112334725 |
| 9 | 81 | 87.362507321728 | -6.36250732172802 |
| 10 | 110.3 | 104.021801112741 | 6.27819888725919 |
| 11 | 87 | 84.0909818295744 | 2.90901817042556 |
| 12 | 55.7 | 59.0359252924848 | -3.33592529248481 |
| 13 | 146 | 137.219686522842 | 8.7803134771575 |
| 14 | 137.5 | 124.374516911574 | 13.1254830884263 |
| 15 | 138.5 | 138.723896012854 | -0.223896012853871 |
| 16 | 135.6 | 126.988839475764 | 8.61116052423572 |
| 17 | 107.3 | 107.754770823844 | -0.454770823844081 |
| 18 | 99 | 112.929121151946 | -13.9291211519465 |
| 19 | 91.4 | 91.61830186878 | -0.218301868780043 |
| 20 | 68.4 | 79.3674825856136 | -10.9674825856136 |
| 21 | 82.6 | 86.854036850945 | -4.25403685094498 |
| 22 | 98.4 | 103.541579001446 | -5.14157900144572 |
| 23 | 71.3 | 83.4765800107116 | -12.1765800107116 |
| 24 | 47.6 | 58.4603649679179 | -10.8603649679179 |
| 25 | 130.8 | 136.697091872315 | -5.89709187231546 |
| 26 | 113.6 | 123.784832407263 | -10.1848324072628 |
| 27 | 125.7 | 138.236611811687 | -12.5366118116868 |
| 28 | 113.6 | 126.476837960045 | -12.8768379600452 |
| 29 | 97.1 | 107.143900049917 | -10.0439000499172 |
| 30 | 104.4 | 112.297064108404 | -7.89706410840367 |
| 31 | 91.8 | 90.9791827353652 | 0.820817264634755 |
| 32 | 75.1 | 78.7248324072628 | -3.62483240726284 |
| 33 | 89.2 | 86.32084906561 | 2.87915093439003 |
| 34 | 110.2 | 102.997798081303 | 7.20220191869726 |
| 35 | 78.4 | 83.1411307417922 | -4.74113074179218 |
| 36 | 68.4 | 58.0684189800226 | 10.3315810199774 |
| 37 | 122.8 | 136.305145884420 | -13.5051458844202 |
| 38 | 129.7 | 123.336389700392 | 6.36361029960832 |
| 39 | 159.1 | 137.805824329496 | 21.2941756705044 |
| 40 | 139 | 126.06723674747 | 12.93276325253 |
| 41 | 102.2 | 107.115651690429 | -4.91565169042927 |
| 42 | 113.6 | 112.300595153340 | 1.29940484666034 |
| 43 | 81.5 | 90.9544654208133 | -9.4544654208133 |
| 44 | 77.4 | 78.7036461376469 | -1.30364613764686 |
| 45 | 87.6 | 86.299662795994 | 1.30033720400599 |
| 46 | 101.2 | 102.980142856623 | -1.78014285662278 |
| 47 | 87.2 | 83.0104820791604 | 4.18951792083958 |
| 48 | 64.9 | 57.9377703173909 | 6.96222968260915 |
| 49 | 133.1 | 136.128593637621 | -3.02859363762055 |
| 50 | 118 | 123.286955071288 | -5.28695507128776 |
| 51 | 135.9 | 137.731672385840 | -1.83167238583973 |
| 52 | 125.7 | 125.99661584875 | -0.296615848750113 |
| 53 | 108 | 106.423566882975 | 1.57643311702544 |
| 54 | 128.3 | 111.633227660437 | 16.6667723395631 |
| 55 | 84.7 | 90.3153462873985 | -5.61534628739849 |
| 56 | 86.4 | 78.142209992824 | 8.25779000717608 |
| 57 | 92.2 | 85.762943965723 | 6.43705603427699 |
| 58 | 95.8 | 102.358678947888 | -6.55867894788794 |
| 59 | 92.3 | 82.4808253387614 | 9.81917466123859 |
| 60 | 54.3 | 57.3975204421839 | -3.09752044218385 |
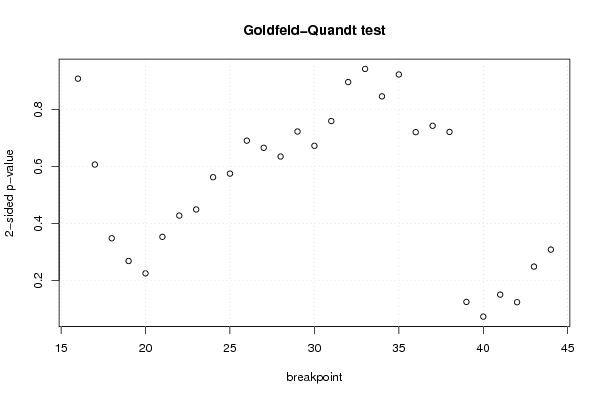
| Goldfeld-Quandt test for Heteroskedasticity | |||
| p-values | Alternative Hypothesis | ||
| breakpoint index | greater | 2-sided | less |
| 16 | 0.453665043231199 | 0.907330086462398 | 0.546334956768801 |
| 17 | 0.696734507580223 | 0.606530984839555 | 0.303265492419777 |
| 18 | 0.825868721491012 | 0.348262557017976 | 0.174131278508988 |
| 19 | 0.865679047972972 | 0.268641904054056 | 0.134320952027028 |
| 20 | 0.887225357666328 | 0.225549284667344 | 0.112774642333672 |
| 21 | 0.823384585754163 | 0.353230828491673 | 0.176615414245837 |
| 22 | 0.786105878821643 | 0.427788242356715 | 0.213894121178357 |
| 23 | 0.775449972246357 | 0.449100055507286 | 0.224550027753643 |
| 24 | 0.718949998715843 | 0.562100002568314 | 0.281050001284157 |
| 25 | 0.712616921443453 | 0.574766157113094 | 0.287383078556547 |
| 26 | 0.65487039018325 | 0.690259219633501 | 0.345129609816750 |
| 27 | 0.667444783056065 | 0.66511043388787 | 0.332555216943935 |
| 28 | 0.682705362157068 | 0.634589275685864 | 0.317294637842932 |
| 29 | 0.638909579223206 | 0.722180841553589 | 0.361090420776794 |
| 30 | 0.663910132768464 | 0.672179734463072 | 0.336089867231536 |
| 31 | 0.620597940016261 | 0.758804119967478 | 0.379402059983739 |
| 32 | 0.552274477935281 | 0.895451044129439 | 0.447725522064719 |
| 33 | 0.529313185138715 | 0.94137362972257 | 0.470686814861285 |
| 34 | 0.577303673247442 | 0.845392653505116 | 0.422696326752558 |
| 35 | 0.53900385149135 | 0.9219922970173 | 0.46099614850865 |
| 36 | 0.639987643094959 | 0.720024713810082 | 0.360012356905041 |
| 37 | 0.628874546549523 | 0.742250906900954 | 0.371125453450477 |
| 38 | 0.639623589285946 | 0.720752821428108 | 0.360376410714054 |
| 39 | 0.937329977018224 | 0.125340045963553 | 0.0626700229817763 |
| 40 | 0.96314140593594 | 0.0737171881281222 | 0.0368585940640611 |
| 41 | 0.924577523820276 | 0.150844952359449 | 0.0754224761797244 |
| 42 | 0.937844967325571 | 0.124310065348857 | 0.0621550326744287 |
| 43 | 0.8754606713732 | 0.249078657253599 | 0.124539328626799 |
| 44 | 0.845719371625671 | 0.308561256748657 | 0.154280628374329 |
| Meta Analysis of Goldfeld-Quandt test for Heteroskedasticity | |||
| Description | # significant tests | % significant tests | OK/NOK |
| 1% type I error level | 0 | 0 | OK |
| 5% type I error level | 0 | 0 | OK |
| 10% type I error level | 1 | 0.0344827586206897 | OK |