| Tabulation of Results | ||
| Popularity x WeightedPopularity | ||
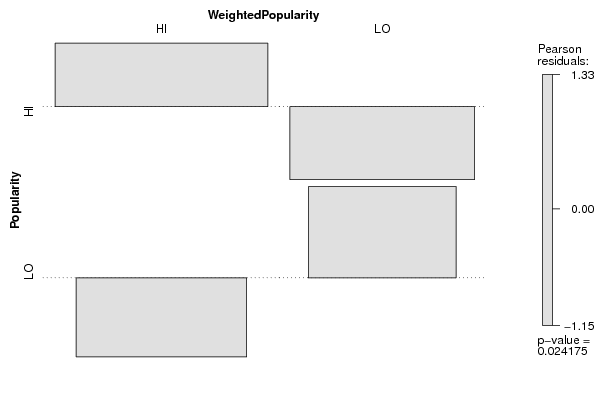
| HI | LO | HI | 61 | 34 | LO | 28 | 33 |
| Tabulation of Expected Results | ||
| Popularity x WeightedPopularity | ||
| HI | LO | HI | 54.2 | 40.8 | LO | 34.8 | 26.2 |
| Statistical Results | |
| Pearson's Chi-squared test with Yates' continuity correction | |
| Chi Square Statistic | 4.36 |
| Degrees of Freedom | 1 |
| P value | 0.04 |