Free Statistics

of Irreproducible Research!

Author's title

Author*Unverified author*
R Software Modulerwasp_autocorrelation.wasp
Title produced by software(Partial) Autocorrelation Function
Date of computationSat, 20 Nov 2010 16:28:20 +0000
Cite this page as followsStatistical Computations at FreeStatistics.org, Office for Research Development and Education, URL https://freestatistics.org/blog/index.php?v=date/2010/Nov/20/t12902704364mpsdkh1aufye2j.htm/, Retrieved Sat, 27 Apr 2024 05:33:53 +0000
Statistical Computations at FreeStatistics.org, Office for Research Development and Education, URL https://freestatistics.org/blog/index.php?pk=98255, Retrieved Sat, 27 Apr 2024 05:33:53 +0000
QR Codes:

Original text written by user:
IsPrivate?No (this computation is public)
User-defined keywordsKDGP1W12
Estimated Impact152
Family? (F = Feedback message, R = changed R code, M = changed R Module, P = changed Parameters, D = changed Data)
-     [Univariate Data Series] [opgave 6 oef 1] [2010-11-20 12:51:09] [ee977c9178adbf77d0a6da27ad6d4827]
-   PD  [Univariate Data Series] [opgave 6 oef 2] [2010-11-20 13:46:54] [ee977c9178adbf77d0a6da27ad6d4827]
- RMP       [(Partial) Autocorrelation Function] [oef 6 bis oef 2 s...] [2010-11-20 16:28:20] [3c84fba69796ffa9703fc49b6977555d] [Current]
-    D        [(Partial) Autocorrelation Function] [oef 6 bis oef 2 s...] [2010-11-20 16:45:34] [ee977c9178adbf77d0a6da27ad6d4827]
Feedback Forum

Post a new message
Dataseries X:
102.8
106.3
103.7
106.9
104.3
105.4
96.2
95.7
95.9
93.6
94.7
94.5
96.6
96.7
98.9
102
105.2
106.4
99.3
96.4
93.1
95.6
93.3
96.7
105.6
105.2
107
104.9
104.5
105.2
99.7
100.2
98.5
98.4
97.1
98.4
100.6
111.3
119
117.8
108.8
109.3
103.5
103.7
110
105.5
110.4
106.7
110.2
105.2
108
108.1
107.2
106
99.4
100.2
100.3
100.8
99.5
100.2
103
111
120.5
109.5
106.6
105.5
103.9
104.9
104.8
99.6
97
95.4
99.3
103.9
107.4
107.4
111
113.2
108.5
113.3
113.8
105.3
107.5
109.4
118.9
119
115
124.1
120.5
117.7
117.1
118.1
119.6
118.8
124.9
124
124.9
121.7
121.6
125.1
127.9
129
130.1
130.3
127.9
124.1
125.7
129.2
129.2
132.6
131.5
131
125.8
127.2
127.3
127.5
122
118.4
118.3
115.5


Summary of computational transaction
Raw Inputview raw input (R code)
Raw Outputview raw output of R engine
Computing time2 seconds
R Server'RServer@AstonUniversity' @ vre.aston.ac.uk

\begin{tabular}{lllllllll}
\hline
Summary of computational transaction \tabularnewline
Raw Input & view raw input (R code)  \tabularnewline
Raw Output & view raw output of R engine  \tabularnewline
Computing time & 2 seconds \tabularnewline
R Server & 'RServer@AstonUniversity' @ vre.aston.ac.uk \tabularnewline
\hline
\end{tabular}
%Source: https://freestatistics.org/blog/index.php?pk=98255&T=0

[TABLE]
[ROW][C]Summary of computational transaction[/C][/ROW]
[ROW][C]Raw Input[/C][C]view raw input (R code) [/C][/ROW]
[ROW][C]Raw Output[/C][C]view raw output of R engine [/C][/ROW]
[ROW][C]Computing time[/C][C]2 seconds[/C][/ROW]
[ROW][C]R Server[/C][C]'RServer@AstonUniversity' @ vre.aston.ac.uk[/C][/ROW]
[/TABLE]
Source: https://freestatistics.org/blog/index.php?pk=98255&T=0

Globally Unique Identifier (entire table): ba.freestatistics.org/blog/index.php?pk=98255&T=0

As an alternative you can also use a QR Code:  

The GUIDs for individual cells are displayed in the table below:

Summary of computational transaction
Raw Inputview raw input (R code)
Raw Outputview raw output of R engine
Computing time2 seconds
R Server'RServer@AstonUniversity' @ vre.aston.ac.uk


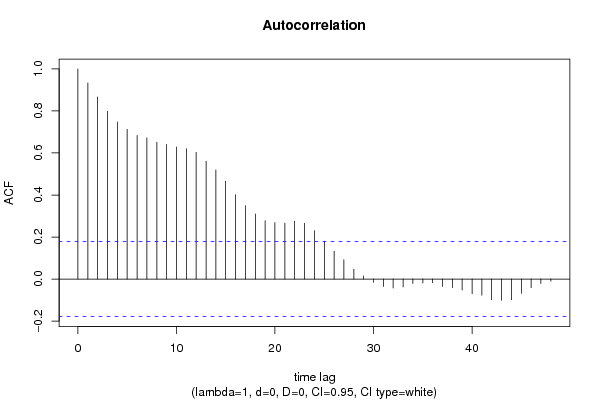
Autocorrelation Function
Time lag kACF(k)T-STATP-value
10.9331510.22210
20.8664929.49190
30.7988448.75090
40.7477668.19140
50.7126887.80710
60.6831587.48360
70.6717527.35870
80.6508887.13010
90.6404487.01580
100.6281196.88070
110.6207046.79950
120.6031886.60760
130.5611916.14750
140.5191425.68690
150.4654045.09821e-06
160.4012314.39531.2e-05
170.3492833.82620.000104
180.3094683.39010.000473
190.2778323.04350.001437
200.2686252.94260.001954
210.2664972.91930.002095
220.2752493.01520.001567
230.2654152.90750.002171
240.2304042.5240.006455
250.1798711.97040.025548
260.1321161.44730.075215
270.0923551.01170.156859
280.0463760.5080.306186
290.0142670.15630.438035
30-0.015471-0.16950.432855
31-0.035411-0.38790.349386
32-0.043036-0.47140.319094
33-0.037298-0.40860.34179
34-0.020786-0.22770.410133
35-0.019091-0.20910.417352
36-0.017302-0.18950.424996
37-0.035405-0.38780.349409
38-0.040718-0.4460.328186
39-0.052208-0.57190.284226
40-0.069977-0.76660.222423
41-0.076739-0.84060.201113
42-0.098013-1.07370.14256
43-0.101117-1.10770.135107
44-0.098316-1.0770.14182
45-0.067537-0.73980.230423
46-0.040789-0.44680.327905
47-0.021052-0.23060.409002
48-0.010378-0.11370.454837

\begin{tabular}{lllllllll}
\hline
Autocorrelation Function \tabularnewline
Time lag k & ACF(k) & T-STAT & P-value \tabularnewline
1 & 0.93315 & 10.2221 & 0 \tabularnewline
2 & 0.866492 & 9.4919 & 0 \tabularnewline
3 & 0.798844 & 8.7509 & 0 \tabularnewline
4 & 0.747766 & 8.1914 & 0 \tabularnewline
5 & 0.712688 & 7.8071 & 0 \tabularnewline
6 & 0.683158 & 7.4836 & 0 \tabularnewline
7 & 0.671752 & 7.3587 & 0 \tabularnewline
8 & 0.650888 & 7.1301 & 0 \tabularnewline
9 & 0.640448 & 7.0158 & 0 \tabularnewline
10 & 0.628119 & 6.8807 & 0 \tabularnewline
11 & 0.620704 & 6.7995 & 0 \tabularnewline
12 & 0.603188 & 6.6076 & 0 \tabularnewline
13 & 0.561191 & 6.1475 & 0 \tabularnewline
14 & 0.519142 & 5.6869 & 0 \tabularnewline
15 & 0.465404 & 5.0982 & 1e-06 \tabularnewline
16 & 0.401231 & 4.3953 & 1.2e-05 \tabularnewline
17 & 0.349283 & 3.8262 & 0.000104 \tabularnewline
18 & 0.309468 & 3.3901 & 0.000473 \tabularnewline
19 & 0.277832 & 3.0435 & 0.001437 \tabularnewline
20 & 0.268625 & 2.9426 & 0.001954 \tabularnewline
21 & 0.266497 & 2.9193 & 0.002095 \tabularnewline
22 & 0.275249 & 3.0152 & 0.001567 \tabularnewline
23 & 0.265415 & 2.9075 & 0.002171 \tabularnewline
24 & 0.230404 & 2.524 & 0.006455 \tabularnewline
25 & 0.179871 & 1.9704 & 0.025548 \tabularnewline
26 & 0.132116 & 1.4473 & 0.075215 \tabularnewline
27 & 0.092355 & 1.0117 & 0.156859 \tabularnewline
28 & 0.046376 & 0.508 & 0.306186 \tabularnewline
29 & 0.014267 & 0.1563 & 0.438035 \tabularnewline
30 & -0.015471 & -0.1695 & 0.432855 \tabularnewline
31 & -0.035411 & -0.3879 & 0.349386 \tabularnewline
32 & -0.043036 & -0.4714 & 0.319094 \tabularnewline
33 & -0.037298 & -0.4086 & 0.34179 \tabularnewline
34 & -0.020786 & -0.2277 & 0.410133 \tabularnewline
35 & -0.019091 & -0.2091 & 0.417352 \tabularnewline
36 & -0.017302 & -0.1895 & 0.424996 \tabularnewline
37 & -0.035405 & -0.3878 & 0.349409 \tabularnewline
38 & -0.040718 & -0.446 & 0.328186 \tabularnewline
39 & -0.052208 & -0.5719 & 0.284226 \tabularnewline
40 & -0.069977 & -0.7666 & 0.222423 \tabularnewline
41 & -0.076739 & -0.8406 & 0.201113 \tabularnewline
42 & -0.098013 & -1.0737 & 0.14256 \tabularnewline
43 & -0.101117 & -1.1077 & 0.135107 \tabularnewline
44 & -0.098316 & -1.077 & 0.14182 \tabularnewline
45 & -0.067537 & -0.7398 & 0.230423 \tabularnewline
46 & -0.040789 & -0.4468 & 0.327905 \tabularnewline
47 & -0.021052 & -0.2306 & 0.409002 \tabularnewline
48 & -0.010378 & -0.1137 & 0.454837 \tabularnewline
\hline
\end{tabular}
%Source: https://freestatistics.org/blog/index.php?pk=98255&T=1

[TABLE]
[ROW][C]Autocorrelation Function[/C][/ROW]
[ROW][C]Time lag k[/C][C]ACF(k)[/C][C]T-STAT[/C][C]P-value[/C][/ROW]
[ROW][C]1[/C][C]0.93315[/C][C]10.2221[/C][C]0[/C][/ROW]
[ROW][C]2[/C][C]0.866492[/C][C]9.4919[/C][C]0[/C][/ROW]
[ROW][C]3[/C][C]0.798844[/C][C]8.7509[/C][C]0[/C][/ROW]
[ROW][C]4[/C][C]0.747766[/C][C]8.1914[/C][C]0[/C][/ROW]
[ROW][C]5[/C][C]0.712688[/C][C]7.8071[/C][C]0[/C][/ROW]
[ROW][C]6[/C][C]0.683158[/C][C]7.4836[/C][C]0[/C][/ROW]
[ROW][C]7[/C][C]0.671752[/C][C]7.3587[/C][C]0[/C][/ROW]
[ROW][C]8[/C][C]0.650888[/C][C]7.1301[/C][C]0[/C][/ROW]
[ROW][C]9[/C][C]0.640448[/C][C]7.0158[/C][C]0[/C][/ROW]
[ROW][C]10[/C][C]0.628119[/C][C]6.8807[/C][C]0[/C][/ROW]
[ROW][C]11[/C][C]0.620704[/C][C]6.7995[/C][C]0[/C][/ROW]
[ROW][C]12[/C][C]0.603188[/C][C]6.6076[/C][C]0[/C][/ROW]
[ROW][C]13[/C][C]0.561191[/C][C]6.1475[/C][C]0[/C][/ROW]
[ROW][C]14[/C][C]0.519142[/C][C]5.6869[/C][C]0[/C][/ROW]
[ROW][C]15[/C][C]0.465404[/C][C]5.0982[/C][C]1e-06[/C][/ROW]
[ROW][C]16[/C][C]0.401231[/C][C]4.3953[/C][C]1.2e-05[/C][/ROW]
[ROW][C]17[/C][C]0.349283[/C][C]3.8262[/C][C]0.000104[/C][/ROW]
[ROW][C]18[/C][C]0.309468[/C][C]3.3901[/C][C]0.000473[/C][/ROW]
[ROW][C]19[/C][C]0.277832[/C][C]3.0435[/C][C]0.001437[/C][/ROW]
[ROW][C]20[/C][C]0.268625[/C][C]2.9426[/C][C]0.001954[/C][/ROW]
[ROW][C]21[/C][C]0.266497[/C][C]2.9193[/C][C]0.002095[/C][/ROW]
[ROW][C]22[/C][C]0.275249[/C][C]3.0152[/C][C]0.001567[/C][/ROW]
[ROW][C]23[/C][C]0.265415[/C][C]2.9075[/C][C]0.002171[/C][/ROW]
[ROW][C]24[/C][C]0.230404[/C][C]2.524[/C][C]0.006455[/C][/ROW]
[ROW][C]25[/C][C]0.179871[/C][C]1.9704[/C][C]0.025548[/C][/ROW]
[ROW][C]26[/C][C]0.132116[/C][C]1.4473[/C][C]0.075215[/C][/ROW]
[ROW][C]27[/C][C]0.092355[/C][C]1.0117[/C][C]0.156859[/C][/ROW]
[ROW][C]28[/C][C]0.046376[/C][C]0.508[/C][C]0.306186[/C][/ROW]
[ROW][C]29[/C][C]0.014267[/C][C]0.1563[/C][C]0.438035[/C][/ROW]
[ROW][C]30[/C][C]-0.015471[/C][C]-0.1695[/C][C]0.432855[/C][/ROW]
[ROW][C]31[/C][C]-0.035411[/C][C]-0.3879[/C][C]0.349386[/C][/ROW]
[ROW][C]32[/C][C]-0.043036[/C][C]-0.4714[/C][C]0.319094[/C][/ROW]
[ROW][C]33[/C][C]-0.037298[/C][C]-0.4086[/C][C]0.34179[/C][/ROW]
[ROW][C]34[/C][C]-0.020786[/C][C]-0.2277[/C][C]0.410133[/C][/ROW]
[ROW][C]35[/C][C]-0.019091[/C][C]-0.2091[/C][C]0.417352[/C][/ROW]
[ROW][C]36[/C][C]-0.017302[/C][C]-0.1895[/C][C]0.424996[/C][/ROW]
[ROW][C]37[/C][C]-0.035405[/C][C]-0.3878[/C][C]0.349409[/C][/ROW]
[ROW][C]38[/C][C]-0.040718[/C][C]-0.446[/C][C]0.328186[/C][/ROW]
[ROW][C]39[/C][C]-0.052208[/C][C]-0.5719[/C][C]0.284226[/C][/ROW]
[ROW][C]40[/C][C]-0.069977[/C][C]-0.7666[/C][C]0.222423[/C][/ROW]
[ROW][C]41[/C][C]-0.076739[/C][C]-0.8406[/C][C]0.201113[/C][/ROW]
[ROW][C]42[/C][C]-0.098013[/C][C]-1.0737[/C][C]0.14256[/C][/ROW]
[ROW][C]43[/C][C]-0.101117[/C][C]-1.1077[/C][C]0.135107[/C][/ROW]
[ROW][C]44[/C][C]-0.098316[/C][C]-1.077[/C][C]0.14182[/C][/ROW]
[ROW][C]45[/C][C]-0.067537[/C][C]-0.7398[/C][C]0.230423[/C][/ROW]
[ROW][C]46[/C][C]-0.040789[/C][C]-0.4468[/C][C]0.327905[/C][/ROW]
[ROW][C]47[/C][C]-0.021052[/C][C]-0.2306[/C][C]0.409002[/C][/ROW]
[ROW][C]48[/C][C]-0.010378[/C][C]-0.1137[/C][C]0.454837[/C][/ROW]
[/TABLE]
Source: https://freestatistics.org/blog/index.php?pk=98255&T=1

Globally Unique Identifier (entire table): ba.freestatistics.org/blog/index.php?pk=98255&T=1

As an alternative you can also use a QR Code:  

The GUIDs for individual cells are displayed in the table below:

Autocorrelation Function
Time lag kACF(k)T-STATP-value
10.9331510.22210
20.8664929.49190
30.7988448.75090
40.7477668.19140
50.7126887.80710
60.6831587.48360
70.6717527.35870
80.6508887.13010
90.6404487.01580
100.6281196.88070
110.6207046.79950
120.6031886.60760
130.5611916.14750
140.5191425.68690
150.4654045.09821e-06
160.4012314.39531.2e-05
170.3492833.82620.000104
180.3094683.39010.000473
190.2778323.04350.001437
200.2686252.94260.001954
210.2664972.91930.002095
220.2752493.01520.001567
230.2654152.90750.002171
240.2304042.5240.006455
250.1798711.97040.025548
260.1321161.44730.075215
270.0923551.01170.156859
280.0463760.5080.306186
290.0142670.15630.438035
30-0.015471-0.16950.432855
31-0.035411-0.38790.349386
32-0.043036-0.47140.319094
33-0.037298-0.40860.34179
34-0.020786-0.22770.410133
35-0.019091-0.20910.417352
36-0.017302-0.18950.424996
37-0.035405-0.38780.349409
38-0.040718-0.4460.328186
39-0.052208-0.57190.284226
40-0.069977-0.76660.222423
41-0.076739-0.84060.201113
42-0.098013-1.07370.14256
43-0.101117-1.10770.135107
44-0.098316-1.0770.14182
45-0.067537-0.73980.230423
46-0.040789-0.44680.327905
47-0.021052-0.23060.409002
48-0.010378-0.11370.454837


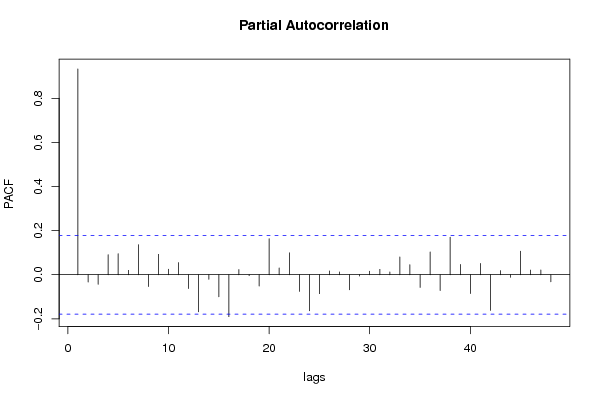
Partial Autocorrelation Function
Time lag kPACF(k)T-STATP-value
10.9331510.22210
2-0.033087-0.36250.358825
3-0.043391-0.47530.317709
40.0909810.99660.160472
50.0953221.04420.149247
60.0197240.21610.414651
70.1363231.49330.068986
8-0.053725-0.58850.278641
90.0922291.01030.157189
100.0250470.27440.392132
110.0549210.60160.274278
12-0.063043-0.69060.245573
13-0.167987-1.84020.034104
14-0.020828-0.22820.409954
15-0.100017-1.09560.137718
16-0.190282-2.08440.019621
170.0230660.25270.400476
18-0.004402-0.04820.480809
19-0.051232-0.56120.287847
200.1628581.7840.038474
210.0308240.33770.368104
220.0990541.08510.14003
23-0.075847-0.83090.203851
24-0.16349-1.79090.037911
25-0.085935-0.94140.174204
260.0168310.18440.427016
270.0120530.1320.447591
28-0.068737-0.7530.226469
29-0.006341-0.06950.472367
300.0160.17530.430582
310.0243490.26670.395066
320.0123860.13570.446148
330.0803290.880.190319
340.0451480.49460.310902
35-0.057594-0.63090.264651
360.1035041.13380.129563
37-0.07158-0.78410.217256
380.1696431.85830.032785
390.0464930.50930.305735
40-0.085094-0.93220.176563
410.0511290.56010.288231
42-0.161898-1.77350.039341
430.0187020.20490.419009
44-0.011412-0.1250.450361
450.1064041.16560.123044
460.0209220.22920.409558
470.021020.23030.409138
48-0.032448-0.35550.361438

\begin{tabular}{lllllllll}
\hline
Partial Autocorrelation Function \tabularnewline
Time lag k & PACF(k) & T-STAT & P-value \tabularnewline
1 & 0.93315 & 10.2221 & 0 \tabularnewline
2 & -0.033087 & -0.3625 & 0.358825 \tabularnewline
3 & -0.043391 & -0.4753 & 0.317709 \tabularnewline
4 & 0.090981 & 0.9966 & 0.160472 \tabularnewline
5 & 0.095322 & 1.0442 & 0.149247 \tabularnewline
6 & 0.019724 & 0.2161 & 0.414651 \tabularnewline
7 & 0.136323 & 1.4933 & 0.068986 \tabularnewline
8 & -0.053725 & -0.5885 & 0.278641 \tabularnewline
9 & 0.092229 & 1.0103 & 0.157189 \tabularnewline
10 & 0.025047 & 0.2744 & 0.392132 \tabularnewline
11 & 0.054921 & 0.6016 & 0.274278 \tabularnewline
12 & -0.063043 & -0.6906 & 0.245573 \tabularnewline
13 & -0.167987 & -1.8402 & 0.034104 \tabularnewline
14 & -0.020828 & -0.2282 & 0.409954 \tabularnewline
15 & -0.100017 & -1.0956 & 0.137718 \tabularnewline
16 & -0.190282 & -2.0844 & 0.019621 \tabularnewline
17 & 0.023066 & 0.2527 & 0.400476 \tabularnewline
18 & -0.004402 & -0.0482 & 0.480809 \tabularnewline
19 & -0.051232 & -0.5612 & 0.287847 \tabularnewline
20 & 0.162858 & 1.784 & 0.038474 \tabularnewline
21 & 0.030824 & 0.3377 & 0.368104 \tabularnewline
22 & 0.099054 & 1.0851 & 0.14003 \tabularnewline
23 & -0.075847 & -0.8309 & 0.203851 \tabularnewline
24 & -0.16349 & -1.7909 & 0.037911 \tabularnewline
25 & -0.085935 & -0.9414 & 0.174204 \tabularnewline
26 & 0.016831 & 0.1844 & 0.427016 \tabularnewline
27 & 0.012053 & 0.132 & 0.447591 \tabularnewline
28 & -0.068737 & -0.753 & 0.226469 \tabularnewline
29 & -0.006341 & -0.0695 & 0.472367 \tabularnewline
30 & 0.016 & 0.1753 & 0.430582 \tabularnewline
31 & 0.024349 & 0.2667 & 0.395066 \tabularnewline
32 & 0.012386 & 0.1357 & 0.446148 \tabularnewline
33 & 0.080329 & 0.88 & 0.190319 \tabularnewline
34 & 0.045148 & 0.4946 & 0.310902 \tabularnewline
35 & -0.057594 & -0.6309 & 0.264651 \tabularnewline
36 & 0.103504 & 1.1338 & 0.129563 \tabularnewline
37 & -0.07158 & -0.7841 & 0.217256 \tabularnewline
38 & 0.169643 & 1.8583 & 0.032785 \tabularnewline
39 & 0.046493 & 0.5093 & 0.305735 \tabularnewline
40 & -0.085094 & -0.9322 & 0.176563 \tabularnewline
41 & 0.051129 & 0.5601 & 0.288231 \tabularnewline
42 & -0.161898 & -1.7735 & 0.039341 \tabularnewline
43 & 0.018702 & 0.2049 & 0.419009 \tabularnewline
44 & -0.011412 & -0.125 & 0.450361 \tabularnewline
45 & 0.106404 & 1.1656 & 0.123044 \tabularnewline
46 & 0.020922 & 0.2292 & 0.409558 \tabularnewline
47 & 0.02102 & 0.2303 & 0.409138 \tabularnewline
48 & -0.032448 & -0.3555 & 0.361438 \tabularnewline
\hline
\end{tabular}
%Source: https://freestatistics.org/blog/index.php?pk=98255&T=2

[TABLE]
[ROW][C]Partial Autocorrelation Function[/C][/ROW]
[ROW][C]Time lag k[/C][C]PACF(k)[/C][C]T-STAT[/C][C]P-value[/C][/ROW]
[ROW][C]1[/C][C]0.93315[/C][C]10.2221[/C][C]0[/C][/ROW]
[ROW][C]2[/C][C]-0.033087[/C][C]-0.3625[/C][C]0.358825[/C][/ROW]
[ROW][C]3[/C][C]-0.043391[/C][C]-0.4753[/C][C]0.317709[/C][/ROW]
[ROW][C]4[/C][C]0.090981[/C][C]0.9966[/C][C]0.160472[/C][/ROW]
[ROW][C]5[/C][C]0.095322[/C][C]1.0442[/C][C]0.149247[/C][/ROW]
[ROW][C]6[/C][C]0.019724[/C][C]0.2161[/C][C]0.414651[/C][/ROW]
[ROW][C]7[/C][C]0.136323[/C][C]1.4933[/C][C]0.068986[/C][/ROW]
[ROW][C]8[/C][C]-0.053725[/C][C]-0.5885[/C][C]0.278641[/C][/ROW]
[ROW][C]9[/C][C]0.092229[/C][C]1.0103[/C][C]0.157189[/C][/ROW]
[ROW][C]10[/C][C]0.025047[/C][C]0.2744[/C][C]0.392132[/C][/ROW]
[ROW][C]11[/C][C]0.054921[/C][C]0.6016[/C][C]0.274278[/C][/ROW]
[ROW][C]12[/C][C]-0.063043[/C][C]-0.6906[/C][C]0.245573[/C][/ROW]
[ROW][C]13[/C][C]-0.167987[/C][C]-1.8402[/C][C]0.034104[/C][/ROW]
[ROW][C]14[/C][C]-0.020828[/C][C]-0.2282[/C][C]0.409954[/C][/ROW]
[ROW][C]15[/C][C]-0.100017[/C][C]-1.0956[/C][C]0.137718[/C][/ROW]
[ROW][C]16[/C][C]-0.190282[/C][C]-2.0844[/C][C]0.019621[/C][/ROW]
[ROW][C]17[/C][C]0.023066[/C][C]0.2527[/C][C]0.400476[/C][/ROW]
[ROW][C]18[/C][C]-0.004402[/C][C]-0.0482[/C][C]0.480809[/C][/ROW]
[ROW][C]19[/C][C]-0.051232[/C][C]-0.5612[/C][C]0.287847[/C][/ROW]
[ROW][C]20[/C][C]0.162858[/C][C]1.784[/C][C]0.038474[/C][/ROW]
[ROW][C]21[/C][C]0.030824[/C][C]0.3377[/C][C]0.368104[/C][/ROW]
[ROW][C]22[/C][C]0.099054[/C][C]1.0851[/C][C]0.14003[/C][/ROW]
[ROW][C]23[/C][C]-0.075847[/C][C]-0.8309[/C][C]0.203851[/C][/ROW]
[ROW][C]24[/C][C]-0.16349[/C][C]-1.7909[/C][C]0.037911[/C][/ROW]
[ROW][C]25[/C][C]-0.085935[/C][C]-0.9414[/C][C]0.174204[/C][/ROW]
[ROW][C]26[/C][C]0.016831[/C][C]0.1844[/C][C]0.427016[/C][/ROW]
[ROW][C]27[/C][C]0.012053[/C][C]0.132[/C][C]0.447591[/C][/ROW]
[ROW][C]28[/C][C]-0.068737[/C][C]-0.753[/C][C]0.226469[/C][/ROW]
[ROW][C]29[/C][C]-0.006341[/C][C]-0.0695[/C][C]0.472367[/C][/ROW]
[ROW][C]30[/C][C]0.016[/C][C]0.1753[/C][C]0.430582[/C][/ROW]
[ROW][C]31[/C][C]0.024349[/C][C]0.2667[/C][C]0.395066[/C][/ROW]
[ROW][C]32[/C][C]0.012386[/C][C]0.1357[/C][C]0.446148[/C][/ROW]
[ROW][C]33[/C][C]0.080329[/C][C]0.88[/C][C]0.190319[/C][/ROW]
[ROW][C]34[/C][C]0.045148[/C][C]0.4946[/C][C]0.310902[/C][/ROW]
[ROW][C]35[/C][C]-0.057594[/C][C]-0.6309[/C][C]0.264651[/C][/ROW]
[ROW][C]36[/C][C]0.103504[/C][C]1.1338[/C][C]0.129563[/C][/ROW]
[ROW][C]37[/C][C]-0.07158[/C][C]-0.7841[/C][C]0.217256[/C][/ROW]
[ROW][C]38[/C][C]0.169643[/C][C]1.8583[/C][C]0.032785[/C][/ROW]
[ROW][C]39[/C][C]0.046493[/C][C]0.5093[/C][C]0.305735[/C][/ROW]
[ROW][C]40[/C][C]-0.085094[/C][C]-0.9322[/C][C]0.176563[/C][/ROW]
[ROW][C]41[/C][C]0.051129[/C][C]0.5601[/C][C]0.288231[/C][/ROW]
[ROW][C]42[/C][C]-0.161898[/C][C]-1.7735[/C][C]0.039341[/C][/ROW]
[ROW][C]43[/C][C]0.018702[/C][C]0.2049[/C][C]0.419009[/C][/ROW]
[ROW][C]44[/C][C]-0.011412[/C][C]-0.125[/C][C]0.450361[/C][/ROW]
[ROW][C]45[/C][C]0.106404[/C][C]1.1656[/C][C]0.123044[/C][/ROW]
[ROW][C]46[/C][C]0.020922[/C][C]0.2292[/C][C]0.409558[/C][/ROW]
[ROW][C]47[/C][C]0.02102[/C][C]0.2303[/C][C]0.409138[/C][/ROW]
[ROW][C]48[/C][C]-0.032448[/C][C]-0.3555[/C][C]0.361438[/C][/ROW]
[/TABLE]
Source: https://freestatistics.org/blog/index.php?pk=98255&T=2

Globally Unique Identifier (entire table): ba.freestatistics.org/blog/index.php?pk=98255&T=2

As an alternative you can also use a QR Code:  

The GUIDs for individual cells are displayed in the table below:

Partial Autocorrelation Function
Time lag kPACF(k)T-STATP-value
10.9331510.22210
2-0.033087-0.36250.358825
3-0.043391-0.47530.317709
40.0909810.99660.160472
50.0953221.04420.149247
60.0197240.21610.414651
70.1363231.49330.068986
8-0.053725-0.58850.278641
90.0922291.01030.157189
100.0250470.27440.392132
110.0549210.60160.274278
12-0.063043-0.69060.245573
13-0.167987-1.84020.034104
14-0.020828-0.22820.409954
15-0.100017-1.09560.137718
16-0.190282-2.08440.019621
170.0230660.25270.400476
18-0.004402-0.04820.480809
19-0.051232-0.56120.287847
200.1628581.7840.038474
210.0308240.33770.368104
220.0990541.08510.14003
23-0.075847-0.83090.203851
24-0.16349-1.79090.037911
25-0.085935-0.94140.174204
260.0168310.18440.427016
270.0120530.1320.447591
28-0.068737-0.7530.226469
29-0.006341-0.06950.472367
300.0160.17530.430582
310.0243490.26670.395066
320.0123860.13570.446148
330.0803290.880.190319
340.0451480.49460.310902
35-0.057594-0.63090.264651
360.1035041.13380.129563
37-0.07158-0.78410.217256
380.1696431.85830.032785
390.0464930.50930.305735
40-0.085094-0.93220.176563
410.0511290.56010.288231
42-0.161898-1.77350.039341
430.0187020.20490.419009
44-0.011412-0.1250.450361
450.1064041.16560.123044
460.0209220.22920.409558
470.021020.23030.409138
48-0.032448-0.35550.361438


Parameters (Session):
par1 = 48 ; par2 = 1 ; par3 = 1 ; par4 = 0 ; par5 = 12 ; par6 = White Noise ; par7 = 0.95 ;
Parameters (R input):
par1 = 48 ; par2 = 1 ; par3 = 0 ; par4 = 0 ; par5 = 12 ; par6 = White Noise ; par7 = 0.95 ;
R code (references can be found in the software module):
if (par1 == 'Default') {
par1 = 10*log10(length(x))
} else {
par1 <- as.numeric(par1)
}
par2 <- as.numeric(par2)
par3 <- as.numeric(par3)
par4 <- as.numeric(par4)
par5 <- as.numeric(par5)
if (par6 == 'White Noise') par6 <- 'white' else par6 <- 'ma'
par7 <- as.numeric(par7)
if (par2 == 0) {
x <- log(x)
} else {
x <- (x ^ par2 - 1) / par2
}
if (par3 > 0) x <- diff(x,lag=1,difference=par3)
if (par4 > 0) x <- diff(x,lag=par5,difference=par4)
bitmap(file='pic1.png')
racf <- acf(x, par1, main='Autocorrelation', xlab='time lag', ylab='ACF', ci.type=par6, ci=par7, sub=paste('(lambda=',par2,', d=',par3,', D=',par4,', CI=', par7, ', CI type=',par6,')',sep=''))
dev.off()
bitmap(file='pic2.png')
rpacf <- pacf(x,par1,main='Partial Autocorrelation',xlab='lags',ylab='PACF')
dev.off()
(myacf <- c(racf$acf))
(mypacf <- c(rpacf$acf))
lengthx <- length(x)
sqrtn <- sqrt(lengthx)
load(file='createtable')
a<-table.start()
a<-table.row.start(a)
a<-table.element(a,'Autocorrelation Function',4,TRUE)
a<-table.row.end(a)
a<-table.row.start(a)
a<-table.element(a,'Time lag k',header=TRUE)
a<-table.element(a,hyperlink('basics.htm','ACF(k)','click here for more information about the Autocorrelation Function'),header=TRUE)
a<-table.element(a,'T-STAT',header=TRUE)
a<-table.element(a,'P-value',header=TRUE)
a<-table.row.end(a)
for (i in 2:(par1+1)) {
a<-table.row.start(a)
a<-table.element(a,i-1,header=TRUE)
a<-table.element(a,round(myacf[i],6))
mytstat <- myacf[i]*sqrtn
a<-table.element(a,round(mytstat,4))
a<-table.element(a,round(1-pt(abs(mytstat),lengthx),6))
a<-table.row.end(a)
}
a<-table.end(a)
table.save(a,file='mytable.tab')
a<-table.start()
a<-table.row.start(a)
a<-table.element(a,'Partial Autocorrelation Function',4,TRUE)
a<-table.row.end(a)
a<-table.row.start(a)
a<-table.element(a,'Time lag k',header=TRUE)
a<-table.element(a,hyperlink('basics.htm','PACF(k)','click here for more information about the Partial Autocorrelation Function'),header=TRUE)
a<-table.element(a,'T-STAT',header=TRUE)
a<-table.element(a,'P-value',header=TRUE)
a<-table.row.end(a)
for (i in 1:par1) {
a<-table.row.start(a)
a<-table.element(a,i,header=TRUE)
a<-table.element(a,round(mypacf[i],6))
mytstat <- mypacf[i]*sqrtn
a<-table.element(a,round(mytstat,4))
a<-table.element(a,round(1-pt(abs(mytstat),lengthx),6))
a<-table.row.end(a)
}
a<-table.end(a)
table.save(a,file='mytable1.tab')