Free Statistics

of Irreproducible Research!

Author's title

Author*Unverified author*
R Software Modulerwasp_autocorrelation.wasp
Title produced by software(Partial) Autocorrelation Function
Date of computationSat, 20 Nov 2010 15:48:15 +0000
Cite this page as followsStatistical Computations at FreeStatistics.org, Office for Research Development and Education, URL https://freestatistics.org/blog/index.php?v=date/2010/Nov/20/t1290268000bebqcyac8viygyc.htm/, Retrieved Sat, 27 Apr 2024 09:46:43 +0000
Statistical Computations at FreeStatistics.org, Office for Research Development and Education, URL https://freestatistics.org/blog/index.php?pk=98236, Retrieved Sat, 27 Apr 2024 09:46:43 +0000
QR Codes:

Original text written by user:
IsPrivate?No (this computation is public)
User-defined keywordsKDGP2W12
Estimated Impact136
Family? (F = Feedback message, R = changed R code, M = changed R Module, P = changed Parameters, D = changed Data)
-       [(Partial) Autocorrelation Function] [Verkoop cosmetica] [2010-11-20 15:48:15] [c6158409503ffaeb6d7b5957d384c3e1] [Current]
Feedback Forum

Post a new message
Dataseries X:
84,9
81,9
95,9
81
89,2
102,5
89,8
88,8
83,2
90,2
100,4
187,1
87,6
85,4
86,1
86,7
89,1
103,7
86,9
85,2
80,8
91,2
102,8
182,5
80,9
83,1
88,3
86,6
93
105,3
93,8
86,4
87
96,7
100,5
196,7
86,8
88,2
93,8
85
90,4
115,9
94,9
87,7
91,7
95,9
106,8
204,5
90,2
90,5
93,2
97,8
99,4
120
108,2
98,5
104,3
102,9
111,1
188,1
93,8
94,5
112,4
102,5
115,8
136,5
122,1
110,6
116,4
112,6
121,5
199,3


Summary of computational transaction
Raw Inputview raw input (R code)
Raw Outputview raw output of R engine
Computing time2 seconds
R Server'George Udny Yule' @ 72.249.76.132

\begin{tabular}{lllllllll}
\hline
Summary of computational transaction \tabularnewline
Raw Input & view raw input (R code)  \tabularnewline
Raw Output & view raw output of R engine  \tabularnewline
Computing time & 2 seconds \tabularnewline
R Server & 'George Udny Yule' @ 72.249.76.132 \tabularnewline
\hline
\end{tabular}
%Source: https://freestatistics.org/blog/index.php?pk=98236&T=0

[TABLE]
[ROW][C]Summary of computational transaction[/C][/ROW]
[ROW][C]Raw Input[/C][C]view raw input (R code) [/C][/ROW]
[ROW][C]Raw Output[/C][C]view raw output of R engine [/C][/ROW]
[ROW][C]Computing time[/C][C]2 seconds[/C][/ROW]
[ROW][C]R Server[/C][C]'George Udny Yule' @ 72.249.76.132[/C][/ROW]
[/TABLE]
Source: https://freestatistics.org/blog/index.php?pk=98236&T=0

Globally Unique Identifier (entire table): ba.freestatistics.org/blog/index.php?pk=98236&T=0

As an alternative you can also use a QR Code:  

The GUIDs for individual cells are displayed in the table below:

Summary of computational transaction
Raw Inputview raw input (R code)
Raw Outputview raw output of R engine
Computing time2 seconds
R Server'George Udny Yule' @ 72.249.76.132


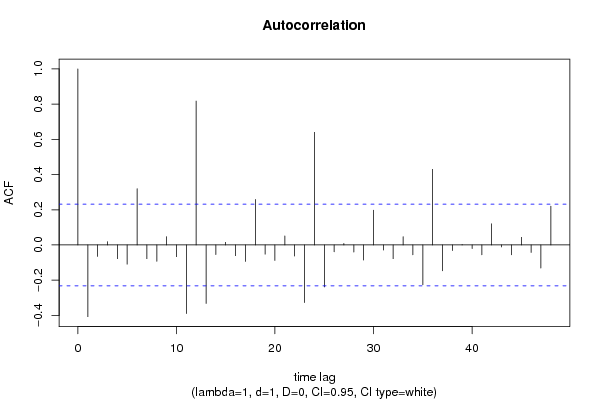
Autocorrelation Function
Time lag kACF(k)T-STATP-value
1-0.407087-3.43020.000504
2-0.065081-0.54840.292575
30.0188510.15880.437122
4-0.077847-0.65590.256988
5-0.109014-0.91860.180716
60.3197382.69420.0044
7-0.078201-0.65890.256035
8-0.092748-0.78150.218552
90.0471210.3970.346263
10-0.066455-0.560.288634
11-0.389797-3.28450.000794
120.8176856.88990
13-0.332186-2.79910.003297
14-0.05413-0.45610.324852
150.0152730.12870.448981
16-0.060685-0.51130.305349
17-0.093655-0.78910.216327
180.2590882.18310.016167
19-0.052609-0.44330.329453
20-0.087804-0.73980.230917
210.0517540.43610.332049
22-0.062808-0.52920.299148
23-0.326944-2.75490.003727
240.6398275.39130
25-0.238622-2.01070.02408
26-0.038961-0.32830.371828
270.0088330.07440.470438
28-0.040045-0.33740.368397
29-0.085623-0.72150.236494
300.1979831.66820.049837
31-0.028952-0.2440.403986
32-0.0776-0.65390.257654
330.047120.3970.346264
34-0.056054-0.47230.319074
35-0.225879-1.90330.030528
360.4299233.62260.000272
37-0.146947-1.23820.10986
38-0.031918-0.26890.394377
390.0027770.02340.490699
40-0.020441-0.17220.43187
41-0.05577-0.46990.319923
420.1201371.01230.157418
43-0.010961-0.09240.463338
44-0.055869-0.47080.319628
450.0433530.36530.357987
46-0.042353-0.35690.361124
47-0.131156-1.10510.136415
480.2203361.85660.033759

\begin{tabular}{lllllllll}
\hline
Autocorrelation Function \tabularnewline
Time lag k & ACF(k) & T-STAT & P-value \tabularnewline
1 & -0.407087 & -3.4302 & 0.000504 \tabularnewline
2 & -0.065081 & -0.5484 & 0.292575 \tabularnewline
3 & 0.018851 & 0.1588 & 0.437122 \tabularnewline
4 & -0.077847 & -0.6559 & 0.256988 \tabularnewline
5 & -0.109014 & -0.9186 & 0.180716 \tabularnewline
6 & 0.319738 & 2.6942 & 0.0044 \tabularnewline
7 & -0.078201 & -0.6589 & 0.256035 \tabularnewline
8 & -0.092748 & -0.7815 & 0.218552 \tabularnewline
9 & 0.047121 & 0.397 & 0.346263 \tabularnewline
10 & -0.066455 & -0.56 & 0.288634 \tabularnewline
11 & -0.389797 & -3.2845 & 0.000794 \tabularnewline
12 & 0.817685 & 6.8899 & 0 \tabularnewline
13 & -0.332186 & -2.7991 & 0.003297 \tabularnewline
14 & -0.05413 & -0.4561 & 0.324852 \tabularnewline
15 & 0.015273 & 0.1287 & 0.448981 \tabularnewline
16 & -0.060685 & -0.5113 & 0.305349 \tabularnewline
17 & -0.093655 & -0.7891 & 0.216327 \tabularnewline
18 & 0.259088 & 2.1831 & 0.016167 \tabularnewline
19 & -0.052609 & -0.4433 & 0.329453 \tabularnewline
20 & -0.087804 & -0.7398 & 0.230917 \tabularnewline
21 & 0.051754 & 0.4361 & 0.332049 \tabularnewline
22 & -0.062808 & -0.5292 & 0.299148 \tabularnewline
23 & -0.326944 & -2.7549 & 0.003727 \tabularnewline
24 & 0.639827 & 5.3913 & 0 \tabularnewline
25 & -0.238622 & -2.0107 & 0.02408 \tabularnewline
26 & -0.038961 & -0.3283 & 0.371828 \tabularnewline
27 & 0.008833 & 0.0744 & 0.470438 \tabularnewline
28 & -0.040045 & -0.3374 & 0.368397 \tabularnewline
29 & -0.085623 & -0.7215 & 0.236494 \tabularnewline
30 & 0.197983 & 1.6682 & 0.049837 \tabularnewline
31 & -0.028952 & -0.244 & 0.403986 \tabularnewline
32 & -0.0776 & -0.6539 & 0.257654 \tabularnewline
33 & 0.04712 & 0.397 & 0.346264 \tabularnewline
34 & -0.056054 & -0.4723 & 0.319074 \tabularnewline
35 & -0.225879 & -1.9033 & 0.030528 \tabularnewline
36 & 0.429923 & 3.6226 & 0.000272 \tabularnewline
37 & -0.146947 & -1.2382 & 0.10986 \tabularnewline
38 & -0.031918 & -0.2689 & 0.394377 \tabularnewline
39 & 0.002777 & 0.0234 & 0.490699 \tabularnewline
40 & -0.020441 & -0.1722 & 0.43187 \tabularnewline
41 & -0.05577 & -0.4699 & 0.319923 \tabularnewline
42 & 0.120137 & 1.0123 & 0.157418 \tabularnewline
43 & -0.010961 & -0.0924 & 0.463338 \tabularnewline
44 & -0.055869 & -0.4708 & 0.319628 \tabularnewline
45 & 0.043353 & 0.3653 & 0.357987 \tabularnewline
46 & -0.042353 & -0.3569 & 0.361124 \tabularnewline
47 & -0.131156 & -1.1051 & 0.136415 \tabularnewline
48 & 0.220336 & 1.8566 & 0.033759 \tabularnewline
\hline
\end{tabular}
%Source: https://freestatistics.org/blog/index.php?pk=98236&T=1

[TABLE]
[ROW][C]Autocorrelation Function[/C][/ROW]
[ROW][C]Time lag k[/C][C]ACF(k)[/C][C]T-STAT[/C][C]P-value[/C][/ROW]
[ROW][C]1[/C][C]-0.407087[/C][C]-3.4302[/C][C]0.000504[/C][/ROW]
[ROW][C]2[/C][C]-0.065081[/C][C]-0.5484[/C][C]0.292575[/C][/ROW]
[ROW][C]3[/C][C]0.018851[/C][C]0.1588[/C][C]0.437122[/C][/ROW]
[ROW][C]4[/C][C]-0.077847[/C][C]-0.6559[/C][C]0.256988[/C][/ROW]
[ROW][C]5[/C][C]-0.109014[/C][C]-0.9186[/C][C]0.180716[/C][/ROW]
[ROW][C]6[/C][C]0.319738[/C][C]2.6942[/C][C]0.0044[/C][/ROW]
[ROW][C]7[/C][C]-0.078201[/C][C]-0.6589[/C][C]0.256035[/C][/ROW]
[ROW][C]8[/C][C]-0.092748[/C][C]-0.7815[/C][C]0.218552[/C][/ROW]
[ROW][C]9[/C][C]0.047121[/C][C]0.397[/C][C]0.346263[/C][/ROW]
[ROW][C]10[/C][C]-0.066455[/C][C]-0.56[/C][C]0.288634[/C][/ROW]
[ROW][C]11[/C][C]-0.389797[/C][C]-3.2845[/C][C]0.000794[/C][/ROW]
[ROW][C]12[/C][C]0.817685[/C][C]6.8899[/C][C]0[/C][/ROW]
[ROW][C]13[/C][C]-0.332186[/C][C]-2.7991[/C][C]0.003297[/C][/ROW]
[ROW][C]14[/C][C]-0.05413[/C][C]-0.4561[/C][C]0.324852[/C][/ROW]
[ROW][C]15[/C][C]0.015273[/C][C]0.1287[/C][C]0.448981[/C][/ROW]
[ROW][C]16[/C][C]-0.060685[/C][C]-0.5113[/C][C]0.305349[/C][/ROW]
[ROW][C]17[/C][C]-0.093655[/C][C]-0.7891[/C][C]0.216327[/C][/ROW]
[ROW][C]18[/C][C]0.259088[/C][C]2.1831[/C][C]0.016167[/C][/ROW]
[ROW][C]19[/C][C]-0.052609[/C][C]-0.4433[/C][C]0.329453[/C][/ROW]
[ROW][C]20[/C][C]-0.087804[/C][C]-0.7398[/C][C]0.230917[/C][/ROW]
[ROW][C]21[/C][C]0.051754[/C][C]0.4361[/C][C]0.332049[/C][/ROW]
[ROW][C]22[/C][C]-0.062808[/C][C]-0.5292[/C][C]0.299148[/C][/ROW]
[ROW][C]23[/C][C]-0.326944[/C][C]-2.7549[/C][C]0.003727[/C][/ROW]
[ROW][C]24[/C][C]0.639827[/C][C]5.3913[/C][C]0[/C][/ROW]
[ROW][C]25[/C][C]-0.238622[/C][C]-2.0107[/C][C]0.02408[/C][/ROW]
[ROW][C]26[/C][C]-0.038961[/C][C]-0.3283[/C][C]0.371828[/C][/ROW]
[ROW][C]27[/C][C]0.008833[/C][C]0.0744[/C][C]0.470438[/C][/ROW]
[ROW][C]28[/C][C]-0.040045[/C][C]-0.3374[/C][C]0.368397[/C][/ROW]
[ROW][C]29[/C][C]-0.085623[/C][C]-0.7215[/C][C]0.236494[/C][/ROW]
[ROW][C]30[/C][C]0.197983[/C][C]1.6682[/C][C]0.049837[/C][/ROW]
[ROW][C]31[/C][C]-0.028952[/C][C]-0.244[/C][C]0.403986[/C][/ROW]
[ROW][C]32[/C][C]-0.0776[/C][C]-0.6539[/C][C]0.257654[/C][/ROW]
[ROW][C]33[/C][C]0.04712[/C][C]0.397[/C][C]0.346264[/C][/ROW]
[ROW][C]34[/C][C]-0.056054[/C][C]-0.4723[/C][C]0.319074[/C][/ROW]
[ROW][C]35[/C][C]-0.225879[/C][C]-1.9033[/C][C]0.030528[/C][/ROW]
[ROW][C]36[/C][C]0.429923[/C][C]3.6226[/C][C]0.000272[/C][/ROW]
[ROW][C]37[/C][C]-0.146947[/C][C]-1.2382[/C][C]0.10986[/C][/ROW]
[ROW][C]38[/C][C]-0.031918[/C][C]-0.2689[/C][C]0.394377[/C][/ROW]
[ROW][C]39[/C][C]0.002777[/C][C]0.0234[/C][C]0.490699[/C][/ROW]
[ROW][C]40[/C][C]-0.020441[/C][C]-0.1722[/C][C]0.43187[/C][/ROW]
[ROW][C]41[/C][C]-0.05577[/C][C]-0.4699[/C][C]0.319923[/C][/ROW]
[ROW][C]42[/C][C]0.120137[/C][C]1.0123[/C][C]0.157418[/C][/ROW]
[ROW][C]43[/C][C]-0.010961[/C][C]-0.0924[/C][C]0.463338[/C][/ROW]
[ROW][C]44[/C][C]-0.055869[/C][C]-0.4708[/C][C]0.319628[/C][/ROW]
[ROW][C]45[/C][C]0.043353[/C][C]0.3653[/C][C]0.357987[/C][/ROW]
[ROW][C]46[/C][C]-0.042353[/C][C]-0.3569[/C][C]0.361124[/C][/ROW]
[ROW][C]47[/C][C]-0.131156[/C][C]-1.1051[/C][C]0.136415[/C][/ROW]
[ROW][C]48[/C][C]0.220336[/C][C]1.8566[/C][C]0.033759[/C][/ROW]
[/TABLE]
Source: https://freestatistics.org/blog/index.php?pk=98236&T=1

Globally Unique Identifier (entire table): ba.freestatistics.org/blog/index.php?pk=98236&T=1

As an alternative you can also use a QR Code:  

The GUIDs for individual cells are displayed in the table below:

Autocorrelation Function
Time lag kACF(k)T-STATP-value
1-0.407087-3.43020.000504
2-0.065081-0.54840.292575
30.0188510.15880.437122
4-0.077847-0.65590.256988
5-0.109014-0.91860.180716
60.3197382.69420.0044
7-0.078201-0.65890.256035
8-0.092748-0.78150.218552
90.0471210.3970.346263
10-0.066455-0.560.288634
11-0.389797-3.28450.000794
120.8176856.88990
13-0.332186-2.79910.003297
14-0.05413-0.45610.324852
150.0152730.12870.448981
16-0.060685-0.51130.305349
17-0.093655-0.78910.216327
180.2590882.18310.016167
19-0.052609-0.44330.329453
20-0.087804-0.73980.230917
210.0517540.43610.332049
22-0.062808-0.52920.299148
23-0.326944-2.75490.003727
240.6398275.39130
25-0.238622-2.01070.02408
26-0.038961-0.32830.371828
270.0088330.07440.470438
28-0.040045-0.33740.368397
29-0.085623-0.72150.236494
300.1979831.66820.049837
31-0.028952-0.2440.403986
32-0.0776-0.65390.257654
330.047120.3970.346264
34-0.056054-0.47230.319074
35-0.225879-1.90330.030528
360.4299233.62260.000272
37-0.146947-1.23820.10986
38-0.031918-0.26890.394377
390.0027770.02340.490699
40-0.020441-0.17220.43187
41-0.05577-0.46990.319923
420.1201371.01230.157418
43-0.010961-0.09240.463338
44-0.055869-0.47080.319628
450.0433530.36530.357987
46-0.042353-0.35690.361124
47-0.131156-1.10510.136415
480.2203361.85660.033759


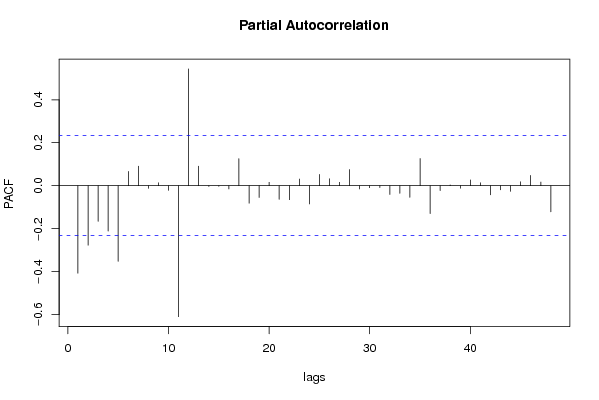
Partial Autocorrelation Function
Time lag kPACF(k)T-STATP-value
1-0.407087-3.43020.000504
2-0.276647-2.33110.011297
3-0.16561-1.39550.083614
4-0.211144-1.77910.039749
5-0.351982-2.96590.002055
60.0664370.55980.288685
70.0908210.76530.223324
8-0.012226-0.1030.45912
90.0137540.11590.454033
10-0.021222-0.17880.429296
11-0.609382-5.13471e-06
120.5434314.5791e-05
130.0907720.76490.223445
14-0.003234-0.02720.489169
15-0.002985-0.02520.490002
16-0.014864-0.12520.450343
170.1259911.06160.146003
18-0.081204-0.68420.248025
19-0.054682-0.46080.323191
200.0158390.13350.447102
21-0.06339-0.53410.29746
22-0.065131-0.54880.292432
230.0311410.26240.396889
24-0.084823-0.71470.238558
250.0522450.44020.330557
260.0322480.27170.393311
270.0158540.13360.447054
280.0752790.63430.263958
29-0.015073-0.1270.449646
30-0.009136-0.0770.469427
31-0.008697-0.07330.470894
32-0.040734-0.34320.36622
33-0.035311-0.29750.383464
34-0.053834-0.45360.325746
350.1265091.0660.145021
36-0.12935-1.08990.139716
37-0.022433-0.1890.425307
380.0034090.02870.488583
39-0.011606-0.09780.461186
400.0270740.22810.4101
410.01340.11290.455209
42-0.042108-0.35480.361894
43-0.019348-0.1630.435478
44-0.026086-0.21980.413328
450.01840.1550.438614
460.0476340.40140.344675
470.0171770.14470.442666
48-0.121309-1.02220.155085

\begin{tabular}{lllllllll}
\hline
Partial Autocorrelation Function \tabularnewline
Time lag k & PACF(k) & T-STAT & P-value \tabularnewline
1 & -0.407087 & -3.4302 & 0.000504 \tabularnewline
2 & -0.276647 & -2.3311 & 0.011297 \tabularnewline
3 & -0.16561 & -1.3955 & 0.083614 \tabularnewline
4 & -0.211144 & -1.7791 & 0.039749 \tabularnewline
5 & -0.351982 & -2.9659 & 0.002055 \tabularnewline
6 & 0.066437 & 0.5598 & 0.288685 \tabularnewline
7 & 0.090821 & 0.7653 & 0.223324 \tabularnewline
8 & -0.012226 & -0.103 & 0.45912 \tabularnewline
9 & 0.013754 & 0.1159 & 0.454033 \tabularnewline
10 & -0.021222 & -0.1788 & 0.429296 \tabularnewline
11 & -0.609382 & -5.1347 & 1e-06 \tabularnewline
12 & 0.543431 & 4.579 & 1e-05 \tabularnewline
13 & 0.090772 & 0.7649 & 0.223445 \tabularnewline
14 & -0.003234 & -0.0272 & 0.489169 \tabularnewline
15 & -0.002985 & -0.0252 & 0.490002 \tabularnewline
16 & -0.014864 & -0.1252 & 0.450343 \tabularnewline
17 & 0.125991 & 1.0616 & 0.146003 \tabularnewline
18 & -0.081204 & -0.6842 & 0.248025 \tabularnewline
19 & -0.054682 & -0.4608 & 0.323191 \tabularnewline
20 & 0.015839 & 0.1335 & 0.447102 \tabularnewline
21 & -0.06339 & -0.5341 & 0.29746 \tabularnewline
22 & -0.065131 & -0.5488 & 0.292432 \tabularnewline
23 & 0.031141 & 0.2624 & 0.396889 \tabularnewline
24 & -0.084823 & -0.7147 & 0.238558 \tabularnewline
25 & 0.052245 & 0.4402 & 0.330557 \tabularnewline
26 & 0.032248 & 0.2717 & 0.393311 \tabularnewline
27 & 0.015854 & 0.1336 & 0.447054 \tabularnewline
28 & 0.075279 & 0.6343 & 0.263958 \tabularnewline
29 & -0.015073 & -0.127 & 0.449646 \tabularnewline
30 & -0.009136 & -0.077 & 0.469427 \tabularnewline
31 & -0.008697 & -0.0733 & 0.470894 \tabularnewline
32 & -0.040734 & -0.3432 & 0.36622 \tabularnewline
33 & -0.035311 & -0.2975 & 0.383464 \tabularnewline
34 & -0.053834 & -0.4536 & 0.325746 \tabularnewline
35 & 0.126509 & 1.066 & 0.145021 \tabularnewline
36 & -0.12935 & -1.0899 & 0.139716 \tabularnewline
37 & -0.022433 & -0.189 & 0.425307 \tabularnewline
38 & 0.003409 & 0.0287 & 0.488583 \tabularnewline
39 & -0.011606 & -0.0978 & 0.461186 \tabularnewline
40 & 0.027074 & 0.2281 & 0.4101 \tabularnewline
41 & 0.0134 & 0.1129 & 0.455209 \tabularnewline
42 & -0.042108 & -0.3548 & 0.361894 \tabularnewline
43 & -0.019348 & -0.163 & 0.435478 \tabularnewline
44 & -0.026086 & -0.2198 & 0.413328 \tabularnewline
45 & 0.0184 & 0.155 & 0.438614 \tabularnewline
46 & 0.047634 & 0.4014 & 0.344675 \tabularnewline
47 & 0.017177 & 0.1447 & 0.442666 \tabularnewline
48 & -0.121309 & -1.0222 & 0.155085 \tabularnewline
\hline
\end{tabular}
%Source: https://freestatistics.org/blog/index.php?pk=98236&T=2

[TABLE]
[ROW][C]Partial Autocorrelation Function[/C][/ROW]
[ROW][C]Time lag k[/C][C]PACF(k)[/C][C]T-STAT[/C][C]P-value[/C][/ROW]
[ROW][C]1[/C][C]-0.407087[/C][C]-3.4302[/C][C]0.000504[/C][/ROW]
[ROW][C]2[/C][C]-0.276647[/C][C]-2.3311[/C][C]0.011297[/C][/ROW]
[ROW][C]3[/C][C]-0.16561[/C][C]-1.3955[/C][C]0.083614[/C][/ROW]
[ROW][C]4[/C][C]-0.211144[/C][C]-1.7791[/C][C]0.039749[/C][/ROW]
[ROW][C]5[/C][C]-0.351982[/C][C]-2.9659[/C][C]0.002055[/C][/ROW]
[ROW][C]6[/C][C]0.066437[/C][C]0.5598[/C][C]0.288685[/C][/ROW]
[ROW][C]7[/C][C]0.090821[/C][C]0.7653[/C][C]0.223324[/C][/ROW]
[ROW][C]8[/C][C]-0.012226[/C][C]-0.103[/C][C]0.45912[/C][/ROW]
[ROW][C]9[/C][C]0.013754[/C][C]0.1159[/C][C]0.454033[/C][/ROW]
[ROW][C]10[/C][C]-0.021222[/C][C]-0.1788[/C][C]0.429296[/C][/ROW]
[ROW][C]11[/C][C]-0.609382[/C][C]-5.1347[/C][C]1e-06[/C][/ROW]
[ROW][C]12[/C][C]0.543431[/C][C]4.579[/C][C]1e-05[/C][/ROW]
[ROW][C]13[/C][C]0.090772[/C][C]0.7649[/C][C]0.223445[/C][/ROW]
[ROW][C]14[/C][C]-0.003234[/C][C]-0.0272[/C][C]0.489169[/C][/ROW]
[ROW][C]15[/C][C]-0.002985[/C][C]-0.0252[/C][C]0.490002[/C][/ROW]
[ROW][C]16[/C][C]-0.014864[/C][C]-0.1252[/C][C]0.450343[/C][/ROW]
[ROW][C]17[/C][C]0.125991[/C][C]1.0616[/C][C]0.146003[/C][/ROW]
[ROW][C]18[/C][C]-0.081204[/C][C]-0.6842[/C][C]0.248025[/C][/ROW]
[ROW][C]19[/C][C]-0.054682[/C][C]-0.4608[/C][C]0.323191[/C][/ROW]
[ROW][C]20[/C][C]0.015839[/C][C]0.1335[/C][C]0.447102[/C][/ROW]
[ROW][C]21[/C][C]-0.06339[/C][C]-0.5341[/C][C]0.29746[/C][/ROW]
[ROW][C]22[/C][C]-0.065131[/C][C]-0.5488[/C][C]0.292432[/C][/ROW]
[ROW][C]23[/C][C]0.031141[/C][C]0.2624[/C][C]0.396889[/C][/ROW]
[ROW][C]24[/C][C]-0.084823[/C][C]-0.7147[/C][C]0.238558[/C][/ROW]
[ROW][C]25[/C][C]0.052245[/C][C]0.4402[/C][C]0.330557[/C][/ROW]
[ROW][C]26[/C][C]0.032248[/C][C]0.2717[/C][C]0.393311[/C][/ROW]
[ROW][C]27[/C][C]0.015854[/C][C]0.1336[/C][C]0.447054[/C][/ROW]
[ROW][C]28[/C][C]0.075279[/C][C]0.6343[/C][C]0.263958[/C][/ROW]
[ROW][C]29[/C][C]-0.015073[/C][C]-0.127[/C][C]0.449646[/C][/ROW]
[ROW][C]30[/C][C]-0.009136[/C][C]-0.077[/C][C]0.469427[/C][/ROW]
[ROW][C]31[/C][C]-0.008697[/C][C]-0.0733[/C][C]0.470894[/C][/ROW]
[ROW][C]32[/C][C]-0.040734[/C][C]-0.3432[/C][C]0.36622[/C][/ROW]
[ROW][C]33[/C][C]-0.035311[/C][C]-0.2975[/C][C]0.383464[/C][/ROW]
[ROW][C]34[/C][C]-0.053834[/C][C]-0.4536[/C][C]0.325746[/C][/ROW]
[ROW][C]35[/C][C]0.126509[/C][C]1.066[/C][C]0.145021[/C][/ROW]
[ROW][C]36[/C][C]-0.12935[/C][C]-1.0899[/C][C]0.139716[/C][/ROW]
[ROW][C]37[/C][C]-0.022433[/C][C]-0.189[/C][C]0.425307[/C][/ROW]
[ROW][C]38[/C][C]0.003409[/C][C]0.0287[/C][C]0.488583[/C][/ROW]
[ROW][C]39[/C][C]-0.011606[/C][C]-0.0978[/C][C]0.461186[/C][/ROW]
[ROW][C]40[/C][C]0.027074[/C][C]0.2281[/C][C]0.4101[/C][/ROW]
[ROW][C]41[/C][C]0.0134[/C][C]0.1129[/C][C]0.455209[/C][/ROW]
[ROW][C]42[/C][C]-0.042108[/C][C]-0.3548[/C][C]0.361894[/C][/ROW]
[ROW][C]43[/C][C]-0.019348[/C][C]-0.163[/C][C]0.435478[/C][/ROW]
[ROW][C]44[/C][C]-0.026086[/C][C]-0.2198[/C][C]0.413328[/C][/ROW]
[ROW][C]45[/C][C]0.0184[/C][C]0.155[/C][C]0.438614[/C][/ROW]
[ROW][C]46[/C][C]0.047634[/C][C]0.4014[/C][C]0.344675[/C][/ROW]
[ROW][C]47[/C][C]0.017177[/C][C]0.1447[/C][C]0.442666[/C][/ROW]
[ROW][C]48[/C][C]-0.121309[/C][C]-1.0222[/C][C]0.155085[/C][/ROW]
[/TABLE]
Source: https://freestatistics.org/blog/index.php?pk=98236&T=2

Globally Unique Identifier (entire table): ba.freestatistics.org/blog/index.php?pk=98236&T=2

As an alternative you can also use a QR Code:  

The GUIDs for individual cells are displayed in the table below:

Partial Autocorrelation Function
Time lag kPACF(k)T-STATP-value
1-0.407087-3.43020.000504
2-0.276647-2.33110.011297
3-0.16561-1.39550.083614
4-0.211144-1.77910.039749
5-0.351982-2.96590.002055
60.0664370.55980.288685
70.0908210.76530.223324
8-0.012226-0.1030.45912
90.0137540.11590.454033
10-0.021222-0.17880.429296
11-0.609382-5.13471e-06
120.5434314.5791e-05
130.0907720.76490.223445
14-0.003234-0.02720.489169
15-0.002985-0.02520.490002
16-0.014864-0.12520.450343
170.1259911.06160.146003
18-0.081204-0.68420.248025
19-0.054682-0.46080.323191
200.0158390.13350.447102
21-0.06339-0.53410.29746
22-0.065131-0.54880.292432
230.0311410.26240.396889
24-0.084823-0.71470.238558
250.0522450.44020.330557
260.0322480.27170.393311
270.0158540.13360.447054
280.0752790.63430.263958
29-0.015073-0.1270.449646
30-0.009136-0.0770.469427
31-0.008697-0.07330.470894
32-0.040734-0.34320.36622
33-0.035311-0.29750.383464
34-0.053834-0.45360.325746
350.1265091.0660.145021
36-0.12935-1.08990.139716
37-0.022433-0.1890.425307
380.0034090.02870.488583
39-0.011606-0.09780.461186
400.0270740.22810.4101
410.01340.11290.455209
42-0.042108-0.35480.361894
43-0.019348-0.1630.435478
44-0.026086-0.21980.413328
450.01840.1550.438614
460.0476340.40140.344675
470.0171770.14470.442666
48-0.121309-1.02220.155085


Parameters (Session):
par1 = 48 ; par2 = 1 ; par3 = 1 ; par4 = 0 ; par5 = 12 ; par6 = White Noise ; par7 = 0.95 ;
Parameters (R input):
par1 = 48 ; par2 = 1 ; par3 = 1 ; par4 = 0 ; par5 = 12 ; par6 = White Noise ; par7 = 0.95 ;
R code (references can be found in the software module):
if (par1 == 'Default') {
par1 = 10*log10(length(x))
} else {
par1 <- as.numeric(par1)
}
par2 <- as.numeric(par2)
par3 <- as.numeric(par3)
par4 <- as.numeric(par4)
par5 <- as.numeric(par5)
if (par6 == 'White Noise') par6 <- 'white' else par6 <- 'ma'
par7 <- as.numeric(par7)
if (par2 == 0) {
x <- log(x)
} else {
x <- (x ^ par2 - 1) / par2
}
if (par3 > 0) x <- diff(x,lag=1,difference=par3)
if (par4 > 0) x <- diff(x,lag=par5,difference=par4)
bitmap(file='pic1.png')
racf <- acf(x, par1, main='Autocorrelation', xlab='time lag', ylab='ACF', ci.type=par6, ci=par7, sub=paste('(lambda=',par2,', d=',par3,', D=',par4,', CI=', par7, ', CI type=',par6,')',sep=''))
dev.off()
bitmap(file='pic2.png')
rpacf <- pacf(x,par1,main='Partial Autocorrelation',xlab='lags',ylab='PACF')
dev.off()
(myacf <- c(racf$acf))
(mypacf <- c(rpacf$acf))
lengthx <- length(x)
sqrtn <- sqrt(lengthx)
load(file='createtable')
a<-table.start()
a<-table.row.start(a)
a<-table.element(a,'Autocorrelation Function',4,TRUE)
a<-table.row.end(a)
a<-table.row.start(a)
a<-table.element(a,'Time lag k',header=TRUE)
a<-table.element(a,hyperlink('basics.htm','ACF(k)','click here for more information about the Autocorrelation Function'),header=TRUE)
a<-table.element(a,'T-STAT',header=TRUE)
a<-table.element(a,'P-value',header=TRUE)
a<-table.row.end(a)
for (i in 2:(par1+1)) {
a<-table.row.start(a)
a<-table.element(a,i-1,header=TRUE)
a<-table.element(a,round(myacf[i],6))
mytstat <- myacf[i]*sqrtn
a<-table.element(a,round(mytstat,4))
a<-table.element(a,round(1-pt(abs(mytstat),lengthx),6))
a<-table.row.end(a)
}
a<-table.end(a)
table.save(a,file='mytable.tab')
a<-table.start()
a<-table.row.start(a)
a<-table.element(a,'Partial Autocorrelation Function',4,TRUE)
a<-table.row.end(a)
a<-table.row.start(a)
a<-table.element(a,'Time lag k',header=TRUE)
a<-table.element(a,hyperlink('basics.htm','PACF(k)','click here for more information about the Partial Autocorrelation Function'),header=TRUE)
a<-table.element(a,'T-STAT',header=TRUE)
a<-table.element(a,'P-value',header=TRUE)
a<-table.row.end(a)
for (i in 1:par1) {
a<-table.row.start(a)
a<-table.element(a,i,header=TRUE)
a<-table.element(a,round(mypacf[i],6))
mytstat <- mypacf[i]*sqrtn
a<-table.element(a,round(mytstat,4))
a<-table.element(a,round(1-pt(abs(mytstat),lengthx),6))
a<-table.row.end(a)
}
a<-table.end(a)
table.save(a,file='mytable1.tab')