| Multiple Linear Regression - Estimated Regression Equation |
| uitvoer[t] = + 2113.94008826516 + 0.87631681502034invoer[t] -673.894099652128crisis[t] + e[t] |
| Multiple Linear Regression - Ordinary Least Squares | |||||
| Variable | Parameter | S.D. | T-STAT H0: parameter = 0 | 2-tail p-value | 1-tail p-value |
| (Intercept) | 2113.94008826516 | 1023.768921 | 2.0649 | 0.043939 | 0.021969 |
| invoer | 0.87631681502034 | 0.056187 | 15.5964 | 0 | 0 |
| crisis | -673.894099652128 | 245.819041 | -2.7414 | 0.008367 | 0.004184 |
| Multiple Linear Regression - Regression Statistics | |
| Multiple R | 0.943748599824329 |
| R-squared | 0.890661419670381 |
| Adjusted R-squared | 0.886456089657704 |
| F-TEST (value) | 211.793466145425 |
| F-TEST (DF numerator) | 2 |
| F-TEST (DF denominator) | 52 |
| p-value | 0 |
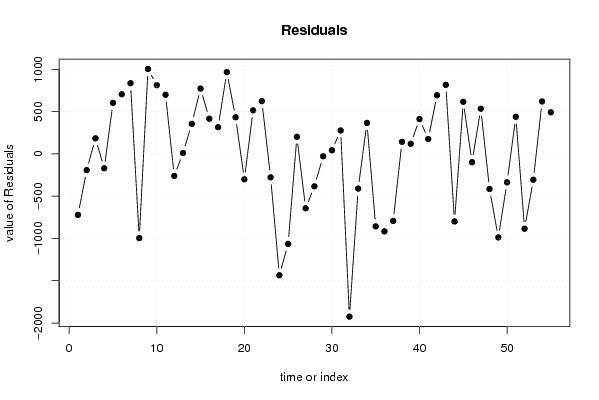
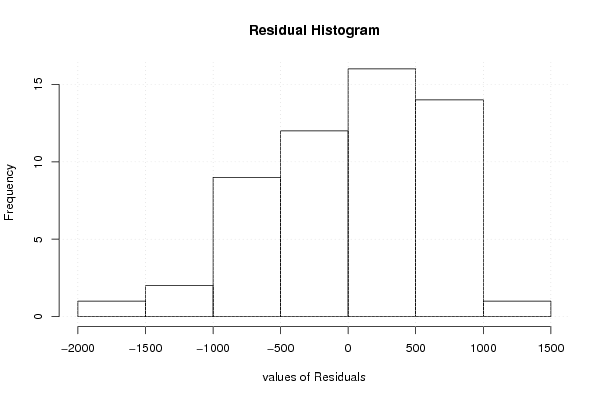
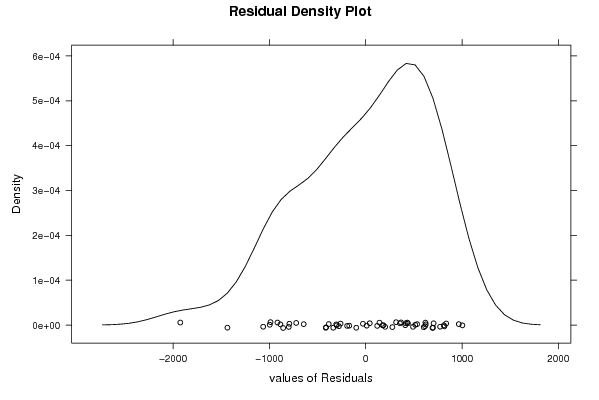
| Multiple Linear Regression - Residual Statistics | |
| Residual Standard Deviation | 680.349569326576 |
| Sum Squared Residuals | 24069527.8971086 |
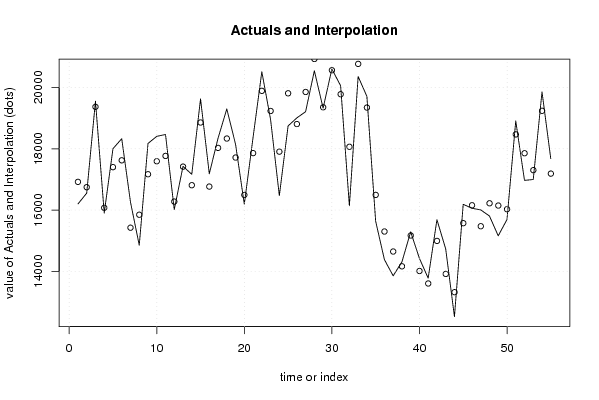
| Multiple Linear Regression - Actuals, Interpolation, and Residuals | |||
| Time or Index | Actuals | Interpolation Forecast | Residuals Prediction Error |
| 1 | 16198.9 | 16920.3642582118 | -721.464258211815 |
| 2 | 16554.2 | 16746.6782654748 | -192.478265474808 |
| 3 | 19554.2 | 19370.0202829197 | 184.179717080307 |
| 4 | 15903.8 | 16074.2803733097 | -170.480373309698 |
| 5 | 18003.8 | 17400.936399569 | 602.863600431011 |
| 6 | 18329.6 | 17624.2219240362 | 705.378075963825 |
| 7 | 16260.7 | 15425.0172450611 | 835.682754938875 |
| 8 | 14851.9 | 15848.1906350344 | -996.29063503445 |
| 9 | 18174.1 | 17169.7640237666 | 1004.33597623337 |
| 10 | 18406.6 | 17593.9889939180 | 812.611006082026 |
| 11 | 18466.5 | 17767.499723292 | 699.000276708 |
| 12 | 16016.5 | 16277.2353476684 | -260.735347668407 |
| 13 | 17428.5 | 17417.5864190544 | 10.9135809456248 |
| 14 | 17167.2 | 16811.6133414678 | 355.586658532191 |
| 15 | 19630 | 18857.6378411773 | 772.362158822697 |
| 16 | 17183.6 | 16767.0964472648 | 416.503552735221 |
| 17 | 18344.7 | 18028.9926608941 | 315.707339105933 |
| 18 | 19301.4 | 18334.4767026102 | 966.923297389841 |
| 19 | 18147.5 | 17714.7454510278 | 432.754548972226 |
| 20 | 16192.9 | 16494.2113910674 | -301.311391067446 |
| 21 | 18374.4 | 17859.3377255061 | 515.062274493871 |
| 22 | 20515.2 | 19891.4287878568 | 623.771212143205 |
| 23 | 18957.2 | 19234.8045983621 | -277.604598362055 |
| 24 | 16471.5 | 17906.8340968802 | -1435.33409688023 |
| 25 | 18746.8 | 19810.5447458304 | -1063.74474583042 |
| 26 | 19009.5 | 18807.4248876766 | 202.075112323365 |
| 27 | 19211.2 | 19854.7111133074 | -643.511113307445 |
| 28 | 20547.7 | 20931.3539522414 | -383.653952241434 |
| 29 | 19325.8 | 19354.2465802493 | -28.4465802493283 |
| 30 | 20605.5 | 20563.2132582514 | 42.2867417486092 |
| 31 | 20056.9 | 19780.0489206677 | 276.851079332289 |
| 32 | 16141.4 | 18066.0608621694 | -1924.66086216943 |
| 33 | 20359.8 | 20770.2869216407 | -410.486921640698 |
| 34 | 19711.6 | 19345.2140481531 | 366.385951846866 |
| 35 | 15638.6 | 16495.5193973885 | -856.91939738849 |
| 36 | 14384.5 | 15300.5737884268 | -916.073788426751 |
| 37 | 13855.6 | 14647.7177612366 | -792.117761236598 |
| 38 | 14308.3 | 14165.1300912049 | 143.169908795102 |
| 39 | 15290.6 | 15170.8788998037 | 119.721100196259 |
| 40 | 14423.8 | 14012.4757020284 | 411.324297971646 |
| 41 | 13779.7 | 13604.1996979104 | 175.500302089624 |
| 42 | 15686.3 | 14993.0742180361 | 693.225781963885 |
| 43 | 14733.8 | 13917.2200642356 | 816.579935764356 |
| 44 | 12522.5 | 13320.8864716143 | -798.386471614302 |
| 45 | 16189.4 | 15572.9330545351 | 616.466945464926 |
| 46 | 16059.1 | 16156.8229483831 | -97.7229483831275 |
| 47 | 16007.1 | 15473.3834643488 | 533.716535651237 |
| 48 | 15806.8 | 16221.6703926946 | -414.870392694634 |
| 49 | 15160 | 16147.8033540899 | -987.803354089904 |
| 50 | 15692.1 | 16028.6242672471 | -336.524267247137 |
| 51 | 18908.9 | 18470.3058089383 | 438.594191061689 |
| 52 | 16969.9 | 17854.7808780680 | -884.880878068023 |
| 53 | 16997.5 | 17302.8765479682 | -305.376547968215 |
| 54 | 19858.9 | 19239.0109190742 | 619.889080925849 |
| 55 | 17681.2 | 17189.7440471491 | 491.455952850914 |
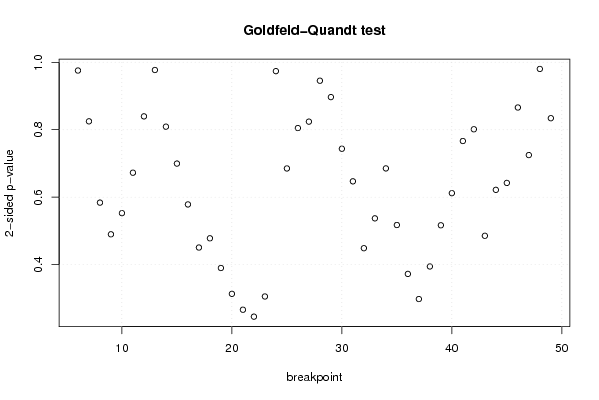
| Goldfeld-Quandt test for Heteroskedasticity | |||
| p-values | Alternative Hypothesis | ||
| breakpoint index | greater | 2-sided | less |
| 6 | 0.512235793360666 | 0.975528413278667 | 0.487764206639334 |
| 7 | 0.587549005183316 | 0.824901989633367 | 0.412450994816684 |
| 8 | 0.70805426670075 | 0.5838914665985 | 0.29194573329925 |
| 9 | 0.755040102646192 | 0.489919794707617 | 0.244959897353808 |
| 10 | 0.723650761982488 | 0.552698476035023 | 0.276349238017512 |
| 11 | 0.663712673533469 | 0.672574652933062 | 0.336287326466531 |
| 12 | 0.58018731647108 | 0.83962536705784 | 0.41981268352892 |
| 13 | 0.488532343090436 | 0.977064686180872 | 0.511467656909564 |
| 14 | 0.404507739516896 | 0.809015479033792 | 0.595492260483104 |
| 15 | 0.34980010667251 | 0.69960021334502 | 0.65019989332749 |
| 16 | 0.289247961199042 | 0.578495922398085 | 0.710752038800958 |
| 17 | 0.225353447621688 | 0.450706895243377 | 0.774646552378312 |
| 18 | 0.239049383386554 | 0.478098766773109 | 0.760950616613446 |
| 19 | 0.195000378615762 | 0.390000757231525 | 0.804999621384238 |
| 20 | 0.156687017787507 | 0.313374035575014 | 0.843312982212493 |
| 21 | 0.133121321551606 | 0.266242643103213 | 0.866878678448394 |
| 22 | 0.122875368183479 | 0.245750736366957 | 0.877124631816521 |
| 23 | 0.152785478219057 | 0.305570956438114 | 0.847214521780943 |
| 24 | 0.486868112354524 | 0.973736224709048 | 0.513131887645476 |
| 25 | 0.657412408805518 | 0.685175182388965 | 0.342587591194482 |
| 26 | 0.597524969274569 | 0.804950061450862 | 0.402475030725431 |
| 27 | 0.588011049380147 | 0.823977901239705 | 0.411988950619853 |
| 28 | 0.527374212395282 | 0.945251575209437 | 0.472625787604718 |
| 29 | 0.448380437201943 | 0.896760874403885 | 0.551619562798057 |
| 30 | 0.371784222772694 | 0.743568445545389 | 0.628215777227306 |
| 31 | 0.323504324539429 | 0.647008649078858 | 0.676495675460571 |
| 32 | 0.775653398198045 | 0.44869320360391 | 0.224346601801955 |
| 33 | 0.73138923154783 | 0.537221536904339 | 0.268610768452170 |
| 34 | 0.657329170890063 | 0.685341658219875 | 0.342670829109937 |
| 35 | 0.74126245970562 | 0.51747508058876 | 0.25873754029438 |
| 36 | 0.813785533175402 | 0.372428933649197 | 0.186214466824598 |
| 37 | 0.851029221124118 | 0.297941557751763 | 0.148970778875882 |
| 38 | 0.802725120957755 | 0.39454975808449 | 0.197274879042245 |
| 39 | 0.74166984589748 | 0.516660308205039 | 0.258330154102519 |
| 40 | 0.694055203915248 | 0.611889592169505 | 0.305944796084752 |
| 41 | 0.616734818239376 | 0.766530363521248 | 0.383265181760624 |
| 42 | 0.59930796289216 | 0.801384074215681 | 0.400692037107840 |
| 43 | 0.757251169298324 | 0.485497661403353 | 0.242748830701676 |
| 44 | 0.689131377523515 | 0.621737244952969 | 0.310868622476485 |
| 45 | 0.678873770592512 | 0.642252458814975 | 0.321126229407488 |
| 46 | 0.567058966539007 | 0.865882066921986 | 0.432941033460993 |
| 47 | 0.63756199985283 | 0.724876000294341 | 0.362438000147170 |
| 48 | 0.490098675387731 | 0.980197350775461 | 0.509901324612269 |
| 49 | 0.417077809199558 | 0.834155618399115 | 0.582922190800442 |
| Meta Analysis of Goldfeld-Quandt test for Heteroskedasticity | |||
| Description | # significant tests | % significant tests | OK/NOK |
| 1% type I error level | 0 | 0 | OK |
| 5% type I error level | 0 | 0 | OK |
| 10% type I error level | 0 | 0 | OK |