Free Statistics

of Irreproducible Research!

Author's title

Author*The author of this computation has been verified*
R Software Modulerwasp_multipleregression.wasp
Title produced by softwareMultiple Regression
Date of computationSat, 20 Nov 2010 09:52:53 +0000
Cite this page as followsStatistical Computations at FreeStatistics.org, Office for Research Development and Education, URL https://freestatistics.org/blog/index.php?v=date/2010/Nov/20/t1290246724k9sxz97n5xmfgr5.htm/, Retrieved Sat, 27 Apr 2024 07:41:22 +0000
Statistical Computations at FreeStatistics.org, Office for Research Development and Education, URL https://freestatistics.org/blog/index.php?pk=98165, Retrieved Sat, 27 Apr 2024 07:41:22 +0000
QR Codes:

Original text written by user:
IsPrivate?No (this computation is public)
User-defined keywords
Estimated Impact175
Family? (F = Feedback message, R = changed R code, M = changed R Module, P = changed Parameters, D = changed Data)
-     [Multiple Regression] [Competence to learn] [2010-11-17 07:43:53] [b98453cac15ba1066b407e146608df68]
-   PD  [Multiple Regression] [Meervoudige regre...] [2010-11-19 12:47:27] [2960375a246cc0628590c95c4038a43c]
-    D      [Multiple Regression] [Workshop 7: Multi...] [2010-11-20 09:52:53] [8eb352cba3cf694c3df89d0a436a2f1b] [Current]
-   P         [Multiple Regression] [Workshop 7: Multi...] [2010-11-20 10:15:55] [62f7c80c4d96454bbd2b2b026ea9aad9]
-    D          [Multiple Regression] [Workshop 7: Multi...] [2010-11-20 11:21:05] [62f7c80c4d96454bbd2b2b026ea9aad9]
-    D            [Multiple Regression] [Invoer X crisis] [2010-11-25 08:22:21] [62f7c80c4d96454bbd2b2b026ea9aad9]
Feedback Forum

Post a new message
Dataseries X:
16198.9	16896.2
16554.2	16698
19554.2	19691.6
15903.8	15930.7
18003.8	17444.6
18329.6	17699.4
16260.7	15189.8
14851.9	15672.7
18174.1	17180.8
18406.6	17664.9
18466.5	17862.9
16016.5	16162.3
17428.5	17463.6
17167.2	16772.1
19630	19106.9
17183.6	16721.3
18344.7	18161.3
19301.4	18509.9
18147.5	17802.7
16192.9	16409.9
18374.4	17967.7
20515.2	20286.6
18957.2	19537.3
16471.5	18021.9
18746.8	20194.3
19009.5	19049.6
19211.2	20244.7
20547.7	21473.3
19325.8	19673.6
20605.5	21053.2
20056.9	20159.5
16141.4	18203.6
20359.8	21289.5
19711.6	20432.3
15638.6	17180.4
14384.5	15816.8
13855.6	15071.8
14308.3	14521.1
15290.6	15668.8
14423.8	14346.9
13779.7	13881
15686.3	15465.9
14733.8	14238.2
12522.5	13557.7
16189.4	16127.6
16059.1	16793.9
16007.1	16014
15806.8	16867.9
15160	16014.6
15692.1	15878.6
18908.9	18664.9
16969.9	17962.5
16997.5	17332.7
19858.9	19542.1
17681.2	17203.6


Summary of computational transaction
Raw Inputview raw input (R code)
Raw Outputview raw output of R engine
Computing time7 seconds
R Server'RServer@AstonUniversity' @ vre.aston.ac.uk

\begin{tabular}{lllllllll}
\hline
Summary of computational transaction \tabularnewline
Raw Input & view raw input (R code)  \tabularnewline
Raw Output & view raw output of R engine  \tabularnewline
Computing time & 7 seconds \tabularnewline
R Server & 'RServer@AstonUniversity' @ vre.aston.ac.uk \tabularnewline
\hline
\end{tabular}
%Source: https://freestatistics.org/blog/index.php?pk=98165&T=0

[TABLE]
[ROW][C]Summary of computational transaction[/C][/ROW]
[ROW][C]Raw Input[/C][C]view raw input (R code) [/C][/ROW]
[ROW][C]Raw Output[/C][C]view raw output of R engine [/C][/ROW]
[ROW][C]Computing time[/C][C]7 seconds[/C][/ROW]
[ROW][C]R Server[/C][C]'RServer@AstonUniversity' @ vre.aston.ac.uk[/C][/ROW]
[/TABLE]
Source: https://freestatistics.org/blog/index.php?pk=98165&T=0

Globally Unique Identifier (entire table): ba.freestatistics.org/blog/index.php?pk=98165&T=0

As an alternative you can also use a QR Code:  

The GUIDs for individual cells are displayed in the table below:

Summary of computational transaction
Raw Inputview raw input (R code)
Raw Outputview raw output of R engine
Computing time7 seconds
R Server'RServer@AstonUniversity' @ vre.aston.ac.uk


Multiple Linear Regression - Estimated Regression Equation
uitvoer[t] = + 748.072152423624 + 0.892597476409893invoer[t] + 241.389011880087M1[t] + 995.458410491878M2[t] + 1101.31078858059M3[t] + 827.408828727138M4[t] + 1101.50543825314M5[t] + 1536.18475816057M6[t] + 1526.30536759173M7[t] -67.6231584650186M8[t] + 1333.38498903394M9[t] + 1149.19652200137M10[t] + 766.137395534915M11[t] + e[t]

\begin{tabular}{lllllllll}
\hline
Multiple Linear Regression - Estimated Regression Equation \tabularnewline
uitvoer[t] =  +  748.072152423624 +  0.892597476409893invoer[t] +  241.389011880087M1[t] +  995.458410491878M2[t] +  1101.31078858059M3[t] +  827.408828727138M4[t] +  1101.50543825314M5[t] +  1536.18475816057M6[t] +  1526.30536759173M7[t] -67.6231584650186M8[t] +  1333.38498903394M9[t] +  1149.19652200137M10[t] +  766.137395534915M11[t]  + e[t] \tabularnewline
\hline
\end{tabular}
%Source: https://freestatistics.org/blog/index.php?pk=98165&T=1

[TABLE]
[ROW][C]Multiple Linear Regression - Estimated Regression Equation[/C][/ROW]
[ROW][C]uitvoer[t] =  +  748.072152423624 +  0.892597476409893invoer[t] +  241.389011880087M1[t] +  995.458410491878M2[t] +  1101.31078858059M3[t] +  827.408828727138M4[t] +  1101.50543825314M5[t] +  1536.18475816057M6[t] +  1526.30536759173M7[t] -67.6231584650186M8[t] +  1333.38498903394M9[t] +  1149.19652200137M10[t] +  766.137395534915M11[t]  + e[t][/C][/ROW]
[/TABLE]
Source: https://freestatistics.org/blog/index.php?pk=98165&T=1

Globally Unique Identifier (entire table): ba.freestatistics.org/blog/index.php?pk=98165&T=1

As an alternative you can also use a QR Code:  

The GUIDs for individual cells are displayed in the table below:

Multiple Linear Regression - Estimated Regression Equation
uitvoer[t] = + 748.072152423624 + 0.892597476409893invoer[t] + 241.389011880087M1[t] + 995.458410491878M2[t] + 1101.31078858059M3[t] + 827.408828727138M4[t] + 1101.50543825314M5[t] + 1536.18475816057M6[t] + 1526.30536759173M7[t] -67.6231584650186M8[t] + 1333.38498903394M9[t] + 1149.19652200137M10[t] + 766.137395534915M11[t] + e[t]


Multiple Linear Regression - Ordinary Least Squares
VariableParameterS.D.T-STATH0: parameter = 02-tail p-value1-tail p-value
(Intercept)748.072152423624789.3502690.94770.34870.17435
invoer0.8925974764098930.04399120.290700
M1241.389011880087385.2237230.62660.5342990.26715
M2995.458410491878384.8441692.58670.0132470.006623
M31101.31078858059394.323182.79290.0078330.003916
M4827.408828727138385.6147462.14570.0377240.018862
M51101.50543825314385.6485392.85620.0066370.003319
M61536.18475816057392.3117493.91570.0003250.000163
M71526.30536759173384.9015783.96540.000280.00014
M8-67.6231584650186406.976247-0.16620.8688280.434414
M91333.38498903394410.4241283.24880.0022840.001142
M101149.19652200137415.7796222.7640.0084430.004222
M11766.137395534915407.678521.87930.0671580.033579

\begin{tabular}{lllllllll}
\hline
Multiple Linear Regression - Ordinary Least Squares \tabularnewline
Variable & Parameter & S.D. & T-STATH0: parameter = 0 & 2-tail p-value & 1-tail p-value \tabularnewline
(Intercept) & 748.072152423624 & 789.350269 & 0.9477 & 0.3487 & 0.17435 \tabularnewline
invoer & 0.892597476409893 & 0.043991 & 20.2907 & 0 & 0 \tabularnewline
M1 & 241.389011880087 & 385.223723 & 0.6266 & 0.534299 & 0.26715 \tabularnewline
M2 & 995.458410491878 & 384.844169 & 2.5867 & 0.013247 & 0.006623 \tabularnewline
M3 & 1101.31078858059 & 394.32318 & 2.7929 & 0.007833 & 0.003916 \tabularnewline
M4 & 827.408828727138 & 385.614746 & 2.1457 & 0.037724 & 0.018862 \tabularnewline
M5 & 1101.50543825314 & 385.648539 & 2.8562 & 0.006637 & 0.003319 \tabularnewline
M6 & 1536.18475816057 & 392.311749 & 3.9157 & 0.000325 & 0.000163 \tabularnewline
M7 & 1526.30536759173 & 384.901578 & 3.9654 & 0.00028 & 0.00014 \tabularnewline
M8 & -67.6231584650186 & 406.976247 & -0.1662 & 0.868828 & 0.434414 \tabularnewline
M9 & 1333.38498903394 & 410.424128 & 3.2488 & 0.002284 & 0.001142 \tabularnewline
M10 & 1149.19652200137 & 415.779622 & 2.764 & 0.008443 & 0.004222 \tabularnewline
M11 & 766.137395534915 & 407.67852 & 1.8793 & 0.067158 & 0.033579 \tabularnewline
\hline
\end{tabular}
%Source: https://freestatistics.org/blog/index.php?pk=98165&T=2

[TABLE]
[ROW][C]Multiple Linear Regression - Ordinary Least Squares[/C][/ROW]
[ROW][C]Variable[/C][C]Parameter[/C][C]S.D.[/C][C]T-STATH0: parameter = 0[/C][C]2-tail p-value[/C][C]1-tail p-value[/C][/ROW]
[ROW][C](Intercept)[/C][C]748.072152423624[/C][C]789.350269[/C][C]0.9477[/C][C]0.3487[/C][C]0.17435[/C][/ROW]
[ROW][C]invoer[/C][C]0.892597476409893[/C][C]0.043991[/C][C]20.2907[/C][C]0[/C][C]0[/C][/ROW]
[ROW][C]M1[/C][C]241.389011880087[/C][C]385.223723[/C][C]0.6266[/C][C]0.534299[/C][C]0.26715[/C][/ROW]
[ROW][C]M2[/C][C]995.458410491878[/C][C]384.844169[/C][C]2.5867[/C][C]0.013247[/C][C]0.006623[/C][/ROW]
[ROW][C]M3[/C][C]1101.31078858059[/C][C]394.32318[/C][C]2.7929[/C][C]0.007833[/C][C]0.003916[/C][/ROW]
[ROW][C]M4[/C][C]827.408828727138[/C][C]385.614746[/C][C]2.1457[/C][C]0.037724[/C][C]0.018862[/C][/ROW]
[ROW][C]M5[/C][C]1101.50543825314[/C][C]385.648539[/C][C]2.8562[/C][C]0.006637[/C][C]0.003319[/C][/ROW]
[ROW][C]M6[/C][C]1536.18475816057[/C][C]392.311749[/C][C]3.9157[/C][C]0.000325[/C][C]0.000163[/C][/ROW]
[ROW][C]M7[/C][C]1526.30536759173[/C][C]384.901578[/C][C]3.9654[/C][C]0.00028[/C][C]0.00014[/C][/ROW]
[ROW][C]M8[/C][C]-67.6231584650186[/C][C]406.976247[/C][C]-0.1662[/C][C]0.868828[/C][C]0.434414[/C][/ROW]
[ROW][C]M9[/C][C]1333.38498903394[/C][C]410.424128[/C][C]3.2488[/C][C]0.002284[/C][C]0.001142[/C][/ROW]
[ROW][C]M10[/C][C]1149.19652200137[/C][C]415.779622[/C][C]2.764[/C][C]0.008443[/C][C]0.004222[/C][/ROW]
[ROW][C]M11[/C][C]766.137395534915[/C][C]407.67852[/C][C]1.8793[/C][C]0.067158[/C][C]0.033579[/C][/ROW]
[/TABLE]
Source: https://freestatistics.org/blog/index.php?pk=98165&T=2

Globally Unique Identifier (entire table): ba.freestatistics.org/blog/index.php?pk=98165&T=2

As an alternative you can also use a QR Code:  

The GUIDs for individual cells are displayed in the table below:

Multiple Linear Regression - Ordinary Least Squares
VariableParameterS.D.T-STATH0: parameter = 02-tail p-value1-tail p-value
(Intercept)748.072152423624789.3502690.94770.34870.17435
invoer0.8925974764098930.04399120.290700
M1241.389011880087385.2237230.62660.5342990.26715
M2995.458410491878384.8441692.58670.0132470.006623
M31101.31078858059394.323182.79290.0078330.003916
M4827.408828727138385.6147462.14570.0377240.018862
M51101.50543825314385.6485392.85620.0066370.003319
M61536.18475816057392.3117493.91570.0003250.000163
M71526.30536759173384.9015783.96540.000280.00014
M8-67.6231584650186406.976247-0.16620.8688280.434414
M91333.38498903394410.4241283.24880.0022840.001142
M101149.19652200137415.7796222.7640.0084430.004222
M11766.137395534915407.678521.87930.0671580.033579


Multiple Linear Regression - Regression Statistics
Multiple R0.968101963445662
R-squared0.937221411627346
Adjusted R-squared0.919284672092302
F-TEST (value)52.2514925188187
F-TEST (DF numerator)12
F-TEST (DF denominator)42
p-value0
Multiple Linear Regression - Residual Statistics
Residual Standard Deviation573.625168812105
Sum Squared Residuals13819925.0403781

\begin{tabular}{lllllllll}
\hline
Multiple Linear Regression - Regression Statistics \tabularnewline
Multiple R & 0.968101963445662 \tabularnewline
R-squared & 0.937221411627346 \tabularnewline
Adjusted R-squared & 0.919284672092302 \tabularnewline
F-TEST (value) & 52.2514925188187 \tabularnewline
F-TEST (DF numerator) & 12 \tabularnewline
F-TEST (DF denominator) & 42 \tabularnewline
p-value & 0 \tabularnewline
Multiple Linear Regression - Residual Statistics \tabularnewline
Residual Standard Deviation & 573.625168812105 \tabularnewline
Sum Squared Residuals & 13819925.0403781 \tabularnewline
\hline
\end{tabular}
%Source: https://freestatistics.org/blog/index.php?pk=98165&T=3

[TABLE]
[ROW][C]Multiple Linear Regression - Regression Statistics[/C][/ROW]
[ROW][C]Multiple R[/C][C]0.968101963445662[/C][/ROW]
[ROW][C]R-squared[/C][C]0.937221411627346[/C][/ROW]
[ROW][C]Adjusted R-squared[/C][C]0.919284672092302[/C][/ROW]
[ROW][C]F-TEST (value)[/C][C]52.2514925188187[/C][/ROW]
[ROW][C]F-TEST (DF numerator)[/C][C]12[/C][/ROW]
[ROW][C]F-TEST (DF denominator)[/C][C]42[/C][/ROW]
[ROW][C]p-value[/C][C]0[/C][/ROW]
[ROW][C]Multiple Linear Regression - Residual Statistics[/C][/ROW]
[ROW][C]Residual Standard Deviation[/C][C]573.625168812105[/C][/ROW]
[ROW][C]Sum Squared Residuals[/C][C]13819925.0403781[/C][/ROW]
[/TABLE]
Source: https://freestatistics.org/blog/index.php?pk=98165&T=3

Globally Unique Identifier (entire table): ba.freestatistics.org/blog/index.php?pk=98165&T=3

As an alternative you can also use a QR Code:  

The GUIDs for individual cells are displayed in the table below:

Multiple Linear Regression - Regression Statistics
Multiple R0.968101963445662
R-squared0.937221411627346
Adjusted R-squared0.919284672092302
F-TEST (value)52.2514925188187
F-TEST (DF numerator)12
F-TEST (DF denominator)42
p-value0
Multiple Linear Regression - Residual Statistics
Residual Standard Deviation573.625168812105
Sum Squared Residuals13819925.0403781


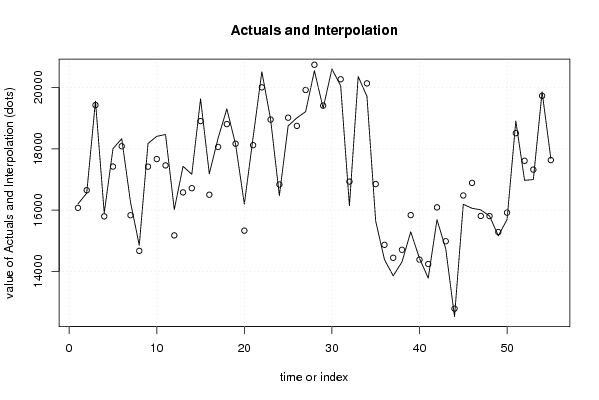
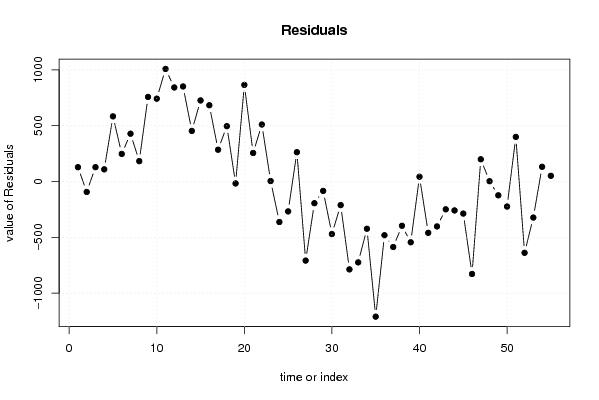
Multiple Linear Regression - Actuals, Interpolation, and Residuals
Time or IndexActualsInterpolationForecastResidualsPrediction Error
116198.916070.9666452205127.933354779463
216554.216648.1232240079-93.9232240078967
319554.219426.0554074773128.14459252274
415903.815795.1835985938108.616401406153
518003.817420.5835276568583.216472343212
618329.618082.6966845535246.903315446544
716260.715832.7546671864427.94533281365
814851.914669.8614624879182.038537512062
918174.117416.9958641607757.104135839344
1018406.617664.9138354581741.686164541883
1118466.517458.58900932081007.91099067918
1216016.515174.5003454032841.999654596761
1317428.516577.4264533355851.07354666448
1417167.216714.2646970099452.935302990131
151963018904.1536630204725.846336979601
1617183.616500.8711634435682.728836556491
1718344.718060.3081389998284.391861000242
1819301.418806.1469391837495.253060816329
1918147.518165.0226132978-17.5226132977622
2016192.915327.8843220973865.015677902687
2118374.418119.3808183476255.0191816524
2220515.220005.0366393619510.16336063807
2318957.218953.15422382154.04577617845619
2416471.516834.3746125351-362.874612535079
2518746.819014.842382168-268.042382168018
2619009.518747.1554495334262.344550466598
2719211.219919.7510716796-708.551071679574
2820547.720742.4943713433-194.79437134332
2919325.819410.1833025744-84.3833025744407
3020605.521076.290100937-470.790100936955
3120056.920268.6963457006-211.796345700597
3216141.416928.9364155337-787.536415533736
3320359.821084.411115486-724.611115485986
3419711.620135.0880916749-423.488091674855
3515638.616849.3912316711-1210.79123167107
3614384.514866.1079173036-481.607917303621
3713855.614442.5118092583-586.911809258338
3814308.314705.0277776112-396.727777611202
3915290.615835.3142793755-544.714279375542
4014423.814381.487715455942.3122845441422
4113779.714239.7231607225-460.023160722492
4215686.316089.080220992-402.780220991957
4314733.814983.3589086347-249.558908634698
4412522.512782.017799881-259.517799881014
4516189.416476.9122020058-287.512202005757
4616059.116887.4614335051-828.361433505098
4716007.115808.2655351866198.834464813433
4815806.815804.31712475812.48287524193745
491516015284.0527100176-124.052710017586
5015692.115916.7288518376-224.628851837631
5118908.918509.6255784472399.274421552776
5216969.917608.7631511635-638.863151163466
5316997.517320.7018700465-323.201870046522
5419858.919727.486054334131.413945666039
5517681.217630.267465180650.9325348194077

\begin{tabular}{lllllllll}
\hline
Multiple Linear Regression - Actuals, Interpolation, and Residuals \tabularnewline
Time or Index & Actuals & InterpolationForecast & ResidualsPrediction Error \tabularnewline
1 & 16198.9 & 16070.9666452205 & 127.933354779463 \tabularnewline
2 & 16554.2 & 16648.1232240079 & -93.9232240078967 \tabularnewline
3 & 19554.2 & 19426.0554074773 & 128.14459252274 \tabularnewline
4 & 15903.8 & 15795.1835985938 & 108.616401406153 \tabularnewline
5 & 18003.8 & 17420.5835276568 & 583.216472343212 \tabularnewline
6 & 18329.6 & 18082.6966845535 & 246.903315446544 \tabularnewline
7 & 16260.7 & 15832.7546671864 & 427.94533281365 \tabularnewline
8 & 14851.9 & 14669.8614624879 & 182.038537512062 \tabularnewline
9 & 18174.1 & 17416.9958641607 & 757.104135839344 \tabularnewline
10 & 18406.6 & 17664.9138354581 & 741.686164541883 \tabularnewline
11 & 18466.5 & 17458.5890093208 & 1007.91099067918 \tabularnewline
12 & 16016.5 & 15174.5003454032 & 841.999654596761 \tabularnewline
13 & 17428.5 & 16577.4264533355 & 851.07354666448 \tabularnewline
14 & 17167.2 & 16714.2646970099 & 452.935302990131 \tabularnewline
15 & 19630 & 18904.1536630204 & 725.846336979601 \tabularnewline
16 & 17183.6 & 16500.8711634435 & 682.728836556491 \tabularnewline
17 & 18344.7 & 18060.3081389998 & 284.391861000242 \tabularnewline
18 & 19301.4 & 18806.1469391837 & 495.253060816329 \tabularnewline
19 & 18147.5 & 18165.0226132978 & -17.5226132977622 \tabularnewline
20 & 16192.9 & 15327.8843220973 & 865.015677902687 \tabularnewline
21 & 18374.4 & 18119.3808183476 & 255.0191816524 \tabularnewline
22 & 20515.2 & 20005.0366393619 & 510.16336063807 \tabularnewline
23 & 18957.2 & 18953.1542238215 & 4.04577617845619 \tabularnewline
24 & 16471.5 & 16834.3746125351 & -362.874612535079 \tabularnewline
25 & 18746.8 & 19014.842382168 & -268.042382168018 \tabularnewline
26 & 19009.5 & 18747.1554495334 & 262.344550466598 \tabularnewline
27 & 19211.2 & 19919.7510716796 & -708.551071679574 \tabularnewline
28 & 20547.7 & 20742.4943713433 & -194.79437134332 \tabularnewline
29 & 19325.8 & 19410.1833025744 & -84.3833025744407 \tabularnewline
30 & 20605.5 & 21076.290100937 & -470.790100936955 \tabularnewline
31 & 20056.9 & 20268.6963457006 & -211.796345700597 \tabularnewline
32 & 16141.4 & 16928.9364155337 & -787.536415533736 \tabularnewline
33 & 20359.8 & 21084.411115486 & -724.611115485986 \tabularnewline
34 & 19711.6 & 20135.0880916749 & -423.488091674855 \tabularnewline
35 & 15638.6 & 16849.3912316711 & -1210.79123167107 \tabularnewline
36 & 14384.5 & 14866.1079173036 & -481.607917303621 \tabularnewline
37 & 13855.6 & 14442.5118092583 & -586.911809258338 \tabularnewline
38 & 14308.3 & 14705.0277776112 & -396.727777611202 \tabularnewline
39 & 15290.6 & 15835.3142793755 & -544.714279375542 \tabularnewline
40 & 14423.8 & 14381.4877154559 & 42.3122845441422 \tabularnewline
41 & 13779.7 & 14239.7231607225 & -460.023160722492 \tabularnewline
42 & 15686.3 & 16089.080220992 & -402.780220991957 \tabularnewline
43 & 14733.8 & 14983.3589086347 & -249.558908634698 \tabularnewline
44 & 12522.5 & 12782.017799881 & -259.517799881014 \tabularnewline
45 & 16189.4 & 16476.9122020058 & -287.512202005757 \tabularnewline
46 & 16059.1 & 16887.4614335051 & -828.361433505098 \tabularnewline
47 & 16007.1 & 15808.2655351866 & 198.834464813433 \tabularnewline
48 & 15806.8 & 15804.3171247581 & 2.48287524193745 \tabularnewline
49 & 15160 & 15284.0527100176 & -124.052710017586 \tabularnewline
50 & 15692.1 & 15916.7288518376 & -224.628851837631 \tabularnewline
51 & 18908.9 & 18509.6255784472 & 399.274421552776 \tabularnewline
52 & 16969.9 & 17608.7631511635 & -638.863151163466 \tabularnewline
53 & 16997.5 & 17320.7018700465 & -323.201870046522 \tabularnewline
54 & 19858.9 & 19727.486054334 & 131.413945666039 \tabularnewline
55 & 17681.2 & 17630.2674651806 & 50.9325348194077 \tabularnewline
\hline
\end{tabular}
%Source: https://freestatistics.org/blog/index.php?pk=98165&T=4

[TABLE]
[ROW][C]Multiple Linear Regression - Actuals, Interpolation, and Residuals[/C][/ROW]
[ROW][C]Time or Index[/C][C]Actuals[/C][C]InterpolationForecast[/C][C]ResidualsPrediction Error[/C][/ROW]
[ROW][C]1[/C][C]16198.9[/C][C]16070.9666452205[/C][C]127.933354779463[/C][/ROW]
[ROW][C]2[/C][C]16554.2[/C][C]16648.1232240079[/C][C]-93.9232240078967[/C][/ROW]
[ROW][C]3[/C][C]19554.2[/C][C]19426.0554074773[/C][C]128.14459252274[/C][/ROW]
[ROW][C]4[/C][C]15903.8[/C][C]15795.1835985938[/C][C]108.616401406153[/C][/ROW]
[ROW][C]5[/C][C]18003.8[/C][C]17420.5835276568[/C][C]583.216472343212[/C][/ROW]
[ROW][C]6[/C][C]18329.6[/C][C]18082.6966845535[/C][C]246.903315446544[/C][/ROW]
[ROW][C]7[/C][C]16260.7[/C][C]15832.7546671864[/C][C]427.94533281365[/C][/ROW]
[ROW][C]8[/C][C]14851.9[/C][C]14669.8614624879[/C][C]182.038537512062[/C][/ROW]
[ROW][C]9[/C][C]18174.1[/C][C]17416.9958641607[/C][C]757.104135839344[/C][/ROW]
[ROW][C]10[/C][C]18406.6[/C][C]17664.9138354581[/C][C]741.686164541883[/C][/ROW]
[ROW][C]11[/C][C]18466.5[/C][C]17458.5890093208[/C][C]1007.91099067918[/C][/ROW]
[ROW][C]12[/C][C]16016.5[/C][C]15174.5003454032[/C][C]841.999654596761[/C][/ROW]
[ROW][C]13[/C][C]17428.5[/C][C]16577.4264533355[/C][C]851.07354666448[/C][/ROW]
[ROW][C]14[/C][C]17167.2[/C][C]16714.2646970099[/C][C]452.935302990131[/C][/ROW]
[ROW][C]15[/C][C]19630[/C][C]18904.1536630204[/C][C]725.846336979601[/C][/ROW]
[ROW][C]16[/C][C]17183.6[/C][C]16500.8711634435[/C][C]682.728836556491[/C][/ROW]
[ROW][C]17[/C][C]18344.7[/C][C]18060.3081389998[/C][C]284.391861000242[/C][/ROW]
[ROW][C]18[/C][C]19301.4[/C][C]18806.1469391837[/C][C]495.253060816329[/C][/ROW]
[ROW][C]19[/C][C]18147.5[/C][C]18165.0226132978[/C][C]-17.5226132977622[/C][/ROW]
[ROW][C]20[/C][C]16192.9[/C][C]15327.8843220973[/C][C]865.015677902687[/C][/ROW]
[ROW][C]21[/C][C]18374.4[/C][C]18119.3808183476[/C][C]255.0191816524[/C][/ROW]
[ROW][C]22[/C][C]20515.2[/C][C]20005.0366393619[/C][C]510.16336063807[/C][/ROW]
[ROW][C]23[/C][C]18957.2[/C][C]18953.1542238215[/C][C]4.04577617845619[/C][/ROW]
[ROW][C]24[/C][C]16471.5[/C][C]16834.3746125351[/C][C]-362.874612535079[/C][/ROW]
[ROW][C]25[/C][C]18746.8[/C][C]19014.842382168[/C][C]-268.042382168018[/C][/ROW]
[ROW][C]26[/C][C]19009.5[/C][C]18747.1554495334[/C][C]262.344550466598[/C][/ROW]
[ROW][C]27[/C][C]19211.2[/C][C]19919.7510716796[/C][C]-708.551071679574[/C][/ROW]
[ROW][C]28[/C][C]20547.7[/C][C]20742.4943713433[/C][C]-194.79437134332[/C][/ROW]
[ROW][C]29[/C][C]19325.8[/C][C]19410.1833025744[/C][C]-84.3833025744407[/C][/ROW]
[ROW][C]30[/C][C]20605.5[/C][C]21076.290100937[/C][C]-470.790100936955[/C][/ROW]
[ROW][C]31[/C][C]20056.9[/C][C]20268.6963457006[/C][C]-211.796345700597[/C][/ROW]
[ROW][C]32[/C][C]16141.4[/C][C]16928.9364155337[/C][C]-787.536415533736[/C][/ROW]
[ROW][C]33[/C][C]20359.8[/C][C]21084.411115486[/C][C]-724.611115485986[/C][/ROW]
[ROW][C]34[/C][C]19711.6[/C][C]20135.0880916749[/C][C]-423.488091674855[/C][/ROW]
[ROW][C]35[/C][C]15638.6[/C][C]16849.3912316711[/C][C]-1210.79123167107[/C][/ROW]
[ROW][C]36[/C][C]14384.5[/C][C]14866.1079173036[/C][C]-481.607917303621[/C][/ROW]
[ROW][C]37[/C][C]13855.6[/C][C]14442.5118092583[/C][C]-586.911809258338[/C][/ROW]
[ROW][C]38[/C][C]14308.3[/C][C]14705.0277776112[/C][C]-396.727777611202[/C][/ROW]
[ROW][C]39[/C][C]15290.6[/C][C]15835.3142793755[/C][C]-544.714279375542[/C][/ROW]
[ROW][C]40[/C][C]14423.8[/C][C]14381.4877154559[/C][C]42.3122845441422[/C][/ROW]
[ROW][C]41[/C][C]13779.7[/C][C]14239.7231607225[/C][C]-460.023160722492[/C][/ROW]
[ROW][C]42[/C][C]15686.3[/C][C]16089.080220992[/C][C]-402.780220991957[/C][/ROW]
[ROW][C]43[/C][C]14733.8[/C][C]14983.3589086347[/C][C]-249.558908634698[/C][/ROW]
[ROW][C]44[/C][C]12522.5[/C][C]12782.017799881[/C][C]-259.517799881014[/C][/ROW]
[ROW][C]45[/C][C]16189.4[/C][C]16476.9122020058[/C][C]-287.512202005757[/C][/ROW]
[ROW][C]46[/C][C]16059.1[/C][C]16887.4614335051[/C][C]-828.361433505098[/C][/ROW]
[ROW][C]47[/C][C]16007.1[/C][C]15808.2655351866[/C][C]198.834464813433[/C][/ROW]
[ROW][C]48[/C][C]15806.8[/C][C]15804.3171247581[/C][C]2.48287524193745[/C][/ROW]
[ROW][C]49[/C][C]15160[/C][C]15284.0527100176[/C][C]-124.052710017586[/C][/ROW]
[ROW][C]50[/C][C]15692.1[/C][C]15916.7288518376[/C][C]-224.628851837631[/C][/ROW]
[ROW][C]51[/C][C]18908.9[/C][C]18509.6255784472[/C][C]399.274421552776[/C][/ROW]
[ROW][C]52[/C][C]16969.9[/C][C]17608.7631511635[/C][C]-638.863151163466[/C][/ROW]
[ROW][C]53[/C][C]16997.5[/C][C]17320.7018700465[/C][C]-323.201870046522[/C][/ROW]
[ROW][C]54[/C][C]19858.9[/C][C]19727.486054334[/C][C]131.413945666039[/C][/ROW]
[ROW][C]55[/C][C]17681.2[/C][C]17630.2674651806[/C][C]50.9325348194077[/C][/ROW]
[/TABLE]
Source: https://freestatistics.org/blog/index.php?pk=98165&T=4

Globally Unique Identifier (entire table): ba.freestatistics.org/blog/index.php?pk=98165&T=4

As an alternative you can also use a QR Code:  

The GUIDs for individual cells are displayed in the table below:

Multiple Linear Regression - Actuals, Interpolation, and Residuals
Time or IndexActualsInterpolationForecastResidualsPrediction Error
116198.916070.9666452205127.933354779463
216554.216648.1232240079-93.9232240078967
319554.219426.0554074773128.14459252274
415903.815795.1835985938108.616401406153
518003.817420.5835276568583.216472343212
618329.618082.6966845535246.903315446544
716260.715832.7546671864427.94533281365
814851.914669.8614624879182.038537512062
918174.117416.9958641607757.104135839344
1018406.617664.9138354581741.686164541883
1118466.517458.58900932081007.91099067918
1216016.515174.5003454032841.999654596761
1317428.516577.4264533355851.07354666448
1417167.216714.2646970099452.935302990131
151963018904.1536630204725.846336979601
1617183.616500.8711634435682.728836556491
1718344.718060.3081389998284.391861000242
1819301.418806.1469391837495.253060816329
1918147.518165.0226132978-17.5226132977622
2016192.915327.8843220973865.015677902687
2118374.418119.3808183476255.0191816524
2220515.220005.0366393619510.16336063807
2318957.218953.15422382154.04577617845619
2416471.516834.3746125351-362.874612535079
2518746.819014.842382168-268.042382168018
2619009.518747.1554495334262.344550466598
2719211.219919.7510716796-708.551071679574
2820547.720742.4943713433-194.79437134332
2919325.819410.1833025744-84.3833025744407
3020605.521076.290100937-470.790100936955
3120056.920268.6963457006-211.796345700597
3216141.416928.9364155337-787.536415533736
3320359.821084.411115486-724.611115485986
3419711.620135.0880916749-423.488091674855
3515638.616849.3912316711-1210.79123167107
3614384.514866.1079173036-481.607917303621
3713855.614442.5118092583-586.911809258338
3814308.314705.0277776112-396.727777611202
3915290.615835.3142793755-544.714279375542
4014423.814381.487715455942.3122845441422
4113779.714239.7231607225-460.023160722492
4215686.316089.080220992-402.780220991957
4314733.814983.3589086347-249.558908634698
4412522.512782.017799881-259.517799881014
4516189.416476.9122020058-287.512202005757
4616059.116887.4614335051-828.361433505098
4716007.115808.2655351866198.834464813433
4815806.815804.31712475812.48287524193745
491516015284.0527100176-124.052710017586
5015692.115916.7288518376-224.628851837631
5118908.918509.6255784472399.274421552776
5216969.917608.7631511635-638.863151163466
5316997.517320.7018700465-323.201870046522
5419858.919727.486054334131.413945666039
5517681.217630.267465180650.9325348194077


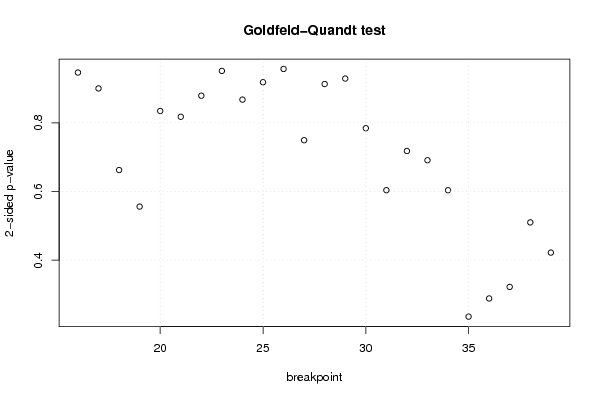
Goldfeld-Quandt test for Heteroskedasticity
p-valuesAlternative Hypothesis
breakpoint indexgreater2-sidedless
160.5268496188582440.9463007622835120.473150381141756
170.45004957509390.90009915018780.5499504249061
180.331289343386090.662578686772180.66871065661391
190.2780630069513840.5561260139027680.721936993048616
200.4172149116694890.8344298233389780.582785088330511
210.4087960611287320.8175921222574630.591203938871268
220.4394497359368740.8788994718737480.560550264063126
230.5244525842190570.9510948315618870.475547415780943
240.566249509609720.867500980780560.43375049039028
250.4590490583466520.9180981166933040.540950941653348
260.4783913933198170.9567827866396350.521608606680183
270.6253326863953990.7493346272092030.374667313604601
280.5435883234581320.9128233530837360.456411676541868
290.4644299753606730.9288599507213470.535570024639327
300.3921139695084050.784227939016810.607886030491595
310.3019191824977910.6038383649955810.698080817502209
320.3590038409310220.7180076818620450.640996159068978
330.3455416022150060.6910832044300120.654458397784994
340.3018622093675810.6037244187351610.698137790632419
350.8821296964866490.2357406070267020.117870303513351
360.8556454565497280.2887090869005440.144354543450272
370.8388313925863480.3223372148273040.161168607413652
380.7449620969518660.5100758060962680.255037903048134
390.7889034962383490.4221930075233030.211096503761651

\begin{tabular}{lllllllll}
\hline
Goldfeld-Quandt test for Heteroskedasticity \tabularnewline
p-values & Alternative Hypothesis \tabularnewline
breakpoint index & greater & 2-sided & less \tabularnewline
16 & 0.526849618858244 & 0.946300762283512 & 0.473150381141756 \tabularnewline
17 & 0.4500495750939 & 0.9000991501878 & 0.5499504249061 \tabularnewline
18 & 0.33128934338609 & 0.66257868677218 & 0.66871065661391 \tabularnewline
19 & 0.278063006951384 & 0.556126013902768 & 0.721936993048616 \tabularnewline
20 & 0.417214911669489 & 0.834429823338978 & 0.582785088330511 \tabularnewline
21 & 0.408796061128732 & 0.817592122257463 & 0.591203938871268 \tabularnewline
22 & 0.439449735936874 & 0.878899471873748 & 0.560550264063126 \tabularnewline
23 & 0.524452584219057 & 0.951094831561887 & 0.475547415780943 \tabularnewline
24 & 0.56624950960972 & 0.86750098078056 & 0.43375049039028 \tabularnewline
25 & 0.459049058346652 & 0.918098116693304 & 0.540950941653348 \tabularnewline
26 & 0.478391393319817 & 0.956782786639635 & 0.521608606680183 \tabularnewline
27 & 0.625332686395399 & 0.749334627209203 & 0.374667313604601 \tabularnewline
28 & 0.543588323458132 & 0.912823353083736 & 0.456411676541868 \tabularnewline
29 & 0.464429975360673 & 0.928859950721347 & 0.535570024639327 \tabularnewline
30 & 0.392113969508405 & 0.78422793901681 & 0.607886030491595 \tabularnewline
31 & 0.301919182497791 & 0.603838364995581 & 0.698080817502209 \tabularnewline
32 & 0.359003840931022 & 0.718007681862045 & 0.640996159068978 \tabularnewline
33 & 0.345541602215006 & 0.691083204430012 & 0.654458397784994 \tabularnewline
34 & 0.301862209367581 & 0.603724418735161 & 0.698137790632419 \tabularnewline
35 & 0.882129696486649 & 0.235740607026702 & 0.117870303513351 \tabularnewline
36 & 0.855645456549728 & 0.288709086900544 & 0.144354543450272 \tabularnewline
37 & 0.838831392586348 & 0.322337214827304 & 0.161168607413652 \tabularnewline
38 & 0.744962096951866 & 0.510075806096268 & 0.255037903048134 \tabularnewline
39 & 0.788903496238349 & 0.422193007523303 & 0.211096503761651 \tabularnewline
\hline
\end{tabular}
%Source: https://freestatistics.org/blog/index.php?pk=98165&T=5

[TABLE]
[ROW][C]Goldfeld-Quandt test for Heteroskedasticity[/C][/ROW]
[ROW][C]p-values[/C][C]Alternative Hypothesis[/C][/ROW]
[ROW][C]breakpoint index[/C][C]greater[/C][C]2-sided[/C][C]less[/C][/ROW]
[ROW][C]16[/C][C]0.526849618858244[/C][C]0.946300762283512[/C][C]0.473150381141756[/C][/ROW]
[ROW][C]17[/C][C]0.4500495750939[/C][C]0.9000991501878[/C][C]0.5499504249061[/C][/ROW]
[ROW][C]18[/C][C]0.33128934338609[/C][C]0.66257868677218[/C][C]0.66871065661391[/C][/ROW]
[ROW][C]19[/C][C]0.278063006951384[/C][C]0.556126013902768[/C][C]0.721936993048616[/C][/ROW]
[ROW][C]20[/C][C]0.417214911669489[/C][C]0.834429823338978[/C][C]0.582785088330511[/C][/ROW]
[ROW][C]21[/C][C]0.408796061128732[/C][C]0.817592122257463[/C][C]0.591203938871268[/C][/ROW]
[ROW][C]22[/C][C]0.439449735936874[/C][C]0.878899471873748[/C][C]0.560550264063126[/C][/ROW]
[ROW][C]23[/C][C]0.524452584219057[/C][C]0.951094831561887[/C][C]0.475547415780943[/C][/ROW]
[ROW][C]24[/C][C]0.56624950960972[/C][C]0.86750098078056[/C][C]0.43375049039028[/C][/ROW]
[ROW][C]25[/C][C]0.459049058346652[/C][C]0.918098116693304[/C][C]0.540950941653348[/C][/ROW]
[ROW][C]26[/C][C]0.478391393319817[/C][C]0.956782786639635[/C][C]0.521608606680183[/C][/ROW]
[ROW][C]27[/C][C]0.625332686395399[/C][C]0.749334627209203[/C][C]0.374667313604601[/C][/ROW]
[ROW][C]28[/C][C]0.543588323458132[/C][C]0.912823353083736[/C][C]0.456411676541868[/C][/ROW]
[ROW][C]29[/C][C]0.464429975360673[/C][C]0.928859950721347[/C][C]0.535570024639327[/C][/ROW]
[ROW][C]30[/C][C]0.392113969508405[/C][C]0.78422793901681[/C][C]0.607886030491595[/C][/ROW]
[ROW][C]31[/C][C]0.301919182497791[/C][C]0.603838364995581[/C][C]0.698080817502209[/C][/ROW]
[ROW][C]32[/C][C]0.359003840931022[/C][C]0.718007681862045[/C][C]0.640996159068978[/C][/ROW]
[ROW][C]33[/C][C]0.345541602215006[/C][C]0.691083204430012[/C][C]0.654458397784994[/C][/ROW]
[ROW][C]34[/C][C]0.301862209367581[/C][C]0.603724418735161[/C][C]0.698137790632419[/C][/ROW]
[ROW][C]35[/C][C]0.882129696486649[/C][C]0.235740607026702[/C][C]0.117870303513351[/C][/ROW]
[ROW][C]36[/C][C]0.855645456549728[/C][C]0.288709086900544[/C][C]0.144354543450272[/C][/ROW]
[ROW][C]37[/C][C]0.838831392586348[/C][C]0.322337214827304[/C][C]0.161168607413652[/C][/ROW]
[ROW][C]38[/C][C]0.744962096951866[/C][C]0.510075806096268[/C][C]0.255037903048134[/C][/ROW]
[ROW][C]39[/C][C]0.788903496238349[/C][C]0.422193007523303[/C][C]0.211096503761651[/C][/ROW]
[/TABLE]
Source: https://freestatistics.org/blog/index.php?pk=98165&T=5

Globally Unique Identifier (entire table): ba.freestatistics.org/blog/index.php?pk=98165&T=5

As an alternative you can also use a QR Code:  

The GUIDs for individual cells are displayed in the table below:

Goldfeld-Quandt test for Heteroskedasticity
p-valuesAlternative Hypothesis
breakpoint indexgreater2-sidedless
160.5268496188582440.9463007622835120.473150381141756
170.45004957509390.90009915018780.5499504249061
180.331289343386090.662578686772180.66871065661391
190.2780630069513840.5561260139027680.721936993048616
200.4172149116694890.8344298233389780.582785088330511
210.4087960611287320.8175921222574630.591203938871268
220.4394497359368740.8788994718737480.560550264063126
230.5244525842190570.9510948315618870.475547415780943
240.566249509609720.867500980780560.43375049039028
250.4590490583466520.9180981166933040.540950941653348
260.4783913933198170.9567827866396350.521608606680183
270.6253326863953990.7493346272092030.374667313604601
280.5435883234581320.9128233530837360.456411676541868
290.4644299753606730.9288599507213470.535570024639327
300.3921139695084050.784227939016810.607886030491595
310.3019191824977910.6038383649955810.698080817502209
320.3590038409310220.7180076818620450.640996159068978
330.3455416022150060.6910832044300120.654458397784994
340.3018622093675810.6037244187351610.698137790632419
350.8821296964866490.2357406070267020.117870303513351
360.8556454565497280.2887090869005440.144354543450272
370.8388313925863480.3223372148273040.161168607413652
380.7449620969518660.5100758060962680.255037903048134
390.7889034962383490.4221930075233030.211096503761651


Meta Analysis of Goldfeld-Quandt test for Heteroskedasticity
Description# significant tests% significant testsOK/NOK
1% type I error level00OK
5% type I error level00OK
10% type I error level00OK

\begin{tabular}{lllllllll}
\hline
Meta Analysis of Goldfeld-Quandt test for Heteroskedasticity \tabularnewline
Description & # significant tests & % significant tests & OK/NOK \tabularnewline
1% type I error level & 0 & 0 & OK \tabularnewline
5% type I error level & 0 & 0 & OK \tabularnewline
10% type I error level & 0 & 0 & OK \tabularnewline
\hline
\end{tabular}
%Source: https://freestatistics.org/blog/index.php?pk=98165&T=6

[TABLE]
[ROW][C]Meta Analysis of Goldfeld-Quandt test for Heteroskedasticity[/C][/ROW]
[ROW][C]Description[/C][C]# significant tests[/C][C]% significant tests[/C][C]OK/NOK[/C][/ROW]
[ROW][C]1% type I error level[/C][C]0[/C][C]0[/C][C]OK[/C][/ROW]
[ROW][C]5% type I error level[/C][C]0[/C][C]0[/C][C]OK[/C][/ROW]
[ROW][C]10% type I error level[/C][C]0[/C][C]0[/C][C]OK[/C][/ROW]
[/TABLE]
Source: https://freestatistics.org/blog/index.php?pk=98165&T=6

Globally Unique Identifier (entire table): ba.freestatistics.org/blog/index.php?pk=98165&T=6

As an alternative you can also use a QR Code:  

The GUIDs for individual cells are displayed in the table below:

Meta Analysis of Goldfeld-Quandt test for Heteroskedasticity
Description# significant tests% significant testsOK/NOK
1% type I error level00OK
5% type I error level00OK
10% type I error level00OK


Parameters (Session):
par1 = 1 ; par2 = Include Monthly Dummies ; par3 = No Linear Trend ;
Parameters (R input):
par1 = 1 ; par2 = Include Monthly Dummies ; par3 = No Linear Trend ;
R code (references can be found in the software module):
library(lattice)
library(lmtest)
n25 <- 25 #minimum number of obs. for Goldfeld-Quandt test
par1 <- as.numeric(par1)
x <- t(y)
k <- length(x[1,])
n <- length(x[,1])
x1 <- cbind(x[,par1], x[,1:k!=par1])
mycolnames <- c(colnames(x)[par1], colnames(x)[1:k!=par1])
colnames(x1) <- mycolnames #colnames(x)[par1]
x <- x1
if (par3 == 'First Differences'){
x2 <- array(0, dim=c(n-1,k), dimnames=list(1:(n-1), paste('(1-B)',colnames(x),sep='')))
for (i in 1:n-1) {
for (j in 1:k) {
x2[i,j] <- x[i+1,j] - x[i,j]
}
}
x <- x2
}
if (par2 == 'Include Monthly Dummies'){
x2 <- array(0, dim=c(n,11), dimnames=list(1:n, paste('M', seq(1:11), sep ='')))
for (i in 1:11){
x2[seq(i,n,12),i] <- 1
}
x <- cbind(x, x2)
}
if (par2 == 'Include Quarterly Dummies'){
x2 <- array(0, dim=c(n,3), dimnames=list(1:n, paste('Q', seq(1:3), sep ='')))
for (i in 1:3){
x2[seq(i,n,4),i] <- 1
}
x <- cbind(x, x2)
}
k <- length(x[1,])
if (par3 == 'Linear Trend'){
x <- cbind(x, c(1:n))
colnames(x)[k+1] <- 't'
}
x
k <- length(x[1,])
df <- as.data.frame(x)
(mylm <- lm(df))
(mysum <- summary(mylm))
if (n > n25) {
kp3 <- k + 3
nmkm3 <- n - k - 3
gqarr <- array(NA, dim=c(nmkm3-kp3+1,3))
numgqtests <- 0
numsignificant1 <- 0
numsignificant5 <- 0
numsignificant10 <- 0
for (mypoint in kp3:nmkm3) {
j <- 0
numgqtests <- numgqtests + 1
for (myalt in c('greater', 'two.sided', 'less')) {
j <- j + 1
gqarr[mypoint-kp3+1,j] <- gqtest(mylm, point=mypoint, alternative=myalt)$p.value
}
if (gqarr[mypoint-kp3+1,2] < 0.01) numsignificant1 <- numsignificant1 + 1
if (gqarr[mypoint-kp3+1,2] < 0.05) numsignificant5 <- numsignificant5 + 1
if (gqarr[mypoint-kp3+1,2] < 0.10) numsignificant10 <- numsignificant10 + 1
}
gqarr
}
bitmap(file='test0.png')
plot(x[,1], type='l', main='Actuals and Interpolation', ylab='value of Actuals and Interpolation (dots)', xlab='time or index')
points(x[,1]-mysum$resid)
grid()
dev.off()
bitmap(file='test1.png')
plot(mysum$resid, type='b', pch=19, main='Residuals', ylab='value of Residuals', xlab='time or index')
grid()
dev.off()
bitmap(file='test2.png')
hist(mysum$resid, main='Residual Histogram', xlab='values of Residuals')
grid()
dev.off()
bitmap(file='test3.png')
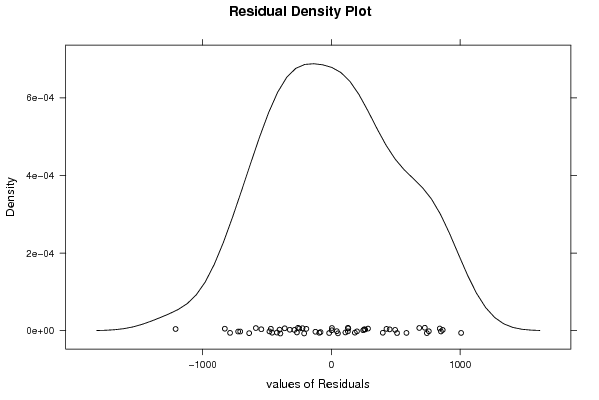
densityplot(~mysum$resid,col='black',main='Residual Density Plot', xlab='values of Residuals')
dev.off()
bitmap(file='test4.png')
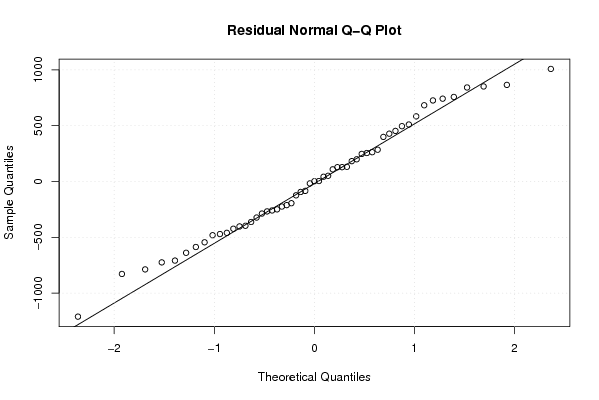
qqnorm(mysum$resid, main='Residual Normal Q-Q Plot')
qqline(mysum$resid)
grid()
dev.off()
(myerror <- as.ts(mysum$resid))
bitmap(file='test5.png')
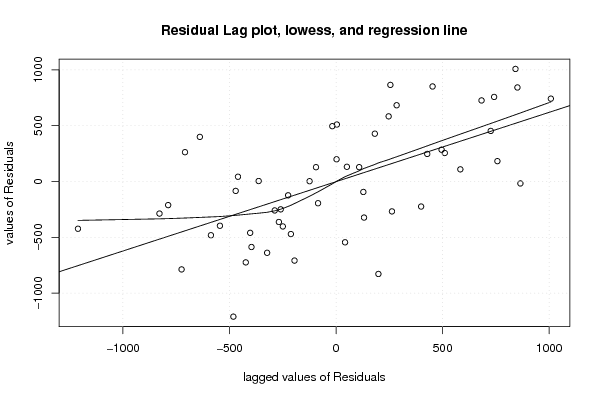
dum <- cbind(lag(myerror,k=1),myerror)
dum
dum1 <- dum[2:length(myerror),]
dum1
z <- as.data.frame(dum1)
z
plot(z,main=paste('Residual Lag plot, lowess, and regression line'), ylab='values of Residuals', xlab='lagged values of Residuals')
lines(lowess(z))
abline(lm(z))
grid()
dev.off()
bitmap(file='test6.png')
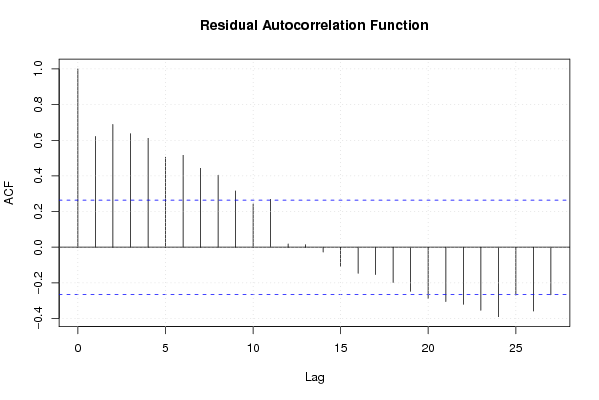
acf(mysum$resid, lag.max=length(mysum$resid)/2, main='Residual Autocorrelation Function')
grid()
dev.off()
bitmap(file='test7.png')
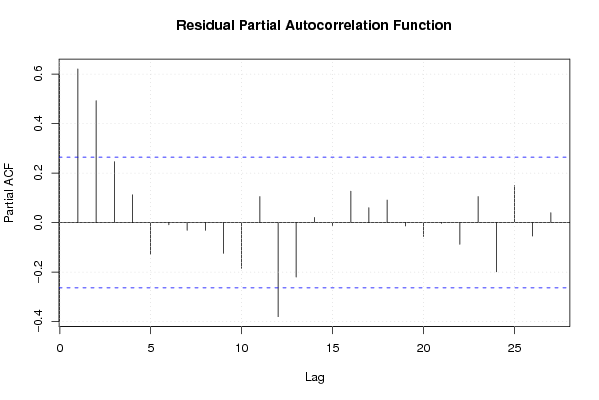
pacf(mysum$resid, lag.max=length(mysum$resid)/2, main='Residual Partial Autocorrelation Function')
grid()
dev.off()
bitmap(file='test8.png')
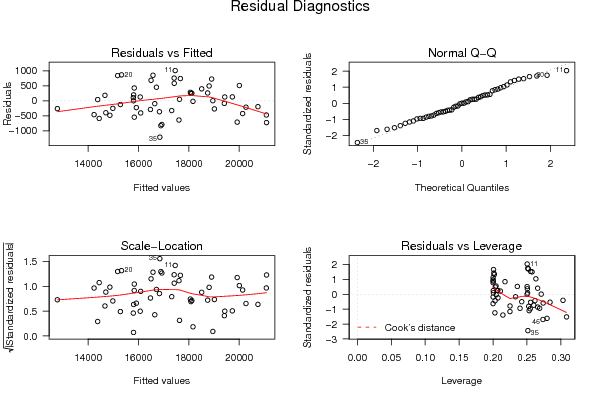
opar <- par(mfrow = c(2,2), oma = c(0, 0, 1.1, 0))
plot(mylm, las = 1, sub='Residual Diagnostics')
par(opar)
dev.off()
if (n > n25) {
bitmap(file='test9.png')
plot(kp3:nmkm3,gqarr[,2], main='Goldfeld-Quandt test',ylab='2-sided p-value',xlab='breakpoint')
grid()
dev.off()
}
load(file='createtable')
a<-table.start()
a<-table.row.start(a)
a<-table.element(a, 'Multiple Linear Regression - Estimated Regression Equation', 1, TRUE)
a<-table.row.end(a)
myeq <- colnames(x)[1]
myeq <- paste(myeq, '[t] = ', sep='')
for (i in 1:k){
if (mysum$coefficients[i,1] > 0) myeq <- paste(myeq, '+', '')
myeq <- paste(myeq, mysum$coefficients[i,1], sep=' ')
if (rownames(mysum$coefficients)[i] != '(Intercept)') {
myeq <- paste(myeq, rownames(mysum$coefficients)[i], sep='')
if (rownames(mysum$coefficients)[i] != 't') myeq <- paste(myeq, '[t]', sep='')
}
}
myeq <- paste(myeq, ' + e[t]')
a<-table.row.start(a)
a<-table.element(a, myeq)
a<-table.row.end(a)
a<-table.end(a)
table.save(a,file='mytable1.tab')
a<-table.start()
a<-table.row.start(a)
a<-table.element(a,hyperlink('ols1.htm','Multiple Linear Regression - Ordinary Least Squares',''), 6, TRUE)
a<-table.row.end(a)
a<-table.row.start(a)
a<-table.element(a,'Variable',header=TRUE)
a<-table.element(a,'Parameter',header=TRUE)
a<-table.element(a,'S.D.',header=TRUE)
a<-table.element(a,'T-STAT
H0: parameter = 0',header=TRUE)
a<-table.element(a,'2-tail p-value',header=TRUE)
a<-table.element(a,'1-tail p-value',header=TRUE)
a<-table.row.end(a)
for (i in 1:k){
a<-table.row.start(a)
a<-table.element(a,rownames(mysum$coefficients)[i],header=TRUE)
a<-table.element(a,mysum$coefficients[i,1])
a<-table.element(a, round(mysum$coefficients[i,2],6))
a<-table.element(a, round(mysum$coefficients[i,3],4))
a<-table.element(a, round(mysum$coefficients[i,4],6))
a<-table.element(a, round(mysum$coefficients[i,4]/2,6))
a<-table.row.end(a)
}
a<-table.end(a)
table.save(a,file='mytable2.tab')
a<-table.start()
a<-table.row.start(a)
a<-table.element(a, 'Multiple Linear Regression - Regression Statistics', 2, TRUE)
a<-table.row.end(a)
a<-table.row.start(a)
a<-table.element(a, 'Multiple R',1,TRUE)
a<-table.element(a, sqrt(mysum$r.squared))
a<-table.row.end(a)
a<-table.row.start(a)
a<-table.element(a, 'R-squared',1,TRUE)
a<-table.element(a, mysum$r.squared)
a<-table.row.end(a)
a<-table.row.start(a)
a<-table.element(a, 'Adjusted R-squared',1,TRUE)
a<-table.element(a, mysum$adj.r.squared)
a<-table.row.end(a)
a<-table.row.start(a)
a<-table.element(a, 'F-TEST (value)',1,TRUE)
a<-table.element(a, mysum$fstatistic[1])
a<-table.row.end(a)
a<-table.row.start(a)
a<-table.element(a, 'F-TEST (DF numerator)',1,TRUE)
a<-table.element(a, mysum$fstatistic[2])
a<-table.row.end(a)
a<-table.row.start(a)
a<-table.element(a, 'F-TEST (DF denominator)',1,TRUE)
a<-table.element(a, mysum$fstatistic[3])
a<-table.row.end(a)
a<-table.row.start(a)
a<-table.element(a, 'p-value',1,TRUE)
a<-table.element(a, 1-pf(mysum$fstatistic[1],mysum$fstatistic[2],mysum$fstatistic[3]))
a<-table.row.end(a)
a<-table.row.start(a)
a<-table.element(a, 'Multiple Linear Regression - Residual Statistics', 2, TRUE)
a<-table.row.end(a)
a<-table.row.start(a)
a<-table.element(a, 'Residual Standard Deviation',1,TRUE)
a<-table.element(a, mysum$sigma)
a<-table.row.end(a)
a<-table.row.start(a)
a<-table.element(a, 'Sum Squared Residuals',1,TRUE)
a<-table.element(a, sum(myerror*myerror))
a<-table.row.end(a)
a<-table.end(a)
table.save(a,file='mytable3.tab')
a<-table.start()
a<-table.row.start(a)
a<-table.element(a, 'Multiple Linear Regression - Actuals, Interpolation, and Residuals', 4, TRUE)
a<-table.row.end(a)
a<-table.row.start(a)
a<-table.element(a, 'Time or Index', 1, TRUE)
a<-table.element(a, 'Actuals', 1, TRUE)
a<-table.element(a, 'Interpolation
Forecast', 1, TRUE)
a<-table.element(a, 'Residuals
Prediction Error', 1, TRUE)
a<-table.row.end(a)
for (i in 1:n) {
a<-table.row.start(a)
a<-table.element(a,i, 1, TRUE)
a<-table.element(a,x[i])
a<-table.element(a,x[i]-mysum$resid[i])
a<-table.element(a,mysum$resid[i])
a<-table.row.end(a)
}
a<-table.end(a)
table.save(a,file='mytable4.tab')
if (n > n25) {
a<-table.start()
a<-table.row.start(a)
a<-table.element(a,'Goldfeld-Quandt test for Heteroskedasticity',4,TRUE)
a<-table.row.end(a)
a<-table.row.start(a)
a<-table.element(a,'p-values',header=TRUE)
a<-table.element(a,'Alternative Hypothesis',3,header=TRUE)
a<-table.row.end(a)
a<-table.row.start(a)
a<-table.element(a,'breakpoint index',header=TRUE)
a<-table.element(a,'greater',header=TRUE)
a<-table.element(a,'2-sided',header=TRUE)
a<-table.element(a,'less',header=TRUE)
a<-table.row.end(a)
for (mypoint in kp3:nmkm3) {
a<-table.row.start(a)
a<-table.element(a,mypoint,header=TRUE)
a<-table.element(a,gqarr[mypoint-kp3+1,1])
a<-table.element(a,gqarr[mypoint-kp3+1,2])
a<-table.element(a,gqarr[mypoint-kp3+1,3])
a<-table.row.end(a)
}
a<-table.end(a)
table.save(a,file='mytable5.tab')
a<-table.start()
a<-table.row.start(a)
a<-table.element(a,'Meta Analysis of Goldfeld-Quandt test for Heteroskedasticity',4,TRUE)
a<-table.row.end(a)
a<-table.row.start(a)
a<-table.element(a,'Description',header=TRUE)
a<-table.element(a,'# significant tests',header=TRUE)
a<-table.element(a,'% significant tests',header=TRUE)
a<-table.element(a,'OK/NOK',header=TRUE)
a<-table.row.end(a)
a<-table.row.start(a)
a<-table.element(a,'1% type I error level',header=TRUE)
a<-table.element(a,numsignificant1)
a<-table.element(a,numsignificant1/numgqtests)
if (numsignificant1/numgqtests < 0.01) dum <- 'OK' else dum <- 'NOK'
a<-table.element(a,dum)
a<-table.row.end(a)
a<-table.row.start(a)
a<-table.element(a,'5% type I error level',header=TRUE)
a<-table.element(a,numsignificant5)
a<-table.element(a,numsignificant5/numgqtests)
if (numsignificant5/numgqtests < 0.05) dum <- 'OK' else dum <- 'NOK'
a<-table.element(a,dum)
a<-table.row.end(a)
a<-table.row.start(a)
a<-table.element(a,'10% type I error level',header=TRUE)
a<-table.element(a,numsignificant10)
a<-table.element(a,numsignificant10/numgqtests)
if (numsignificant10/numgqtests < 0.1) dum <- 'OK' else dum <- 'NOK'
a<-table.element(a,dum)
a<-table.row.end(a)
a<-table.end(a)
table.save(a,file='mytable6.tab')
}