Free Statistics

of Irreproducible Research!

Author's title

Author*Unverified author*
R Software Modulerwasp_autocorrelation.wasp
Title produced by software(Partial) Autocorrelation Function
Date of computationWed, 17 Nov 2010 15:56:00 +0000
Cite this page as followsStatistical Computations at FreeStatistics.org, Office for Research Development and Education, URL https://freestatistics.org/blog/index.php?v=date/2010/Nov/17/t1290009277ekzmlwjki3rt3rl.htm/, Retrieved Thu, 18 Apr 2024 05:20:21 +0000
Statistical Computations at FreeStatistics.org, Office for Research Development and Education, URL https://freestatistics.org/blog/index.php?pk=96754, Retrieved Thu, 18 Apr 2024 05:20:21 +0000
QR Codes:

Original text written by user:
IsPrivate?No (this computation is public)
User-defined keywordsKDGP2W12
Estimated Impact120
Family? (F = Feedback message, R = changed R code, M = changed R Module, P = changed Parameters, D = changed Data)
-       [(Partial) Autocorrelation Function] [] [2010-11-17 15:56:00] [d05b5f5c1bde1241a89791f96cf6e071] [Current]
Feedback Forum

Post a new message
Dataseries X:
47
19
52
136
80
42
54
66
81
63
137
72
107
58
36
52
79
77
54
84
48
96
83
66
61
53
30
74
69
59
42
65
70
100
63
105
82
81
75
102
121
98
76
77
63
37
35
23
40
29
37
51
20
28
13
22
25
13
16
13
16
17
9
17
25
14
8
7
10
7
10
3


Summary of computational transaction
Raw Inputview raw input (R code)
Raw Outputview raw output of R engine
Computing time1 seconds
R Server'Gwilym Jenkins' @ 72.249.127.135

\begin{tabular}{lllllllll}
\hline
Summary of computational transaction \tabularnewline
Raw Input & view raw input (R code)  \tabularnewline
Raw Output & view raw output of R engine  \tabularnewline
Computing time & 1 seconds \tabularnewline
R Server & 'Gwilym Jenkins' @ 72.249.127.135 \tabularnewline
\hline
\end{tabular}
%Source: https://freestatistics.org/blog/index.php?pk=96754&T=0

[TABLE]
[ROW][C]Summary of computational transaction[/C][/ROW]
[ROW][C]Raw Input[/C][C]view raw input (R code) [/C][/ROW]
[ROW][C]Raw Output[/C][C]view raw output of R engine [/C][/ROW]
[ROW][C]Computing time[/C][C]1 seconds[/C][/ROW]
[ROW][C]R Server[/C][C]'Gwilym Jenkins' @ 72.249.127.135[/C][/ROW]
[/TABLE]
Source: https://freestatistics.org/blog/index.php?pk=96754&T=0

Globally Unique Identifier (entire table): ba.freestatistics.org/blog/index.php?pk=96754&T=0

As an alternative you can also use a QR Code:  

The GUIDs for individual cells are displayed in the table below:

Summary of computational transaction
Raw Inputview raw input (R code)
Raw Outputview raw output of R engine
Computing time1 seconds
R Server'Gwilym Jenkins' @ 72.249.127.135


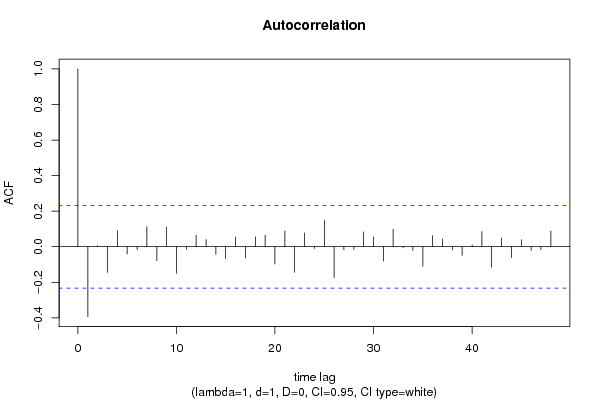
Autocorrelation Function
Time lag kACF(k)T-STATP-value
1-0.39322-3.31330.000727
20.0053310.04490.482148
3-0.14487-1.22070.113119
40.0897510.75630.225999
5-0.040818-0.34390.365954
6-0.016387-0.13810.445284
70.1130840.95290.171946
8-0.078329-0.660.25569
90.1096620.9240.179301
10-0.149554-1.26020.105868
11-0.013495-0.11370.454895
120.0651920.54930.292255
130.0403840.34030.367323
14-0.042874-0.36130.359487
15-0.066541-0.56070.288389
160.0547790.46160.322898
17-0.062965-0.53060.298693
180.0555110.46770.320701
190.0643860.54250.294579
20-0.097461-0.82120.207135
210.0883920.74480.229424
22-0.142965-1.20460.11617
230.0779230.65660.256783
24-0.009281-0.07820.468942
250.149721.26160.105617
26-0.172634-1.45460.075087
27-0.01643-0.13840.445141
28-0.014193-0.11960.45257
290.0833370.70220.242422
300.0545450.45960.323602
31-0.080629-0.67940.249548
320.097930.82520.20602
33-0.005947-0.05010.480089
34-0.020861-0.17580.430484
35-0.110314-0.92950.177883
360.0619170.52170.301743
370.0438440.36940.35645
38-0.018781-0.15830.437354
39-0.048243-0.40650.342797
400.0100480.08470.466381
410.0856920.72210.236315
42-0.114235-0.96260.169518
430.048650.40990.341544
44-0.06061-0.51070.30557
450.0392780.3310.370823
46-0.020585-0.17350.431396
47-0.016086-0.13550.446283
480.08910.75080.227636

\begin{tabular}{lllllllll}
\hline
Autocorrelation Function \tabularnewline
Time lag k & ACF(k) & T-STAT & P-value \tabularnewline
1 & -0.39322 & -3.3133 & 0.000727 \tabularnewline
2 & 0.005331 & 0.0449 & 0.482148 \tabularnewline
3 & -0.14487 & -1.2207 & 0.113119 \tabularnewline
4 & 0.089751 & 0.7563 & 0.225999 \tabularnewline
5 & -0.040818 & -0.3439 & 0.365954 \tabularnewline
6 & -0.016387 & -0.1381 & 0.445284 \tabularnewline
7 & 0.113084 & 0.9529 & 0.171946 \tabularnewline
8 & -0.078329 & -0.66 & 0.25569 \tabularnewline
9 & 0.109662 & 0.924 & 0.179301 \tabularnewline
10 & -0.149554 & -1.2602 & 0.105868 \tabularnewline
11 & -0.013495 & -0.1137 & 0.454895 \tabularnewline
12 & 0.065192 & 0.5493 & 0.292255 \tabularnewline
13 & 0.040384 & 0.3403 & 0.367323 \tabularnewline
14 & -0.042874 & -0.3613 & 0.359487 \tabularnewline
15 & -0.066541 & -0.5607 & 0.288389 \tabularnewline
16 & 0.054779 & 0.4616 & 0.322898 \tabularnewline
17 & -0.062965 & -0.5306 & 0.298693 \tabularnewline
18 & 0.055511 & 0.4677 & 0.320701 \tabularnewline
19 & 0.064386 & 0.5425 & 0.294579 \tabularnewline
20 & -0.097461 & -0.8212 & 0.207135 \tabularnewline
21 & 0.088392 & 0.7448 & 0.229424 \tabularnewline
22 & -0.142965 & -1.2046 & 0.11617 \tabularnewline
23 & 0.077923 & 0.6566 & 0.256783 \tabularnewline
24 & -0.009281 & -0.0782 & 0.468942 \tabularnewline
25 & 0.14972 & 1.2616 & 0.105617 \tabularnewline
26 & -0.172634 & -1.4546 & 0.075087 \tabularnewline
27 & -0.01643 & -0.1384 & 0.445141 \tabularnewline
28 & -0.014193 & -0.1196 & 0.45257 \tabularnewline
29 & 0.083337 & 0.7022 & 0.242422 \tabularnewline
30 & 0.054545 & 0.4596 & 0.323602 \tabularnewline
31 & -0.080629 & -0.6794 & 0.249548 \tabularnewline
32 & 0.09793 & 0.8252 & 0.20602 \tabularnewline
33 & -0.005947 & -0.0501 & 0.480089 \tabularnewline
34 & -0.020861 & -0.1758 & 0.430484 \tabularnewline
35 & -0.110314 & -0.9295 & 0.177883 \tabularnewline
36 & 0.061917 & 0.5217 & 0.301743 \tabularnewline
37 & 0.043844 & 0.3694 & 0.35645 \tabularnewline
38 & -0.018781 & -0.1583 & 0.437354 \tabularnewline
39 & -0.048243 & -0.4065 & 0.342797 \tabularnewline
40 & 0.010048 & 0.0847 & 0.466381 \tabularnewline
41 & 0.085692 & 0.7221 & 0.236315 \tabularnewline
42 & -0.114235 & -0.9626 & 0.169518 \tabularnewline
43 & 0.04865 & 0.4099 & 0.341544 \tabularnewline
44 & -0.06061 & -0.5107 & 0.30557 \tabularnewline
45 & 0.039278 & 0.331 & 0.370823 \tabularnewline
46 & -0.020585 & -0.1735 & 0.431396 \tabularnewline
47 & -0.016086 & -0.1355 & 0.446283 \tabularnewline
48 & 0.0891 & 0.7508 & 0.227636 \tabularnewline
\hline
\end{tabular}
%Source: https://freestatistics.org/blog/index.php?pk=96754&T=1

[TABLE]
[ROW][C]Autocorrelation Function[/C][/ROW]
[ROW][C]Time lag k[/C][C]ACF(k)[/C][C]T-STAT[/C][C]P-value[/C][/ROW]
[ROW][C]1[/C][C]-0.39322[/C][C]-3.3133[/C][C]0.000727[/C][/ROW]
[ROW][C]2[/C][C]0.005331[/C][C]0.0449[/C][C]0.482148[/C][/ROW]
[ROW][C]3[/C][C]-0.14487[/C][C]-1.2207[/C][C]0.113119[/C][/ROW]
[ROW][C]4[/C][C]0.089751[/C][C]0.7563[/C][C]0.225999[/C][/ROW]
[ROW][C]5[/C][C]-0.040818[/C][C]-0.3439[/C][C]0.365954[/C][/ROW]
[ROW][C]6[/C][C]-0.016387[/C][C]-0.1381[/C][C]0.445284[/C][/ROW]
[ROW][C]7[/C][C]0.113084[/C][C]0.9529[/C][C]0.171946[/C][/ROW]
[ROW][C]8[/C][C]-0.078329[/C][C]-0.66[/C][C]0.25569[/C][/ROW]
[ROW][C]9[/C][C]0.109662[/C][C]0.924[/C][C]0.179301[/C][/ROW]
[ROW][C]10[/C][C]-0.149554[/C][C]-1.2602[/C][C]0.105868[/C][/ROW]
[ROW][C]11[/C][C]-0.013495[/C][C]-0.1137[/C][C]0.454895[/C][/ROW]
[ROW][C]12[/C][C]0.065192[/C][C]0.5493[/C][C]0.292255[/C][/ROW]
[ROW][C]13[/C][C]0.040384[/C][C]0.3403[/C][C]0.367323[/C][/ROW]
[ROW][C]14[/C][C]-0.042874[/C][C]-0.3613[/C][C]0.359487[/C][/ROW]
[ROW][C]15[/C][C]-0.066541[/C][C]-0.5607[/C][C]0.288389[/C][/ROW]
[ROW][C]16[/C][C]0.054779[/C][C]0.4616[/C][C]0.322898[/C][/ROW]
[ROW][C]17[/C][C]-0.062965[/C][C]-0.5306[/C][C]0.298693[/C][/ROW]
[ROW][C]18[/C][C]0.055511[/C][C]0.4677[/C][C]0.320701[/C][/ROW]
[ROW][C]19[/C][C]0.064386[/C][C]0.5425[/C][C]0.294579[/C][/ROW]
[ROW][C]20[/C][C]-0.097461[/C][C]-0.8212[/C][C]0.207135[/C][/ROW]
[ROW][C]21[/C][C]0.088392[/C][C]0.7448[/C][C]0.229424[/C][/ROW]
[ROW][C]22[/C][C]-0.142965[/C][C]-1.2046[/C][C]0.11617[/C][/ROW]
[ROW][C]23[/C][C]0.077923[/C][C]0.6566[/C][C]0.256783[/C][/ROW]
[ROW][C]24[/C][C]-0.009281[/C][C]-0.0782[/C][C]0.468942[/C][/ROW]
[ROW][C]25[/C][C]0.14972[/C][C]1.2616[/C][C]0.105617[/C][/ROW]
[ROW][C]26[/C][C]-0.172634[/C][C]-1.4546[/C][C]0.075087[/C][/ROW]
[ROW][C]27[/C][C]-0.01643[/C][C]-0.1384[/C][C]0.445141[/C][/ROW]
[ROW][C]28[/C][C]-0.014193[/C][C]-0.1196[/C][C]0.45257[/C][/ROW]
[ROW][C]29[/C][C]0.083337[/C][C]0.7022[/C][C]0.242422[/C][/ROW]
[ROW][C]30[/C][C]0.054545[/C][C]0.4596[/C][C]0.323602[/C][/ROW]
[ROW][C]31[/C][C]-0.080629[/C][C]-0.6794[/C][C]0.249548[/C][/ROW]
[ROW][C]32[/C][C]0.09793[/C][C]0.8252[/C][C]0.20602[/C][/ROW]
[ROW][C]33[/C][C]-0.005947[/C][C]-0.0501[/C][C]0.480089[/C][/ROW]
[ROW][C]34[/C][C]-0.020861[/C][C]-0.1758[/C][C]0.430484[/C][/ROW]
[ROW][C]35[/C][C]-0.110314[/C][C]-0.9295[/C][C]0.177883[/C][/ROW]
[ROW][C]36[/C][C]0.061917[/C][C]0.5217[/C][C]0.301743[/C][/ROW]
[ROW][C]37[/C][C]0.043844[/C][C]0.3694[/C][C]0.35645[/C][/ROW]
[ROW][C]38[/C][C]-0.018781[/C][C]-0.1583[/C][C]0.437354[/C][/ROW]
[ROW][C]39[/C][C]-0.048243[/C][C]-0.4065[/C][C]0.342797[/C][/ROW]
[ROW][C]40[/C][C]0.010048[/C][C]0.0847[/C][C]0.466381[/C][/ROW]
[ROW][C]41[/C][C]0.085692[/C][C]0.7221[/C][C]0.236315[/C][/ROW]
[ROW][C]42[/C][C]-0.114235[/C][C]-0.9626[/C][C]0.169518[/C][/ROW]
[ROW][C]43[/C][C]0.04865[/C][C]0.4099[/C][C]0.341544[/C][/ROW]
[ROW][C]44[/C][C]-0.06061[/C][C]-0.5107[/C][C]0.30557[/C][/ROW]
[ROW][C]45[/C][C]0.039278[/C][C]0.331[/C][C]0.370823[/C][/ROW]
[ROW][C]46[/C][C]-0.020585[/C][C]-0.1735[/C][C]0.431396[/C][/ROW]
[ROW][C]47[/C][C]-0.016086[/C][C]-0.1355[/C][C]0.446283[/C][/ROW]
[ROW][C]48[/C][C]0.0891[/C][C]0.7508[/C][C]0.227636[/C][/ROW]
[/TABLE]
Source: https://freestatistics.org/blog/index.php?pk=96754&T=1

Globally Unique Identifier (entire table): ba.freestatistics.org/blog/index.php?pk=96754&T=1

As an alternative you can also use a QR Code:  

The GUIDs for individual cells are displayed in the table below:

Autocorrelation Function
Time lag kACF(k)T-STATP-value
1-0.39322-3.31330.000727
20.0053310.04490.482148
3-0.14487-1.22070.113119
40.0897510.75630.225999
5-0.040818-0.34390.365954
6-0.016387-0.13810.445284
70.1130840.95290.171946
8-0.078329-0.660.25569
90.1096620.9240.179301
10-0.149554-1.26020.105868
11-0.013495-0.11370.454895
120.0651920.54930.292255
130.0403840.34030.367323
14-0.042874-0.36130.359487
15-0.066541-0.56070.288389
160.0547790.46160.322898
17-0.062965-0.53060.298693
180.0555110.46770.320701
190.0643860.54250.294579
20-0.097461-0.82120.207135
210.0883920.74480.229424
22-0.142965-1.20460.11617
230.0779230.65660.256783
24-0.009281-0.07820.468942
250.149721.26160.105617
26-0.172634-1.45460.075087
27-0.01643-0.13840.445141
28-0.014193-0.11960.45257
290.0833370.70220.242422
300.0545450.45960.323602
31-0.080629-0.67940.249548
320.097930.82520.20602
33-0.005947-0.05010.480089
34-0.020861-0.17580.430484
35-0.110314-0.92950.177883
360.0619170.52170.301743
370.0438440.36940.35645
38-0.018781-0.15830.437354
39-0.048243-0.40650.342797
400.0100480.08470.466381
410.0856920.72210.236315
42-0.114235-0.96260.169518
430.048650.40990.341544
44-0.06061-0.51070.30557
450.0392780.3310.370823
46-0.020585-0.17350.431396
47-0.016086-0.13550.446283
480.08910.75080.227636


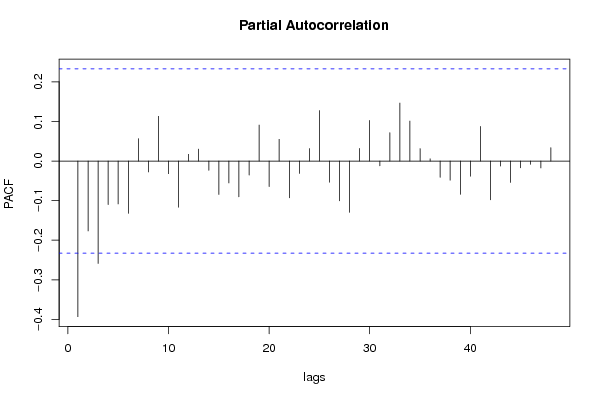
Partial Autocorrelation Function
Time lag kPACF(k)T-STATP-value
1-0.39322-3.31330.000727
2-0.176597-1.4880.070585
3-0.258659-2.17950.016307
4-0.109946-0.92640.178682
5-0.108397-0.91340.18207
6-0.132246-1.11430.134449
70.0564410.47560.317917
8-0.027756-0.23390.407876
90.1130410.95250.172036
10-0.032073-0.27030.393874
11-0.116555-0.98210.16469
120.0170850.1440.442971
130.0300510.25320.400418
14-0.023543-0.19840.421658
15-0.084546-0.71240.239277
16-0.055326-0.46620.321255
17-0.090551-0.7630.223997
18-0.035484-0.2990.382909
190.0909350.76620.22304
20-0.064424-0.54280.294467
210.0547160.4610.323089
22-0.092838-0.78230.218331
23-0.031297-0.26370.396384
240.0315560.26590.395546
250.1276241.07540.142924
26-0.053519-0.4510.326697
27-0.100693-0.84850.199518
28-0.129575-1.09180.139303
290.0317610.26760.394884
300.1024610.86330.195427
31-0.012143-0.10230.459397
320.0715890.60320.274143
330.1464041.23360.110706
340.1009740.85080.198863
350.0313140.26390.396328
360.0056370.04750.481126
37-0.041235-0.34750.364638
38-0.048495-0.40860.342022
39-0.084191-0.70940.240198
40-0.038313-0.32280.373885
410.0872260.7350.232385
42-0.097949-0.82530.205974
43-0.012613-0.10630.457831
44-0.054225-0.45690.324567
45-0.017263-0.14550.442379
46-0.008424-0.0710.471807
47-0.017472-0.14720.441686
480.0335640.28280.38907

\begin{tabular}{lllllllll}
\hline
Partial Autocorrelation Function \tabularnewline
Time lag k & PACF(k) & T-STAT & P-value \tabularnewline
1 & -0.39322 & -3.3133 & 0.000727 \tabularnewline
2 & -0.176597 & -1.488 & 0.070585 \tabularnewline
3 & -0.258659 & -2.1795 & 0.016307 \tabularnewline
4 & -0.109946 & -0.9264 & 0.178682 \tabularnewline
5 & -0.108397 & -0.9134 & 0.18207 \tabularnewline
6 & -0.132246 & -1.1143 & 0.134449 \tabularnewline
7 & 0.056441 & 0.4756 & 0.317917 \tabularnewline
8 & -0.027756 & -0.2339 & 0.407876 \tabularnewline
9 & 0.113041 & 0.9525 & 0.172036 \tabularnewline
10 & -0.032073 & -0.2703 & 0.393874 \tabularnewline
11 & -0.116555 & -0.9821 & 0.16469 \tabularnewline
12 & 0.017085 & 0.144 & 0.442971 \tabularnewline
13 & 0.030051 & 0.2532 & 0.400418 \tabularnewline
14 & -0.023543 & -0.1984 & 0.421658 \tabularnewline
15 & -0.084546 & -0.7124 & 0.239277 \tabularnewline
16 & -0.055326 & -0.4662 & 0.321255 \tabularnewline
17 & -0.090551 & -0.763 & 0.223997 \tabularnewline
18 & -0.035484 & -0.299 & 0.382909 \tabularnewline
19 & 0.090935 & 0.7662 & 0.22304 \tabularnewline
20 & -0.064424 & -0.5428 & 0.294467 \tabularnewline
21 & 0.054716 & 0.461 & 0.323089 \tabularnewline
22 & -0.092838 & -0.7823 & 0.218331 \tabularnewline
23 & -0.031297 & -0.2637 & 0.396384 \tabularnewline
24 & 0.031556 & 0.2659 & 0.395546 \tabularnewline
25 & 0.127624 & 1.0754 & 0.142924 \tabularnewline
26 & -0.053519 & -0.451 & 0.326697 \tabularnewline
27 & -0.100693 & -0.8485 & 0.199518 \tabularnewline
28 & -0.129575 & -1.0918 & 0.139303 \tabularnewline
29 & 0.031761 & 0.2676 & 0.394884 \tabularnewline
30 & 0.102461 & 0.8633 & 0.195427 \tabularnewline
31 & -0.012143 & -0.1023 & 0.459397 \tabularnewline
32 & 0.071589 & 0.6032 & 0.274143 \tabularnewline
33 & 0.146404 & 1.2336 & 0.110706 \tabularnewline
34 & 0.100974 & 0.8508 & 0.198863 \tabularnewline
35 & 0.031314 & 0.2639 & 0.396328 \tabularnewline
36 & 0.005637 & 0.0475 & 0.481126 \tabularnewline
37 & -0.041235 & -0.3475 & 0.364638 \tabularnewline
38 & -0.048495 & -0.4086 & 0.342022 \tabularnewline
39 & -0.084191 & -0.7094 & 0.240198 \tabularnewline
40 & -0.038313 & -0.3228 & 0.373885 \tabularnewline
41 & 0.087226 & 0.735 & 0.232385 \tabularnewline
42 & -0.097949 & -0.8253 & 0.205974 \tabularnewline
43 & -0.012613 & -0.1063 & 0.457831 \tabularnewline
44 & -0.054225 & -0.4569 & 0.324567 \tabularnewline
45 & -0.017263 & -0.1455 & 0.442379 \tabularnewline
46 & -0.008424 & -0.071 & 0.471807 \tabularnewline
47 & -0.017472 & -0.1472 & 0.441686 \tabularnewline
48 & 0.033564 & 0.2828 & 0.38907 \tabularnewline
\hline
\end{tabular}
%Source: https://freestatistics.org/blog/index.php?pk=96754&T=2

[TABLE]
[ROW][C]Partial Autocorrelation Function[/C][/ROW]
[ROW][C]Time lag k[/C][C]PACF(k)[/C][C]T-STAT[/C][C]P-value[/C][/ROW]
[ROW][C]1[/C][C]-0.39322[/C][C]-3.3133[/C][C]0.000727[/C][/ROW]
[ROW][C]2[/C][C]-0.176597[/C][C]-1.488[/C][C]0.070585[/C][/ROW]
[ROW][C]3[/C][C]-0.258659[/C][C]-2.1795[/C][C]0.016307[/C][/ROW]
[ROW][C]4[/C][C]-0.109946[/C][C]-0.9264[/C][C]0.178682[/C][/ROW]
[ROW][C]5[/C][C]-0.108397[/C][C]-0.9134[/C][C]0.18207[/C][/ROW]
[ROW][C]6[/C][C]-0.132246[/C][C]-1.1143[/C][C]0.134449[/C][/ROW]
[ROW][C]7[/C][C]0.056441[/C][C]0.4756[/C][C]0.317917[/C][/ROW]
[ROW][C]8[/C][C]-0.027756[/C][C]-0.2339[/C][C]0.407876[/C][/ROW]
[ROW][C]9[/C][C]0.113041[/C][C]0.9525[/C][C]0.172036[/C][/ROW]
[ROW][C]10[/C][C]-0.032073[/C][C]-0.2703[/C][C]0.393874[/C][/ROW]
[ROW][C]11[/C][C]-0.116555[/C][C]-0.9821[/C][C]0.16469[/C][/ROW]
[ROW][C]12[/C][C]0.017085[/C][C]0.144[/C][C]0.442971[/C][/ROW]
[ROW][C]13[/C][C]0.030051[/C][C]0.2532[/C][C]0.400418[/C][/ROW]
[ROW][C]14[/C][C]-0.023543[/C][C]-0.1984[/C][C]0.421658[/C][/ROW]
[ROW][C]15[/C][C]-0.084546[/C][C]-0.7124[/C][C]0.239277[/C][/ROW]
[ROW][C]16[/C][C]-0.055326[/C][C]-0.4662[/C][C]0.321255[/C][/ROW]
[ROW][C]17[/C][C]-0.090551[/C][C]-0.763[/C][C]0.223997[/C][/ROW]
[ROW][C]18[/C][C]-0.035484[/C][C]-0.299[/C][C]0.382909[/C][/ROW]
[ROW][C]19[/C][C]0.090935[/C][C]0.7662[/C][C]0.22304[/C][/ROW]
[ROW][C]20[/C][C]-0.064424[/C][C]-0.5428[/C][C]0.294467[/C][/ROW]
[ROW][C]21[/C][C]0.054716[/C][C]0.461[/C][C]0.323089[/C][/ROW]
[ROW][C]22[/C][C]-0.092838[/C][C]-0.7823[/C][C]0.218331[/C][/ROW]
[ROW][C]23[/C][C]-0.031297[/C][C]-0.2637[/C][C]0.396384[/C][/ROW]
[ROW][C]24[/C][C]0.031556[/C][C]0.2659[/C][C]0.395546[/C][/ROW]
[ROW][C]25[/C][C]0.127624[/C][C]1.0754[/C][C]0.142924[/C][/ROW]
[ROW][C]26[/C][C]-0.053519[/C][C]-0.451[/C][C]0.326697[/C][/ROW]
[ROW][C]27[/C][C]-0.100693[/C][C]-0.8485[/C][C]0.199518[/C][/ROW]
[ROW][C]28[/C][C]-0.129575[/C][C]-1.0918[/C][C]0.139303[/C][/ROW]
[ROW][C]29[/C][C]0.031761[/C][C]0.2676[/C][C]0.394884[/C][/ROW]
[ROW][C]30[/C][C]0.102461[/C][C]0.8633[/C][C]0.195427[/C][/ROW]
[ROW][C]31[/C][C]-0.012143[/C][C]-0.1023[/C][C]0.459397[/C][/ROW]
[ROW][C]32[/C][C]0.071589[/C][C]0.6032[/C][C]0.274143[/C][/ROW]
[ROW][C]33[/C][C]0.146404[/C][C]1.2336[/C][C]0.110706[/C][/ROW]
[ROW][C]34[/C][C]0.100974[/C][C]0.8508[/C][C]0.198863[/C][/ROW]
[ROW][C]35[/C][C]0.031314[/C][C]0.2639[/C][C]0.396328[/C][/ROW]
[ROW][C]36[/C][C]0.005637[/C][C]0.0475[/C][C]0.481126[/C][/ROW]
[ROW][C]37[/C][C]-0.041235[/C][C]-0.3475[/C][C]0.364638[/C][/ROW]
[ROW][C]38[/C][C]-0.048495[/C][C]-0.4086[/C][C]0.342022[/C][/ROW]
[ROW][C]39[/C][C]-0.084191[/C][C]-0.7094[/C][C]0.240198[/C][/ROW]
[ROW][C]40[/C][C]-0.038313[/C][C]-0.3228[/C][C]0.373885[/C][/ROW]
[ROW][C]41[/C][C]0.087226[/C][C]0.735[/C][C]0.232385[/C][/ROW]
[ROW][C]42[/C][C]-0.097949[/C][C]-0.8253[/C][C]0.205974[/C][/ROW]
[ROW][C]43[/C][C]-0.012613[/C][C]-0.1063[/C][C]0.457831[/C][/ROW]
[ROW][C]44[/C][C]-0.054225[/C][C]-0.4569[/C][C]0.324567[/C][/ROW]
[ROW][C]45[/C][C]-0.017263[/C][C]-0.1455[/C][C]0.442379[/C][/ROW]
[ROW][C]46[/C][C]-0.008424[/C][C]-0.071[/C][C]0.471807[/C][/ROW]
[ROW][C]47[/C][C]-0.017472[/C][C]-0.1472[/C][C]0.441686[/C][/ROW]
[ROW][C]48[/C][C]0.033564[/C][C]0.2828[/C][C]0.38907[/C][/ROW]
[/TABLE]
Source: https://freestatistics.org/blog/index.php?pk=96754&T=2

Globally Unique Identifier (entire table): ba.freestatistics.org/blog/index.php?pk=96754&T=2

As an alternative you can also use a QR Code:  

The GUIDs for individual cells are displayed in the table below:

Partial Autocorrelation Function
Time lag kPACF(k)T-STATP-value
1-0.39322-3.31330.000727
2-0.176597-1.4880.070585
3-0.258659-2.17950.016307
4-0.109946-0.92640.178682
5-0.108397-0.91340.18207
6-0.132246-1.11430.134449
70.0564410.47560.317917
8-0.027756-0.23390.407876
90.1130410.95250.172036
10-0.032073-0.27030.393874
11-0.116555-0.98210.16469
120.0170850.1440.442971
130.0300510.25320.400418
14-0.023543-0.19840.421658
15-0.084546-0.71240.239277
16-0.055326-0.46620.321255
17-0.090551-0.7630.223997
18-0.035484-0.2990.382909
190.0909350.76620.22304
20-0.064424-0.54280.294467
210.0547160.4610.323089
22-0.092838-0.78230.218331
23-0.031297-0.26370.396384
240.0315560.26590.395546
250.1276241.07540.142924
26-0.053519-0.4510.326697
27-0.100693-0.84850.199518
28-0.129575-1.09180.139303
290.0317610.26760.394884
300.1024610.86330.195427
31-0.012143-0.10230.459397
320.0715890.60320.274143
330.1464041.23360.110706
340.1009740.85080.198863
350.0313140.26390.396328
360.0056370.04750.481126
37-0.041235-0.34750.364638
38-0.048495-0.40860.342022
39-0.084191-0.70940.240198
40-0.038313-0.32280.373885
410.0872260.7350.232385
42-0.097949-0.82530.205974
43-0.012613-0.10630.457831
44-0.054225-0.45690.324567
45-0.017263-0.14550.442379
46-0.008424-0.0710.471807
47-0.017472-0.14720.441686
480.0335640.28280.38907


Parameters (Session):
par1 = 48 ; par2 = 1 ; par3 = 1 ; par4 = 0 ; par5 = 12 ; par6 = White Noise ; par7 = 0.95 ;
Parameters (R input):
par1 = 48 ; par2 = 1 ; par3 = 1 ; par4 = 0 ; par5 = 12 ; par6 = White Noise ; par7 = 0.95 ;
R code (references can be found in the software module):
if (par1 == 'Default') {
par1 = 10*log10(length(x))
} else {
par1 <- as.numeric(par1)
}
par2 <- as.numeric(par2)
par3 <- as.numeric(par3)
par4 <- as.numeric(par4)
par5 <- as.numeric(par5)
if (par6 == 'White Noise') par6 <- 'white' else par6 <- 'ma'
par7 <- as.numeric(par7)
if (par2 == 0) {
x <- log(x)
} else {
x <- (x ^ par2 - 1) / par2
}
if (par3 > 0) x <- diff(x,lag=1,difference=par3)
if (par4 > 0) x <- diff(x,lag=par5,difference=par4)
bitmap(file='pic1.png')
racf <- acf(x, par1, main='Autocorrelation', xlab='time lag', ylab='ACF', ci.type=par6, ci=par7, sub=paste('(lambda=',par2,', d=',par3,', D=',par4,', CI=', par7, ', CI type=',par6,')',sep=''))
dev.off()
bitmap(file='pic2.png')
rpacf <- pacf(x,par1,main='Partial Autocorrelation',xlab='lags',ylab='PACF')
dev.off()
(myacf <- c(racf$acf))
(mypacf <- c(rpacf$acf))
lengthx <- length(x)
sqrtn <- sqrt(lengthx)
load(file='createtable')
a<-table.start()
a<-table.row.start(a)
a<-table.element(a,'Autocorrelation Function',4,TRUE)
a<-table.row.end(a)
a<-table.row.start(a)
a<-table.element(a,'Time lag k',header=TRUE)
a<-table.element(a,hyperlink('basics.htm','ACF(k)','click here for more information about the Autocorrelation Function'),header=TRUE)
a<-table.element(a,'T-STAT',header=TRUE)
a<-table.element(a,'P-value',header=TRUE)
a<-table.row.end(a)
for (i in 2:(par1+1)) {
a<-table.row.start(a)
a<-table.element(a,i-1,header=TRUE)
a<-table.element(a,round(myacf[i],6))
mytstat <- myacf[i]*sqrtn
a<-table.element(a,round(mytstat,4))
a<-table.element(a,round(1-pt(abs(mytstat),lengthx),6))
a<-table.row.end(a)
}
a<-table.end(a)
table.save(a,file='mytable.tab')
a<-table.start()
a<-table.row.start(a)
a<-table.element(a,'Partial Autocorrelation Function',4,TRUE)
a<-table.row.end(a)
a<-table.row.start(a)
a<-table.element(a,'Time lag k',header=TRUE)
a<-table.element(a,hyperlink('basics.htm','PACF(k)','click here for more information about the Partial Autocorrelation Function'),header=TRUE)
a<-table.element(a,'T-STAT',header=TRUE)
a<-table.element(a,'P-value',header=TRUE)
a<-table.row.end(a)
for (i in 1:par1) {
a<-table.row.start(a)
a<-table.element(a,i,header=TRUE)
a<-table.element(a,round(mypacf[i],6))
mytstat <- mypacf[i]*sqrtn
a<-table.element(a,round(mytstat,4))
a<-table.element(a,round(1-pt(abs(mytstat),lengthx),6))
a<-table.row.end(a)
}
a<-table.end(a)
table.save(a,file='mytable1.tab')