Free Statistics

of Irreproducible Research!

Author's title

Author*Unverified author*
R Software Modulerwasp_autocorrelation.wasp
Title produced by software(Partial) Autocorrelation Function
Date of computationWed, 17 Nov 2010 15:54:31 +0000
Cite this page as followsStatistical Computations at FreeStatistics.org, Office for Research Development and Education, URL https://freestatistics.org/blog/index.php?v=date/2010/Nov/17/t1290009179cnx1jrq9em2b33k.htm/, Retrieved Fri, 26 Apr 2024 22:40:26 +0000
Statistical Computations at FreeStatistics.org, Office for Research Development and Education, URL https://freestatistics.org/blog/index.php?pk=96749, Retrieved Fri, 26 Apr 2024 22:40:26 +0000
QR Codes:

Original text written by user:
IsPrivate?No (this computation is public)
User-defined keywordsKDGP2W12
Estimated Impact115
Family? (F = Feedback message, R = changed R code, M = changed R Module, P = changed Parameters, D = changed Data)
-       [(Partial) Autocorrelation Function] [] [2010-11-17 15:54:31] [d05b5f5c1bde1241a89791f96cf6e071] [Current]
Feedback Forum

Post a new message
Dataseries X:
47
19
52
136
80
42
54
66
81
63
137
72
107
58
36
52
79
77
54
84
48
96
83
66
61
53
30
74
69
59
42
65
70
100
63
105
82
81
75
102
121
98
76
77
63
37
35
23
40
29
37
51
20
28
13
22
25
13
16
13
16
17
9
17
25
14
8
7
10
7
10
3


Summary of computational transaction
Raw Inputview raw input (R code)
Raw Outputview raw output of R engine
Computing time2 seconds
R Server'RServer@AstonUniversity' @ vre.aston.ac.uk

\begin{tabular}{lllllllll}
\hline
Summary of computational transaction \tabularnewline
Raw Input & view raw input (R code)  \tabularnewline
Raw Output & view raw output of R engine  \tabularnewline
Computing time & 2 seconds \tabularnewline
R Server & 'RServer@AstonUniversity' @ vre.aston.ac.uk \tabularnewline
\hline
\end{tabular}
%Source: https://freestatistics.org/blog/index.php?pk=96749&T=0

[TABLE]
[ROW][C]Summary of computational transaction[/C][/ROW]
[ROW][C]Raw Input[/C][C]view raw input (R code) [/C][/ROW]
[ROW][C]Raw Output[/C][C]view raw output of R engine [/C][/ROW]
[ROW][C]Computing time[/C][C]2 seconds[/C][/ROW]
[ROW][C]R Server[/C][C]'RServer@AstonUniversity' @ vre.aston.ac.uk[/C][/ROW]
[/TABLE]
Source: https://freestatistics.org/blog/index.php?pk=96749&T=0

Globally Unique Identifier (entire table): ba.freestatistics.org/blog/index.php?pk=96749&T=0

As an alternative you can also use a QR Code:  

The GUIDs for individual cells are displayed in the table below:

Summary of computational transaction
Raw Inputview raw input (R code)
Raw Outputview raw output of R engine
Computing time2 seconds
R Server'RServer@AstonUniversity' @ vre.aston.ac.uk


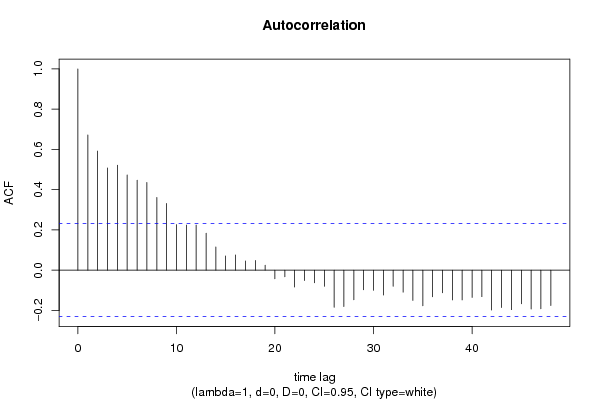
Autocorrelation Function
Time lag kACF(k)T-STATP-value
10.6723155.70480
20.591835.02182e-06
30.5081874.31212.5e-05
40.52194.42851.7e-05
50.4730424.01397.2e-05
60.4471273.7940.000153
70.4357973.69790.000211
80.3616123.06840.001516
90.3316522.81420.003151
100.2264731.92170.029302
110.2240351.9010.030653
120.2240341.9010.030653
130.1833071.55540.062117
140.1153120.97850.165562
150.0702130.59580.276596
160.0751270.63750.262918
170.0454810.38590.350348
180.0485460.41190.34081
190.0246330.2090.417511
20-0.042868-0.36370.358556
21-0.032594-0.27660.391453
22-0.08333-0.70710.240899
23-0.051657-0.43830.331231
24-0.063057-0.53510.29713
25-0.080344-0.68170.248796
26-0.184053-1.56170.061367
27-0.180755-1.53380.064736
28-0.147547-1.2520.107315
29-0.09699-0.8230.206617
30-0.099721-0.84620.200134
31-0.12331-1.04630.149456
32-0.079974-0.67860.249783
33-0.109309-0.92750.178377
34-0.150348-1.27570.103073
35-0.177329-1.50470.06839
36-0.132209-1.12180.132831
37-0.112638-0.95580.171196
38-0.147637-1.25270.107176
39-0.147707-1.25330.10707
40-0.135366-1.14860.127258
41-0.131714-1.11760.13372
42-0.198496-1.68430.048228
43-0.18524-1.57180.060189
44-0.196085-1.66380.050246
45-0.167157-1.41840.080198
46-0.193044-1.6380.052889
47-0.191631-1.6260.054155
48-0.175903-1.49260.069957

\begin{tabular}{lllllllll}
\hline
Autocorrelation Function \tabularnewline
Time lag k & ACF(k) & T-STAT & P-value \tabularnewline
1 & 0.672315 & 5.7048 & 0 \tabularnewline
2 & 0.59183 & 5.0218 & 2e-06 \tabularnewline
3 & 0.508187 & 4.3121 & 2.5e-05 \tabularnewline
4 & 0.5219 & 4.4285 & 1.7e-05 \tabularnewline
5 & 0.473042 & 4.0139 & 7.2e-05 \tabularnewline
6 & 0.447127 & 3.794 & 0.000153 \tabularnewline
7 & 0.435797 & 3.6979 & 0.000211 \tabularnewline
8 & 0.361612 & 3.0684 & 0.001516 \tabularnewline
9 & 0.331652 & 2.8142 & 0.003151 \tabularnewline
10 & 0.226473 & 1.9217 & 0.029302 \tabularnewline
11 & 0.224035 & 1.901 & 0.030653 \tabularnewline
12 & 0.224034 & 1.901 & 0.030653 \tabularnewline
13 & 0.183307 & 1.5554 & 0.062117 \tabularnewline
14 & 0.115312 & 0.9785 & 0.165562 \tabularnewline
15 & 0.070213 & 0.5958 & 0.276596 \tabularnewline
16 & 0.075127 & 0.6375 & 0.262918 \tabularnewline
17 & 0.045481 & 0.3859 & 0.350348 \tabularnewline
18 & 0.048546 & 0.4119 & 0.34081 \tabularnewline
19 & 0.024633 & 0.209 & 0.417511 \tabularnewline
20 & -0.042868 & -0.3637 & 0.358556 \tabularnewline
21 & -0.032594 & -0.2766 & 0.391453 \tabularnewline
22 & -0.08333 & -0.7071 & 0.240899 \tabularnewline
23 & -0.051657 & -0.4383 & 0.331231 \tabularnewline
24 & -0.063057 & -0.5351 & 0.29713 \tabularnewline
25 & -0.080344 & -0.6817 & 0.248796 \tabularnewline
26 & -0.184053 & -1.5617 & 0.061367 \tabularnewline
27 & -0.180755 & -1.5338 & 0.064736 \tabularnewline
28 & -0.147547 & -1.252 & 0.107315 \tabularnewline
29 & -0.09699 & -0.823 & 0.206617 \tabularnewline
30 & -0.099721 & -0.8462 & 0.200134 \tabularnewline
31 & -0.12331 & -1.0463 & 0.149456 \tabularnewline
32 & -0.079974 & -0.6786 & 0.249783 \tabularnewline
33 & -0.109309 & -0.9275 & 0.178377 \tabularnewline
34 & -0.150348 & -1.2757 & 0.103073 \tabularnewline
35 & -0.177329 & -1.5047 & 0.06839 \tabularnewline
36 & -0.132209 & -1.1218 & 0.132831 \tabularnewline
37 & -0.112638 & -0.9558 & 0.171196 \tabularnewline
38 & -0.147637 & -1.2527 & 0.107176 \tabularnewline
39 & -0.147707 & -1.2533 & 0.10707 \tabularnewline
40 & -0.135366 & -1.1486 & 0.127258 \tabularnewline
41 & -0.131714 & -1.1176 & 0.13372 \tabularnewline
42 & -0.198496 & -1.6843 & 0.048228 \tabularnewline
43 & -0.18524 & -1.5718 & 0.060189 \tabularnewline
44 & -0.196085 & -1.6638 & 0.050246 \tabularnewline
45 & -0.167157 & -1.4184 & 0.080198 \tabularnewline
46 & -0.193044 & -1.638 & 0.052889 \tabularnewline
47 & -0.191631 & -1.626 & 0.054155 \tabularnewline
48 & -0.175903 & -1.4926 & 0.069957 \tabularnewline
\hline
\end{tabular}
%Source: https://freestatistics.org/blog/index.php?pk=96749&T=1

[TABLE]
[ROW][C]Autocorrelation Function[/C][/ROW]
[ROW][C]Time lag k[/C][C]ACF(k)[/C][C]T-STAT[/C][C]P-value[/C][/ROW]
[ROW][C]1[/C][C]0.672315[/C][C]5.7048[/C][C]0[/C][/ROW]
[ROW][C]2[/C][C]0.59183[/C][C]5.0218[/C][C]2e-06[/C][/ROW]
[ROW][C]3[/C][C]0.508187[/C][C]4.3121[/C][C]2.5e-05[/C][/ROW]
[ROW][C]4[/C][C]0.5219[/C][C]4.4285[/C][C]1.7e-05[/C][/ROW]
[ROW][C]5[/C][C]0.473042[/C][C]4.0139[/C][C]7.2e-05[/C][/ROW]
[ROW][C]6[/C][C]0.447127[/C][C]3.794[/C][C]0.000153[/C][/ROW]
[ROW][C]7[/C][C]0.435797[/C][C]3.6979[/C][C]0.000211[/C][/ROW]
[ROW][C]8[/C][C]0.361612[/C][C]3.0684[/C][C]0.001516[/C][/ROW]
[ROW][C]9[/C][C]0.331652[/C][C]2.8142[/C][C]0.003151[/C][/ROW]
[ROW][C]10[/C][C]0.226473[/C][C]1.9217[/C][C]0.029302[/C][/ROW]
[ROW][C]11[/C][C]0.224035[/C][C]1.901[/C][C]0.030653[/C][/ROW]
[ROW][C]12[/C][C]0.224034[/C][C]1.901[/C][C]0.030653[/C][/ROW]
[ROW][C]13[/C][C]0.183307[/C][C]1.5554[/C][C]0.062117[/C][/ROW]
[ROW][C]14[/C][C]0.115312[/C][C]0.9785[/C][C]0.165562[/C][/ROW]
[ROW][C]15[/C][C]0.070213[/C][C]0.5958[/C][C]0.276596[/C][/ROW]
[ROW][C]16[/C][C]0.075127[/C][C]0.6375[/C][C]0.262918[/C][/ROW]
[ROW][C]17[/C][C]0.045481[/C][C]0.3859[/C][C]0.350348[/C][/ROW]
[ROW][C]18[/C][C]0.048546[/C][C]0.4119[/C][C]0.34081[/C][/ROW]
[ROW][C]19[/C][C]0.024633[/C][C]0.209[/C][C]0.417511[/C][/ROW]
[ROW][C]20[/C][C]-0.042868[/C][C]-0.3637[/C][C]0.358556[/C][/ROW]
[ROW][C]21[/C][C]-0.032594[/C][C]-0.2766[/C][C]0.391453[/C][/ROW]
[ROW][C]22[/C][C]-0.08333[/C][C]-0.7071[/C][C]0.240899[/C][/ROW]
[ROW][C]23[/C][C]-0.051657[/C][C]-0.4383[/C][C]0.331231[/C][/ROW]
[ROW][C]24[/C][C]-0.063057[/C][C]-0.5351[/C][C]0.29713[/C][/ROW]
[ROW][C]25[/C][C]-0.080344[/C][C]-0.6817[/C][C]0.248796[/C][/ROW]
[ROW][C]26[/C][C]-0.184053[/C][C]-1.5617[/C][C]0.061367[/C][/ROW]
[ROW][C]27[/C][C]-0.180755[/C][C]-1.5338[/C][C]0.064736[/C][/ROW]
[ROW][C]28[/C][C]-0.147547[/C][C]-1.252[/C][C]0.107315[/C][/ROW]
[ROW][C]29[/C][C]-0.09699[/C][C]-0.823[/C][C]0.206617[/C][/ROW]
[ROW][C]30[/C][C]-0.099721[/C][C]-0.8462[/C][C]0.200134[/C][/ROW]
[ROW][C]31[/C][C]-0.12331[/C][C]-1.0463[/C][C]0.149456[/C][/ROW]
[ROW][C]32[/C][C]-0.079974[/C][C]-0.6786[/C][C]0.249783[/C][/ROW]
[ROW][C]33[/C][C]-0.109309[/C][C]-0.9275[/C][C]0.178377[/C][/ROW]
[ROW][C]34[/C][C]-0.150348[/C][C]-1.2757[/C][C]0.103073[/C][/ROW]
[ROW][C]35[/C][C]-0.177329[/C][C]-1.5047[/C][C]0.06839[/C][/ROW]
[ROW][C]36[/C][C]-0.132209[/C][C]-1.1218[/C][C]0.132831[/C][/ROW]
[ROW][C]37[/C][C]-0.112638[/C][C]-0.9558[/C][C]0.171196[/C][/ROW]
[ROW][C]38[/C][C]-0.147637[/C][C]-1.2527[/C][C]0.107176[/C][/ROW]
[ROW][C]39[/C][C]-0.147707[/C][C]-1.2533[/C][C]0.10707[/C][/ROW]
[ROW][C]40[/C][C]-0.135366[/C][C]-1.1486[/C][C]0.127258[/C][/ROW]
[ROW][C]41[/C][C]-0.131714[/C][C]-1.1176[/C][C]0.13372[/C][/ROW]
[ROW][C]42[/C][C]-0.198496[/C][C]-1.6843[/C][C]0.048228[/C][/ROW]
[ROW][C]43[/C][C]-0.18524[/C][C]-1.5718[/C][C]0.060189[/C][/ROW]
[ROW][C]44[/C][C]-0.196085[/C][C]-1.6638[/C][C]0.050246[/C][/ROW]
[ROW][C]45[/C][C]-0.167157[/C][C]-1.4184[/C][C]0.080198[/C][/ROW]
[ROW][C]46[/C][C]-0.193044[/C][C]-1.638[/C][C]0.052889[/C][/ROW]
[ROW][C]47[/C][C]-0.191631[/C][C]-1.626[/C][C]0.054155[/C][/ROW]
[ROW][C]48[/C][C]-0.175903[/C][C]-1.4926[/C][C]0.069957[/C][/ROW]
[/TABLE]
Source: https://freestatistics.org/blog/index.php?pk=96749&T=1

Globally Unique Identifier (entire table): ba.freestatistics.org/blog/index.php?pk=96749&T=1

As an alternative you can also use a QR Code:  

The GUIDs for individual cells are displayed in the table below:

Autocorrelation Function
Time lag kACF(k)T-STATP-value
10.6723155.70480
20.591835.02182e-06
30.5081874.31212.5e-05
40.52194.42851.7e-05
50.4730424.01397.2e-05
60.4471273.7940.000153
70.4357973.69790.000211
80.3616123.06840.001516
90.3316522.81420.003151
100.2264731.92170.029302
110.2240351.9010.030653
120.2240341.9010.030653
130.1833071.55540.062117
140.1153120.97850.165562
150.0702130.59580.276596
160.0751270.63750.262918
170.0454810.38590.350348
180.0485460.41190.34081
190.0246330.2090.417511
20-0.042868-0.36370.358556
21-0.032594-0.27660.391453
22-0.08333-0.70710.240899
23-0.051657-0.43830.331231
24-0.063057-0.53510.29713
25-0.080344-0.68170.248796
26-0.184053-1.56170.061367
27-0.180755-1.53380.064736
28-0.147547-1.2520.107315
29-0.09699-0.8230.206617
30-0.099721-0.84620.200134
31-0.12331-1.04630.149456
32-0.079974-0.67860.249783
33-0.109309-0.92750.178377
34-0.150348-1.27570.103073
35-0.177329-1.50470.06839
36-0.132209-1.12180.132831
37-0.112638-0.95580.171196
38-0.147637-1.25270.107176
39-0.147707-1.25330.10707
40-0.135366-1.14860.127258
41-0.131714-1.11760.13372
42-0.198496-1.68430.048228
43-0.18524-1.57180.060189
44-0.196085-1.66380.050246
45-0.167157-1.41840.080198
46-0.193044-1.6380.052889
47-0.191631-1.6260.054155
48-0.175903-1.49260.069957


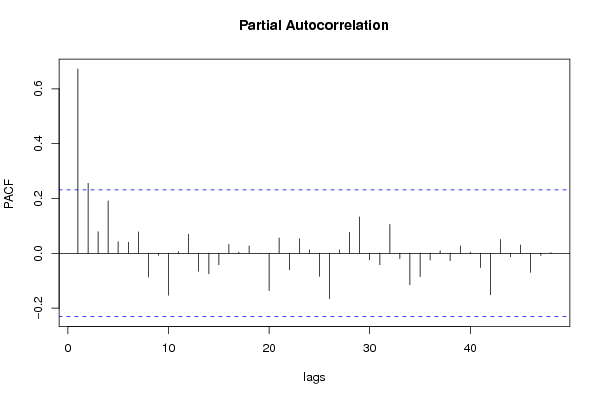
Partial Autocorrelation Function
Time lag kPACF(k)T-STATP-value
10.6723155.70480
20.2551532.1650.01685
30.0786080.6670.253449
40.1906071.61740.055088
50.0423430.35930.360214
60.0407610.34590.365226
70.0775810.65830.256223
8-0.086091-0.73050.233726
9-0.006873-0.05830.476829
10-0.152572-1.29460.099794
110.0058250.04940.480359
120.069380.58870.278951
13-0.065126-0.55260.291122
14-0.07433-0.63070.265112
15-0.041543-0.35250.362745
160.0324580.27540.391893
170.0039670.03370.486621
180.0267620.22710.410502
19-0.000219-0.00190.499262
20-0.13579-1.15220.126522
210.0557530.47310.318793
22-0.060283-0.51150.305278
230.0528890.44880.32747
240.0119210.10120.459855
25-0.084293-0.71530.238384
26-0.166076-1.40920.08154
270.0119830.10170.459647
280.0766230.65020.258828
290.1322321.1220.13279
30-0.024064-0.20420.419389
31-0.042126-0.35740.3609
320.1049040.89010.188178
33-0.018702-0.15870.43718
34-0.114508-0.97160.167243
35-0.084525-0.71720.23778
36-0.024454-0.20750.418103
370.0091990.07810.468999
38-0.026387-0.22390.411734
390.0263940.2240.411712
400.0037950.03220.4872
41-0.051928-0.44060.330403
42-0.151226-1.28320.101769
430.0508190.43120.3338
44-0.012493-0.1060.457934
450.0306760.26030.39769
46-0.069213-0.58730.279421
47-0.008169-0.06930.472465
480.002590.0220.491264

\begin{tabular}{lllllllll}
\hline
Partial Autocorrelation Function \tabularnewline
Time lag k & PACF(k) & T-STAT & P-value \tabularnewline
1 & 0.672315 & 5.7048 & 0 \tabularnewline
2 & 0.255153 & 2.165 & 0.01685 \tabularnewline
3 & 0.078608 & 0.667 & 0.253449 \tabularnewline
4 & 0.190607 & 1.6174 & 0.055088 \tabularnewline
5 & 0.042343 & 0.3593 & 0.360214 \tabularnewline
6 & 0.040761 & 0.3459 & 0.365226 \tabularnewline
7 & 0.077581 & 0.6583 & 0.256223 \tabularnewline
8 & -0.086091 & -0.7305 & 0.233726 \tabularnewline
9 & -0.006873 & -0.0583 & 0.476829 \tabularnewline
10 & -0.152572 & -1.2946 & 0.099794 \tabularnewline
11 & 0.005825 & 0.0494 & 0.480359 \tabularnewline
12 & 0.06938 & 0.5887 & 0.278951 \tabularnewline
13 & -0.065126 & -0.5526 & 0.291122 \tabularnewline
14 & -0.07433 & -0.6307 & 0.265112 \tabularnewline
15 & -0.041543 & -0.3525 & 0.362745 \tabularnewline
16 & 0.032458 & 0.2754 & 0.391893 \tabularnewline
17 & 0.003967 & 0.0337 & 0.486621 \tabularnewline
18 & 0.026762 & 0.2271 & 0.410502 \tabularnewline
19 & -0.000219 & -0.0019 & 0.499262 \tabularnewline
20 & -0.13579 & -1.1522 & 0.126522 \tabularnewline
21 & 0.055753 & 0.4731 & 0.318793 \tabularnewline
22 & -0.060283 & -0.5115 & 0.305278 \tabularnewline
23 & 0.052889 & 0.4488 & 0.32747 \tabularnewline
24 & 0.011921 & 0.1012 & 0.459855 \tabularnewline
25 & -0.084293 & -0.7153 & 0.238384 \tabularnewline
26 & -0.166076 & -1.4092 & 0.08154 \tabularnewline
27 & 0.011983 & 0.1017 & 0.459647 \tabularnewline
28 & 0.076623 & 0.6502 & 0.258828 \tabularnewline
29 & 0.132232 & 1.122 & 0.13279 \tabularnewline
30 & -0.024064 & -0.2042 & 0.419389 \tabularnewline
31 & -0.042126 & -0.3574 & 0.3609 \tabularnewline
32 & 0.104904 & 0.8901 & 0.188178 \tabularnewline
33 & -0.018702 & -0.1587 & 0.43718 \tabularnewline
34 & -0.114508 & -0.9716 & 0.167243 \tabularnewline
35 & -0.084525 & -0.7172 & 0.23778 \tabularnewline
36 & -0.024454 & -0.2075 & 0.418103 \tabularnewline
37 & 0.009199 & 0.0781 & 0.468999 \tabularnewline
38 & -0.026387 & -0.2239 & 0.411734 \tabularnewline
39 & 0.026394 & 0.224 & 0.411712 \tabularnewline
40 & 0.003795 & 0.0322 & 0.4872 \tabularnewline
41 & -0.051928 & -0.4406 & 0.330403 \tabularnewline
42 & -0.151226 & -1.2832 & 0.101769 \tabularnewline
43 & 0.050819 & 0.4312 & 0.3338 \tabularnewline
44 & -0.012493 & -0.106 & 0.457934 \tabularnewline
45 & 0.030676 & 0.2603 & 0.39769 \tabularnewline
46 & -0.069213 & -0.5873 & 0.279421 \tabularnewline
47 & -0.008169 & -0.0693 & 0.472465 \tabularnewline
48 & 0.00259 & 0.022 & 0.491264 \tabularnewline
\hline
\end{tabular}
%Source: https://freestatistics.org/blog/index.php?pk=96749&T=2

[TABLE]
[ROW][C]Partial Autocorrelation Function[/C][/ROW]
[ROW][C]Time lag k[/C][C]PACF(k)[/C][C]T-STAT[/C][C]P-value[/C][/ROW]
[ROW][C]1[/C][C]0.672315[/C][C]5.7048[/C][C]0[/C][/ROW]
[ROW][C]2[/C][C]0.255153[/C][C]2.165[/C][C]0.01685[/C][/ROW]
[ROW][C]3[/C][C]0.078608[/C][C]0.667[/C][C]0.253449[/C][/ROW]
[ROW][C]4[/C][C]0.190607[/C][C]1.6174[/C][C]0.055088[/C][/ROW]
[ROW][C]5[/C][C]0.042343[/C][C]0.3593[/C][C]0.360214[/C][/ROW]
[ROW][C]6[/C][C]0.040761[/C][C]0.3459[/C][C]0.365226[/C][/ROW]
[ROW][C]7[/C][C]0.077581[/C][C]0.6583[/C][C]0.256223[/C][/ROW]
[ROW][C]8[/C][C]-0.086091[/C][C]-0.7305[/C][C]0.233726[/C][/ROW]
[ROW][C]9[/C][C]-0.006873[/C][C]-0.0583[/C][C]0.476829[/C][/ROW]
[ROW][C]10[/C][C]-0.152572[/C][C]-1.2946[/C][C]0.099794[/C][/ROW]
[ROW][C]11[/C][C]0.005825[/C][C]0.0494[/C][C]0.480359[/C][/ROW]
[ROW][C]12[/C][C]0.06938[/C][C]0.5887[/C][C]0.278951[/C][/ROW]
[ROW][C]13[/C][C]-0.065126[/C][C]-0.5526[/C][C]0.291122[/C][/ROW]
[ROW][C]14[/C][C]-0.07433[/C][C]-0.6307[/C][C]0.265112[/C][/ROW]
[ROW][C]15[/C][C]-0.041543[/C][C]-0.3525[/C][C]0.362745[/C][/ROW]
[ROW][C]16[/C][C]0.032458[/C][C]0.2754[/C][C]0.391893[/C][/ROW]
[ROW][C]17[/C][C]0.003967[/C][C]0.0337[/C][C]0.486621[/C][/ROW]
[ROW][C]18[/C][C]0.026762[/C][C]0.2271[/C][C]0.410502[/C][/ROW]
[ROW][C]19[/C][C]-0.000219[/C][C]-0.0019[/C][C]0.499262[/C][/ROW]
[ROW][C]20[/C][C]-0.13579[/C][C]-1.1522[/C][C]0.126522[/C][/ROW]
[ROW][C]21[/C][C]0.055753[/C][C]0.4731[/C][C]0.318793[/C][/ROW]
[ROW][C]22[/C][C]-0.060283[/C][C]-0.5115[/C][C]0.305278[/C][/ROW]
[ROW][C]23[/C][C]0.052889[/C][C]0.4488[/C][C]0.32747[/C][/ROW]
[ROW][C]24[/C][C]0.011921[/C][C]0.1012[/C][C]0.459855[/C][/ROW]
[ROW][C]25[/C][C]-0.084293[/C][C]-0.7153[/C][C]0.238384[/C][/ROW]
[ROW][C]26[/C][C]-0.166076[/C][C]-1.4092[/C][C]0.08154[/C][/ROW]
[ROW][C]27[/C][C]0.011983[/C][C]0.1017[/C][C]0.459647[/C][/ROW]
[ROW][C]28[/C][C]0.076623[/C][C]0.6502[/C][C]0.258828[/C][/ROW]
[ROW][C]29[/C][C]0.132232[/C][C]1.122[/C][C]0.13279[/C][/ROW]
[ROW][C]30[/C][C]-0.024064[/C][C]-0.2042[/C][C]0.419389[/C][/ROW]
[ROW][C]31[/C][C]-0.042126[/C][C]-0.3574[/C][C]0.3609[/C][/ROW]
[ROW][C]32[/C][C]0.104904[/C][C]0.8901[/C][C]0.188178[/C][/ROW]
[ROW][C]33[/C][C]-0.018702[/C][C]-0.1587[/C][C]0.43718[/C][/ROW]
[ROW][C]34[/C][C]-0.114508[/C][C]-0.9716[/C][C]0.167243[/C][/ROW]
[ROW][C]35[/C][C]-0.084525[/C][C]-0.7172[/C][C]0.23778[/C][/ROW]
[ROW][C]36[/C][C]-0.024454[/C][C]-0.2075[/C][C]0.418103[/C][/ROW]
[ROW][C]37[/C][C]0.009199[/C][C]0.0781[/C][C]0.468999[/C][/ROW]
[ROW][C]38[/C][C]-0.026387[/C][C]-0.2239[/C][C]0.411734[/C][/ROW]
[ROW][C]39[/C][C]0.026394[/C][C]0.224[/C][C]0.411712[/C][/ROW]
[ROW][C]40[/C][C]0.003795[/C][C]0.0322[/C][C]0.4872[/C][/ROW]
[ROW][C]41[/C][C]-0.051928[/C][C]-0.4406[/C][C]0.330403[/C][/ROW]
[ROW][C]42[/C][C]-0.151226[/C][C]-1.2832[/C][C]0.101769[/C][/ROW]
[ROW][C]43[/C][C]0.050819[/C][C]0.4312[/C][C]0.3338[/C][/ROW]
[ROW][C]44[/C][C]-0.012493[/C][C]-0.106[/C][C]0.457934[/C][/ROW]
[ROW][C]45[/C][C]0.030676[/C][C]0.2603[/C][C]0.39769[/C][/ROW]
[ROW][C]46[/C][C]-0.069213[/C][C]-0.5873[/C][C]0.279421[/C][/ROW]
[ROW][C]47[/C][C]-0.008169[/C][C]-0.0693[/C][C]0.472465[/C][/ROW]
[ROW][C]48[/C][C]0.00259[/C][C]0.022[/C][C]0.491264[/C][/ROW]
[/TABLE]
Source: https://freestatistics.org/blog/index.php?pk=96749&T=2

Globally Unique Identifier (entire table): ba.freestatistics.org/blog/index.php?pk=96749&T=2

As an alternative you can also use a QR Code:  

The GUIDs for individual cells are displayed in the table below:

Partial Autocorrelation Function
Time lag kPACF(k)T-STATP-value
10.6723155.70480
20.2551532.1650.01685
30.0786080.6670.253449
40.1906071.61740.055088
50.0423430.35930.360214
60.0407610.34590.365226
70.0775810.65830.256223
8-0.086091-0.73050.233726
9-0.006873-0.05830.476829
10-0.152572-1.29460.099794
110.0058250.04940.480359
120.069380.58870.278951
13-0.065126-0.55260.291122
14-0.07433-0.63070.265112
15-0.041543-0.35250.362745
160.0324580.27540.391893
170.0039670.03370.486621
180.0267620.22710.410502
19-0.000219-0.00190.499262
20-0.13579-1.15220.126522
210.0557530.47310.318793
22-0.060283-0.51150.305278
230.0528890.44880.32747
240.0119210.10120.459855
25-0.084293-0.71530.238384
26-0.166076-1.40920.08154
270.0119830.10170.459647
280.0766230.65020.258828
290.1322321.1220.13279
30-0.024064-0.20420.419389
31-0.042126-0.35740.3609
320.1049040.89010.188178
33-0.018702-0.15870.43718
34-0.114508-0.97160.167243
35-0.084525-0.71720.23778
36-0.024454-0.20750.418103
370.0091990.07810.468999
38-0.026387-0.22390.411734
390.0263940.2240.411712
400.0037950.03220.4872
41-0.051928-0.44060.330403
42-0.151226-1.28320.101769
430.0508190.43120.3338
44-0.012493-0.1060.457934
450.0306760.26030.39769
46-0.069213-0.58730.279421
47-0.008169-0.06930.472465
480.002590.0220.491264


Parameters (Session):
par1 = 48 ; par2 = 1 ; par3 = 0 ; par4 = 0 ; par5 = 12 ; par6 = White Noise ; par7 = 0.95 ;
Parameters (R input):
par1 = 48 ; par2 = 1 ; par3 = 0 ; par4 = 0 ; par5 = 12 ; par6 = White Noise ; par7 = 0.95 ;
R code (references can be found in the software module):
if (par1 == 'Default') {
par1 = 10*log10(length(x))
} else {
par1 <- as.numeric(par1)
}
par2 <- as.numeric(par2)
par3 <- as.numeric(par3)
par4 <- as.numeric(par4)
par5 <- as.numeric(par5)
if (par6 == 'White Noise') par6 <- 'white' else par6 <- 'ma'
par7 <- as.numeric(par7)
if (par2 == 0) {
x <- log(x)
} else {
x <- (x ^ par2 - 1) / par2
}
if (par3 > 0) x <- diff(x,lag=1,difference=par3)
if (par4 > 0) x <- diff(x,lag=par5,difference=par4)
bitmap(file='pic1.png')
racf <- acf(x, par1, main='Autocorrelation', xlab='time lag', ylab='ACF', ci.type=par6, ci=par7, sub=paste('(lambda=',par2,', d=',par3,', D=',par4,', CI=', par7, ', CI type=',par6,')',sep=''))
dev.off()
bitmap(file='pic2.png')
rpacf <- pacf(x,par1,main='Partial Autocorrelation',xlab='lags',ylab='PACF')
dev.off()
(myacf <- c(racf$acf))
(mypacf <- c(rpacf$acf))
lengthx <- length(x)
sqrtn <- sqrt(lengthx)
load(file='createtable')
a<-table.start()
a<-table.row.start(a)
a<-table.element(a,'Autocorrelation Function',4,TRUE)
a<-table.row.end(a)
a<-table.row.start(a)
a<-table.element(a,'Time lag k',header=TRUE)
a<-table.element(a,hyperlink('basics.htm','ACF(k)','click here for more information about the Autocorrelation Function'),header=TRUE)
a<-table.element(a,'T-STAT',header=TRUE)
a<-table.element(a,'P-value',header=TRUE)
a<-table.row.end(a)
for (i in 2:(par1+1)) {
a<-table.row.start(a)
a<-table.element(a,i-1,header=TRUE)
a<-table.element(a,round(myacf[i],6))
mytstat <- myacf[i]*sqrtn
a<-table.element(a,round(mytstat,4))
a<-table.element(a,round(1-pt(abs(mytstat),lengthx),6))
a<-table.row.end(a)
}
a<-table.end(a)
table.save(a,file='mytable.tab')
a<-table.start()
a<-table.row.start(a)
a<-table.element(a,'Partial Autocorrelation Function',4,TRUE)
a<-table.row.end(a)
a<-table.row.start(a)
a<-table.element(a,'Time lag k',header=TRUE)
a<-table.element(a,hyperlink('basics.htm','PACF(k)','click here for more information about the Partial Autocorrelation Function'),header=TRUE)
a<-table.element(a,'T-STAT',header=TRUE)
a<-table.element(a,'P-value',header=TRUE)
a<-table.row.end(a)
for (i in 1:par1) {
a<-table.row.start(a)
a<-table.element(a,i,header=TRUE)
a<-table.element(a,round(mypacf[i],6))
mytstat <- mypacf[i]*sqrtn
a<-table.element(a,round(mytstat,4))
a<-table.element(a,round(1-pt(abs(mytstat),lengthx),6))
a<-table.row.end(a)
}
a<-table.end(a)
table.save(a,file='mytable1.tab')