Free Statistics

of Irreproducible Research!

Author's title

Author*Unverified author*
R Software Modulerwasp_autocorrelation.wasp
Title produced by software(Partial) Autocorrelation Function
Date of computationWed, 17 Nov 2010 09:55:53 +0000
Cite this page as followsStatistical Computations at FreeStatistics.org, Office for Research Development and Education, URL https://freestatistics.org/blog/index.php?v=date/2010/Nov/17/t1289987684gs1kin50a4davi2.htm/, Retrieved Thu, 18 Apr 2024 19:27:44 +0000
Statistical Computations at FreeStatistics.org, Office for Research Development and Education, URL https://freestatistics.org/blog/index.php?pk=96575, Retrieved Thu, 18 Apr 2024 19:27:44 +0000
QR Codes:

Original text written by user:
IsPrivate?No (this computation is public)
User-defined keywordsKDGP2W12
Estimated Impact111
Family? (F = Feedback message, R = changed R code, M = changed R Module, P = changed Parameters, D = changed Data)
-       [(Partial) Autocorrelation Function] [opgave 6bis eigen...] [2010-11-17 09:55:53] [63c073ae7ca4ef34c1cc2bde848eb699] [Current]
Feedback Forum

Post a new message
Dataseries X:
89.3
88.1
93.6
79.7
83.8
62.3
62.3
77.6
80.3
97
94
75.1
74
77.6
75.1
85
75.4
63.2
64.7
77
82.6
97.6
99
75.3
71.6
76.8
83.9
79.7
77.5
73.1
65.6
85.2
98.3
98
100.6
84.1
76.7
82.4
95.5
79.9
82.4
83.6
73.1
91.1
118.6
102.9
111.8
93.9
91.6
92
91.1
97.5
94.7
96.7
78.7
103.5
113.8
106.1
120.3
114.2
106.3
98.8
113.1
97.7
116.3
107.2
94.5
123.5
126.6
126.5
141.4
124.3
124.9
108.9
126.7
107.7
121.8
118.3
122.8
149.5
147
139.3
162.1
142.2
141.4
124.7
114
126.6
121.9
125.1
122.1
135.9
148.4
137.5
145.3
139.9
128.2
115.4
124.7
111.5
121.1
122.5
127.4
143.7
157.8
148.8
162.9
153.9


Summary of computational transaction
Raw Inputview raw input (R code)
Raw Outputview raw output of R engine
Computing time1 seconds
R Server'Gwilym Jenkins' @ 72.249.127.135

\begin{tabular}{lllllllll}
\hline
Summary of computational transaction \tabularnewline
Raw Input & view raw input (R code)  \tabularnewline
Raw Output & view raw output of R engine  \tabularnewline
Computing time & 1 seconds \tabularnewline
R Server & 'Gwilym Jenkins' @ 72.249.127.135 \tabularnewline
\hline
\end{tabular}
%Source: https://freestatistics.org/blog/index.php?pk=96575&T=0

[TABLE]
[ROW][C]Summary of computational transaction[/C][/ROW]
[ROW][C]Raw Input[/C][C]view raw input (R code) [/C][/ROW]
[ROW][C]Raw Output[/C][C]view raw output of R engine [/C][/ROW]
[ROW][C]Computing time[/C][C]1 seconds[/C][/ROW]
[ROW][C]R Server[/C][C]'Gwilym Jenkins' @ 72.249.127.135[/C][/ROW]
[/TABLE]
Source: https://freestatistics.org/blog/index.php?pk=96575&T=0

Globally Unique Identifier (entire table): ba.freestatistics.org/blog/index.php?pk=96575&T=0

As an alternative you can also use a QR Code:  

The GUIDs for individual cells are displayed in the table below:

Summary of computational transaction
Raw Inputview raw input (R code)
Raw Outputview raw output of R engine
Computing time1 seconds
R Server'Gwilym Jenkins' @ 72.249.127.135


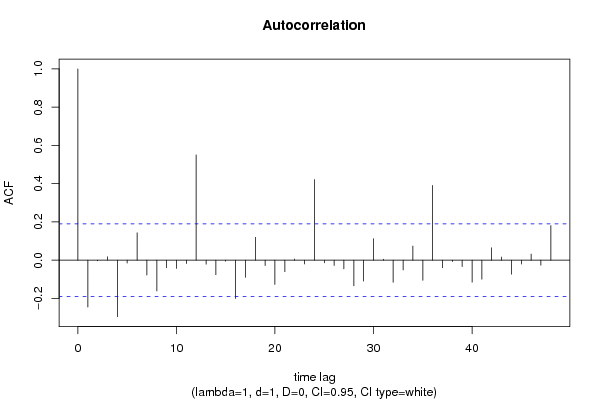
Autocorrelation Function
Time lag kACF(k)T-STATP-value
1-0.244582-2.530.006432
2-0.003056-0.03160.487419
30.0181560.18780.425692
4-0.294942-3.05090.001438
5-0.014981-0.1550.438569
60.1435271.48470.070288
7-0.077463-0.80130.212371
8-0.160463-1.65980.049937
9-0.039575-0.40940.341545
10-0.042795-0.44270.329446
11-0.017348-0.17940.428963
120.5507035.69650
13-0.020567-0.21270.415966
14-0.075731-0.78340.217571
15-0.004758-0.04920.48042
16-0.200287-2.07180.020345
17-0.089275-0.92350.178922
180.1200671.2420.10848
19-0.027822-0.28780.387032
20-0.126452-1.3080.096833
21-0.060206-0.62280.267379
220.0059750.06180.475415
23-0.019333-0.20.420939
240.4215434.36051.5e-05
25-0.013299-0.13760.445421
26-0.027254-0.28190.389276
27-0.044983-0.46530.321328
28-0.133981-1.38590.084328
29-0.108668-1.12410.13175
300.1129041.16790.122725
310.005290.05470.478232
32-0.115581-1.19560.117252
33-0.050872-0.52620.299912
340.0743020.76860.221915
35-0.104986-1.0860.139962
360.3912774.04744.9e-05
37-0.039855-0.41230.340486
38-0.006936-0.07170.471468
39-0.032869-0.340.367261
40-0.115052-1.19010.11832
41-0.098822-1.02220.154491
420.0650740.67310.251157
430.0166010.17170.43199
44-0.072873-0.75380.226312
45-0.020316-0.21020.416974
460.0320330.33140.370512
47-0.025945-0.26840.394464
480.1814441.87690.03163

\begin{tabular}{lllllllll}
\hline
Autocorrelation Function \tabularnewline
Time lag k & ACF(k) & T-STAT & P-value \tabularnewline
1 & -0.244582 & -2.53 & 0.006432 \tabularnewline
2 & -0.003056 & -0.0316 & 0.487419 \tabularnewline
3 & 0.018156 & 0.1878 & 0.425692 \tabularnewline
4 & -0.294942 & -3.0509 & 0.001438 \tabularnewline
5 & -0.014981 & -0.155 & 0.438569 \tabularnewline
6 & 0.143527 & 1.4847 & 0.070288 \tabularnewline
7 & -0.077463 & -0.8013 & 0.212371 \tabularnewline
8 & -0.160463 & -1.6598 & 0.049937 \tabularnewline
9 & -0.039575 & -0.4094 & 0.341545 \tabularnewline
10 & -0.042795 & -0.4427 & 0.329446 \tabularnewline
11 & -0.017348 & -0.1794 & 0.428963 \tabularnewline
12 & 0.550703 & 5.6965 & 0 \tabularnewline
13 & -0.020567 & -0.2127 & 0.415966 \tabularnewline
14 & -0.075731 & -0.7834 & 0.217571 \tabularnewline
15 & -0.004758 & -0.0492 & 0.48042 \tabularnewline
16 & -0.200287 & -2.0718 & 0.020345 \tabularnewline
17 & -0.089275 & -0.9235 & 0.178922 \tabularnewline
18 & 0.120067 & 1.242 & 0.10848 \tabularnewline
19 & -0.027822 & -0.2878 & 0.387032 \tabularnewline
20 & -0.126452 & -1.308 & 0.096833 \tabularnewline
21 & -0.060206 & -0.6228 & 0.267379 \tabularnewline
22 & 0.005975 & 0.0618 & 0.475415 \tabularnewline
23 & -0.019333 & -0.2 & 0.420939 \tabularnewline
24 & 0.421543 & 4.3605 & 1.5e-05 \tabularnewline
25 & -0.013299 & -0.1376 & 0.445421 \tabularnewline
26 & -0.027254 & -0.2819 & 0.389276 \tabularnewline
27 & -0.044983 & -0.4653 & 0.321328 \tabularnewline
28 & -0.133981 & -1.3859 & 0.084328 \tabularnewline
29 & -0.108668 & -1.1241 & 0.13175 \tabularnewline
30 & 0.112904 & 1.1679 & 0.122725 \tabularnewline
31 & 0.00529 & 0.0547 & 0.478232 \tabularnewline
32 & -0.115581 & -1.1956 & 0.117252 \tabularnewline
33 & -0.050872 & -0.5262 & 0.299912 \tabularnewline
34 & 0.074302 & 0.7686 & 0.221915 \tabularnewline
35 & -0.104986 & -1.086 & 0.139962 \tabularnewline
36 & 0.391277 & 4.0474 & 4.9e-05 \tabularnewline
37 & -0.039855 & -0.4123 & 0.340486 \tabularnewline
38 & -0.006936 & -0.0717 & 0.471468 \tabularnewline
39 & -0.032869 & -0.34 & 0.367261 \tabularnewline
40 & -0.115052 & -1.1901 & 0.11832 \tabularnewline
41 & -0.098822 & -1.0222 & 0.154491 \tabularnewline
42 & 0.065074 & 0.6731 & 0.251157 \tabularnewline
43 & 0.016601 & 0.1717 & 0.43199 \tabularnewline
44 & -0.072873 & -0.7538 & 0.226312 \tabularnewline
45 & -0.020316 & -0.2102 & 0.416974 \tabularnewline
46 & 0.032033 & 0.3314 & 0.370512 \tabularnewline
47 & -0.025945 & -0.2684 & 0.394464 \tabularnewline
48 & 0.181444 & 1.8769 & 0.03163 \tabularnewline
\hline
\end{tabular}
%Source: https://freestatistics.org/blog/index.php?pk=96575&T=1

[TABLE]
[ROW][C]Autocorrelation Function[/C][/ROW]
[ROW][C]Time lag k[/C][C]ACF(k)[/C][C]T-STAT[/C][C]P-value[/C][/ROW]
[ROW][C]1[/C][C]-0.244582[/C][C]-2.53[/C][C]0.006432[/C][/ROW]
[ROW][C]2[/C][C]-0.003056[/C][C]-0.0316[/C][C]0.487419[/C][/ROW]
[ROW][C]3[/C][C]0.018156[/C][C]0.1878[/C][C]0.425692[/C][/ROW]
[ROW][C]4[/C][C]-0.294942[/C][C]-3.0509[/C][C]0.001438[/C][/ROW]
[ROW][C]5[/C][C]-0.014981[/C][C]-0.155[/C][C]0.438569[/C][/ROW]
[ROW][C]6[/C][C]0.143527[/C][C]1.4847[/C][C]0.070288[/C][/ROW]
[ROW][C]7[/C][C]-0.077463[/C][C]-0.8013[/C][C]0.212371[/C][/ROW]
[ROW][C]8[/C][C]-0.160463[/C][C]-1.6598[/C][C]0.049937[/C][/ROW]
[ROW][C]9[/C][C]-0.039575[/C][C]-0.4094[/C][C]0.341545[/C][/ROW]
[ROW][C]10[/C][C]-0.042795[/C][C]-0.4427[/C][C]0.329446[/C][/ROW]
[ROW][C]11[/C][C]-0.017348[/C][C]-0.1794[/C][C]0.428963[/C][/ROW]
[ROW][C]12[/C][C]0.550703[/C][C]5.6965[/C][C]0[/C][/ROW]
[ROW][C]13[/C][C]-0.020567[/C][C]-0.2127[/C][C]0.415966[/C][/ROW]
[ROW][C]14[/C][C]-0.075731[/C][C]-0.7834[/C][C]0.217571[/C][/ROW]
[ROW][C]15[/C][C]-0.004758[/C][C]-0.0492[/C][C]0.48042[/C][/ROW]
[ROW][C]16[/C][C]-0.200287[/C][C]-2.0718[/C][C]0.020345[/C][/ROW]
[ROW][C]17[/C][C]-0.089275[/C][C]-0.9235[/C][C]0.178922[/C][/ROW]
[ROW][C]18[/C][C]0.120067[/C][C]1.242[/C][C]0.10848[/C][/ROW]
[ROW][C]19[/C][C]-0.027822[/C][C]-0.2878[/C][C]0.387032[/C][/ROW]
[ROW][C]20[/C][C]-0.126452[/C][C]-1.308[/C][C]0.096833[/C][/ROW]
[ROW][C]21[/C][C]-0.060206[/C][C]-0.6228[/C][C]0.267379[/C][/ROW]
[ROW][C]22[/C][C]0.005975[/C][C]0.0618[/C][C]0.475415[/C][/ROW]
[ROW][C]23[/C][C]-0.019333[/C][C]-0.2[/C][C]0.420939[/C][/ROW]
[ROW][C]24[/C][C]0.421543[/C][C]4.3605[/C][C]1.5e-05[/C][/ROW]
[ROW][C]25[/C][C]-0.013299[/C][C]-0.1376[/C][C]0.445421[/C][/ROW]
[ROW][C]26[/C][C]-0.027254[/C][C]-0.2819[/C][C]0.389276[/C][/ROW]
[ROW][C]27[/C][C]-0.044983[/C][C]-0.4653[/C][C]0.321328[/C][/ROW]
[ROW][C]28[/C][C]-0.133981[/C][C]-1.3859[/C][C]0.084328[/C][/ROW]
[ROW][C]29[/C][C]-0.108668[/C][C]-1.1241[/C][C]0.13175[/C][/ROW]
[ROW][C]30[/C][C]0.112904[/C][C]1.1679[/C][C]0.122725[/C][/ROW]
[ROW][C]31[/C][C]0.00529[/C][C]0.0547[/C][C]0.478232[/C][/ROW]
[ROW][C]32[/C][C]-0.115581[/C][C]-1.1956[/C][C]0.117252[/C][/ROW]
[ROW][C]33[/C][C]-0.050872[/C][C]-0.5262[/C][C]0.299912[/C][/ROW]
[ROW][C]34[/C][C]0.074302[/C][C]0.7686[/C][C]0.221915[/C][/ROW]
[ROW][C]35[/C][C]-0.104986[/C][C]-1.086[/C][C]0.139962[/C][/ROW]
[ROW][C]36[/C][C]0.391277[/C][C]4.0474[/C][C]4.9e-05[/C][/ROW]
[ROW][C]37[/C][C]-0.039855[/C][C]-0.4123[/C][C]0.340486[/C][/ROW]
[ROW][C]38[/C][C]-0.006936[/C][C]-0.0717[/C][C]0.471468[/C][/ROW]
[ROW][C]39[/C][C]-0.032869[/C][C]-0.34[/C][C]0.367261[/C][/ROW]
[ROW][C]40[/C][C]-0.115052[/C][C]-1.1901[/C][C]0.11832[/C][/ROW]
[ROW][C]41[/C][C]-0.098822[/C][C]-1.0222[/C][C]0.154491[/C][/ROW]
[ROW][C]42[/C][C]0.065074[/C][C]0.6731[/C][C]0.251157[/C][/ROW]
[ROW][C]43[/C][C]0.016601[/C][C]0.1717[/C][C]0.43199[/C][/ROW]
[ROW][C]44[/C][C]-0.072873[/C][C]-0.7538[/C][C]0.226312[/C][/ROW]
[ROW][C]45[/C][C]-0.020316[/C][C]-0.2102[/C][C]0.416974[/C][/ROW]
[ROW][C]46[/C][C]0.032033[/C][C]0.3314[/C][C]0.370512[/C][/ROW]
[ROW][C]47[/C][C]-0.025945[/C][C]-0.2684[/C][C]0.394464[/C][/ROW]
[ROW][C]48[/C][C]0.181444[/C][C]1.8769[/C][C]0.03163[/C][/ROW]
[/TABLE]
Source: https://freestatistics.org/blog/index.php?pk=96575&T=1

Globally Unique Identifier (entire table): ba.freestatistics.org/blog/index.php?pk=96575&T=1

As an alternative you can also use a QR Code:  

The GUIDs for individual cells are displayed in the table below:

Autocorrelation Function
Time lag kACF(k)T-STATP-value
1-0.244582-2.530.006432
2-0.003056-0.03160.487419
30.0181560.18780.425692
4-0.294942-3.05090.001438
5-0.014981-0.1550.438569
60.1435271.48470.070288
7-0.077463-0.80130.212371
8-0.160463-1.65980.049937
9-0.039575-0.40940.341545
10-0.042795-0.44270.329446
11-0.017348-0.17940.428963
120.5507035.69650
13-0.020567-0.21270.415966
14-0.075731-0.78340.217571
15-0.004758-0.04920.48042
16-0.200287-2.07180.020345
17-0.089275-0.92350.178922
180.1200671.2420.10848
19-0.027822-0.28780.387032
20-0.126452-1.3080.096833
21-0.060206-0.62280.267379
220.0059750.06180.475415
23-0.019333-0.20.420939
240.4215434.36051.5e-05
25-0.013299-0.13760.445421
26-0.027254-0.28190.389276
27-0.044983-0.46530.321328
28-0.133981-1.38590.084328
29-0.108668-1.12410.13175
300.1129041.16790.122725
310.005290.05470.478232
32-0.115581-1.19560.117252
33-0.050872-0.52620.299912
340.0743020.76860.221915
35-0.104986-1.0860.139962
360.3912774.04744.9e-05
37-0.039855-0.41230.340486
38-0.006936-0.07170.471468
39-0.032869-0.340.367261
40-0.115052-1.19010.11832
41-0.098822-1.02220.154491
420.0650740.67310.251157
430.0166010.17170.43199
44-0.072873-0.75380.226312
45-0.020316-0.21020.416974
460.0320330.33140.370512
47-0.025945-0.26840.394464
480.1814441.87690.03163


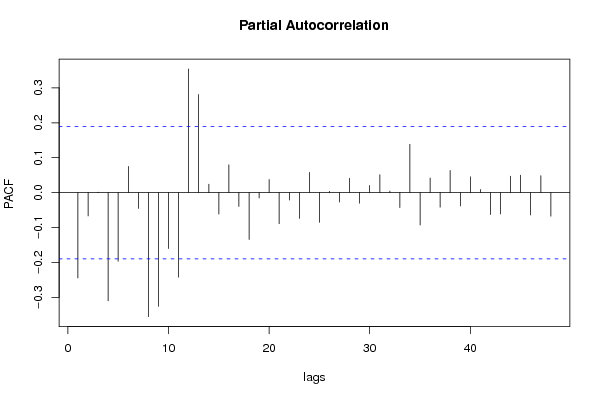
Partial Autocorrelation Function
Time lag kPACF(k)T-STATP-value
1-0.244582-2.530.006432
2-0.066878-0.69180.245285
30.001070.01110.495595
4-0.309996-3.20660.000886
5-0.19657-2.03330.022247
60.0749150.77490.220047
7-0.045515-0.47080.319365
8-0.355281-3.67510.000187
9-0.325664-3.36870.000525
10-0.160412-1.65930.049991
11-0.242397-2.50740.006833
120.354173.66360.000194
130.280652.90310.002244
140.0241350.24970.401667
15-0.06141-0.63520.263316
160.0797340.82480.205668
17-0.039538-0.4090.341685
18-0.134173-1.38790.084026
19-0.015144-0.15670.437906
200.03740.38690.34981
21-0.088944-0.920.179808
22-0.02122-0.21950.413337
23-0.07383-0.76370.223361
240.0577830.59770.275647
25-0.085216-0.88150.190016
260.0037510.03880.484562
27-0.027162-0.2810.38964
280.0414520.42880.334472
29-0.030325-0.31370.377188
300.02040.2110.416635
310.0512980.53060.298386
320.0044380.04590.481737
33-0.042765-0.44240.329558
340.1382831.43040.077757
35-0.092834-0.96030.169538
360.0418280.43270.333061
37-0.041772-0.43210.333273
380.0635970.65790.256022
39-0.038251-0.39570.34657
400.045210.46770.320491
410.0092250.09540.462079
42-0.062949-0.65120.258172
43-0.061126-0.63230.264273
440.0471640.48790.313322
450.0499450.51660.303237
46-0.06385-0.66050.255186
470.0484370.5010.308687
48-0.067646-0.69970.242806

\begin{tabular}{lllllllll}
\hline
Partial Autocorrelation Function \tabularnewline
Time lag k & PACF(k) & T-STAT & P-value \tabularnewline
1 & -0.244582 & -2.53 & 0.006432 \tabularnewline
2 & -0.066878 & -0.6918 & 0.245285 \tabularnewline
3 & 0.00107 & 0.0111 & 0.495595 \tabularnewline
4 & -0.309996 & -3.2066 & 0.000886 \tabularnewline
5 & -0.19657 & -2.0333 & 0.022247 \tabularnewline
6 & 0.074915 & 0.7749 & 0.220047 \tabularnewline
7 & -0.045515 & -0.4708 & 0.319365 \tabularnewline
8 & -0.355281 & -3.6751 & 0.000187 \tabularnewline
9 & -0.325664 & -3.3687 & 0.000525 \tabularnewline
10 & -0.160412 & -1.6593 & 0.049991 \tabularnewline
11 & -0.242397 & -2.5074 & 0.006833 \tabularnewline
12 & 0.35417 & 3.6636 & 0.000194 \tabularnewline
13 & 0.28065 & 2.9031 & 0.002244 \tabularnewline
14 & 0.024135 & 0.2497 & 0.401667 \tabularnewline
15 & -0.06141 & -0.6352 & 0.263316 \tabularnewline
16 & 0.079734 & 0.8248 & 0.205668 \tabularnewline
17 & -0.039538 & -0.409 & 0.341685 \tabularnewline
18 & -0.134173 & -1.3879 & 0.084026 \tabularnewline
19 & -0.015144 & -0.1567 & 0.437906 \tabularnewline
20 & 0.0374 & 0.3869 & 0.34981 \tabularnewline
21 & -0.088944 & -0.92 & 0.179808 \tabularnewline
22 & -0.02122 & -0.2195 & 0.413337 \tabularnewline
23 & -0.07383 & -0.7637 & 0.223361 \tabularnewline
24 & 0.057783 & 0.5977 & 0.275647 \tabularnewline
25 & -0.085216 & -0.8815 & 0.190016 \tabularnewline
26 & 0.003751 & 0.0388 & 0.484562 \tabularnewline
27 & -0.027162 & -0.281 & 0.38964 \tabularnewline
28 & 0.041452 & 0.4288 & 0.334472 \tabularnewline
29 & -0.030325 & -0.3137 & 0.377188 \tabularnewline
30 & 0.0204 & 0.211 & 0.416635 \tabularnewline
31 & 0.051298 & 0.5306 & 0.298386 \tabularnewline
32 & 0.004438 & 0.0459 & 0.481737 \tabularnewline
33 & -0.042765 & -0.4424 & 0.329558 \tabularnewline
34 & 0.138283 & 1.4304 & 0.077757 \tabularnewline
35 & -0.092834 & -0.9603 & 0.169538 \tabularnewline
36 & 0.041828 & 0.4327 & 0.333061 \tabularnewline
37 & -0.041772 & -0.4321 & 0.333273 \tabularnewline
38 & 0.063597 & 0.6579 & 0.256022 \tabularnewline
39 & -0.038251 & -0.3957 & 0.34657 \tabularnewline
40 & 0.04521 & 0.4677 & 0.320491 \tabularnewline
41 & 0.009225 & 0.0954 & 0.462079 \tabularnewline
42 & -0.062949 & -0.6512 & 0.258172 \tabularnewline
43 & -0.061126 & -0.6323 & 0.264273 \tabularnewline
44 & 0.047164 & 0.4879 & 0.313322 \tabularnewline
45 & 0.049945 & 0.5166 & 0.303237 \tabularnewline
46 & -0.06385 & -0.6605 & 0.255186 \tabularnewline
47 & 0.048437 & 0.501 & 0.308687 \tabularnewline
48 & -0.067646 & -0.6997 & 0.242806 \tabularnewline
\hline
\end{tabular}
%Source: https://freestatistics.org/blog/index.php?pk=96575&T=2

[TABLE]
[ROW][C]Partial Autocorrelation Function[/C][/ROW]
[ROW][C]Time lag k[/C][C]PACF(k)[/C][C]T-STAT[/C][C]P-value[/C][/ROW]
[ROW][C]1[/C][C]-0.244582[/C][C]-2.53[/C][C]0.006432[/C][/ROW]
[ROW][C]2[/C][C]-0.066878[/C][C]-0.6918[/C][C]0.245285[/C][/ROW]
[ROW][C]3[/C][C]0.00107[/C][C]0.0111[/C][C]0.495595[/C][/ROW]
[ROW][C]4[/C][C]-0.309996[/C][C]-3.2066[/C][C]0.000886[/C][/ROW]
[ROW][C]5[/C][C]-0.19657[/C][C]-2.0333[/C][C]0.022247[/C][/ROW]
[ROW][C]6[/C][C]0.074915[/C][C]0.7749[/C][C]0.220047[/C][/ROW]
[ROW][C]7[/C][C]-0.045515[/C][C]-0.4708[/C][C]0.319365[/C][/ROW]
[ROW][C]8[/C][C]-0.355281[/C][C]-3.6751[/C][C]0.000187[/C][/ROW]
[ROW][C]9[/C][C]-0.325664[/C][C]-3.3687[/C][C]0.000525[/C][/ROW]
[ROW][C]10[/C][C]-0.160412[/C][C]-1.6593[/C][C]0.049991[/C][/ROW]
[ROW][C]11[/C][C]-0.242397[/C][C]-2.5074[/C][C]0.006833[/C][/ROW]
[ROW][C]12[/C][C]0.35417[/C][C]3.6636[/C][C]0.000194[/C][/ROW]
[ROW][C]13[/C][C]0.28065[/C][C]2.9031[/C][C]0.002244[/C][/ROW]
[ROW][C]14[/C][C]0.024135[/C][C]0.2497[/C][C]0.401667[/C][/ROW]
[ROW][C]15[/C][C]-0.06141[/C][C]-0.6352[/C][C]0.263316[/C][/ROW]
[ROW][C]16[/C][C]0.079734[/C][C]0.8248[/C][C]0.205668[/C][/ROW]
[ROW][C]17[/C][C]-0.039538[/C][C]-0.409[/C][C]0.341685[/C][/ROW]
[ROW][C]18[/C][C]-0.134173[/C][C]-1.3879[/C][C]0.084026[/C][/ROW]
[ROW][C]19[/C][C]-0.015144[/C][C]-0.1567[/C][C]0.437906[/C][/ROW]
[ROW][C]20[/C][C]0.0374[/C][C]0.3869[/C][C]0.34981[/C][/ROW]
[ROW][C]21[/C][C]-0.088944[/C][C]-0.92[/C][C]0.179808[/C][/ROW]
[ROW][C]22[/C][C]-0.02122[/C][C]-0.2195[/C][C]0.413337[/C][/ROW]
[ROW][C]23[/C][C]-0.07383[/C][C]-0.7637[/C][C]0.223361[/C][/ROW]
[ROW][C]24[/C][C]0.057783[/C][C]0.5977[/C][C]0.275647[/C][/ROW]
[ROW][C]25[/C][C]-0.085216[/C][C]-0.8815[/C][C]0.190016[/C][/ROW]
[ROW][C]26[/C][C]0.003751[/C][C]0.0388[/C][C]0.484562[/C][/ROW]
[ROW][C]27[/C][C]-0.027162[/C][C]-0.281[/C][C]0.38964[/C][/ROW]
[ROW][C]28[/C][C]0.041452[/C][C]0.4288[/C][C]0.334472[/C][/ROW]
[ROW][C]29[/C][C]-0.030325[/C][C]-0.3137[/C][C]0.377188[/C][/ROW]
[ROW][C]30[/C][C]0.0204[/C][C]0.211[/C][C]0.416635[/C][/ROW]
[ROW][C]31[/C][C]0.051298[/C][C]0.5306[/C][C]0.298386[/C][/ROW]
[ROW][C]32[/C][C]0.004438[/C][C]0.0459[/C][C]0.481737[/C][/ROW]
[ROW][C]33[/C][C]-0.042765[/C][C]-0.4424[/C][C]0.329558[/C][/ROW]
[ROW][C]34[/C][C]0.138283[/C][C]1.4304[/C][C]0.077757[/C][/ROW]
[ROW][C]35[/C][C]-0.092834[/C][C]-0.9603[/C][C]0.169538[/C][/ROW]
[ROW][C]36[/C][C]0.041828[/C][C]0.4327[/C][C]0.333061[/C][/ROW]
[ROW][C]37[/C][C]-0.041772[/C][C]-0.4321[/C][C]0.333273[/C][/ROW]
[ROW][C]38[/C][C]0.063597[/C][C]0.6579[/C][C]0.256022[/C][/ROW]
[ROW][C]39[/C][C]-0.038251[/C][C]-0.3957[/C][C]0.34657[/C][/ROW]
[ROW][C]40[/C][C]0.04521[/C][C]0.4677[/C][C]0.320491[/C][/ROW]
[ROW][C]41[/C][C]0.009225[/C][C]0.0954[/C][C]0.462079[/C][/ROW]
[ROW][C]42[/C][C]-0.062949[/C][C]-0.6512[/C][C]0.258172[/C][/ROW]
[ROW][C]43[/C][C]-0.061126[/C][C]-0.6323[/C][C]0.264273[/C][/ROW]
[ROW][C]44[/C][C]0.047164[/C][C]0.4879[/C][C]0.313322[/C][/ROW]
[ROW][C]45[/C][C]0.049945[/C][C]0.5166[/C][C]0.303237[/C][/ROW]
[ROW][C]46[/C][C]-0.06385[/C][C]-0.6605[/C][C]0.255186[/C][/ROW]
[ROW][C]47[/C][C]0.048437[/C][C]0.501[/C][C]0.308687[/C][/ROW]
[ROW][C]48[/C][C]-0.067646[/C][C]-0.6997[/C][C]0.242806[/C][/ROW]
[/TABLE]
Source: https://freestatistics.org/blog/index.php?pk=96575&T=2

Globally Unique Identifier (entire table): ba.freestatistics.org/blog/index.php?pk=96575&T=2

As an alternative you can also use a QR Code:  

The GUIDs for individual cells are displayed in the table below:

Partial Autocorrelation Function
Time lag kPACF(k)T-STATP-value
1-0.244582-2.530.006432
2-0.066878-0.69180.245285
30.001070.01110.495595
4-0.309996-3.20660.000886
5-0.19657-2.03330.022247
60.0749150.77490.220047
7-0.045515-0.47080.319365
8-0.355281-3.67510.000187
9-0.325664-3.36870.000525
10-0.160412-1.65930.049991
11-0.242397-2.50740.006833
120.354173.66360.000194
130.280652.90310.002244
140.0241350.24970.401667
15-0.06141-0.63520.263316
160.0797340.82480.205668
17-0.039538-0.4090.341685
18-0.134173-1.38790.084026
19-0.015144-0.15670.437906
200.03740.38690.34981
21-0.088944-0.920.179808
22-0.02122-0.21950.413337
23-0.07383-0.76370.223361
240.0577830.59770.275647
25-0.085216-0.88150.190016
260.0037510.03880.484562
27-0.027162-0.2810.38964
280.0414520.42880.334472
29-0.030325-0.31370.377188
300.02040.2110.416635
310.0512980.53060.298386
320.0044380.04590.481737
33-0.042765-0.44240.329558
340.1382831.43040.077757
35-0.092834-0.96030.169538
360.0418280.43270.333061
37-0.041772-0.43210.333273
380.0635970.65790.256022
39-0.038251-0.39570.34657
400.045210.46770.320491
410.0092250.09540.462079
42-0.062949-0.65120.258172
43-0.061126-0.63230.264273
440.0471640.48790.313322
450.0499450.51660.303237
46-0.06385-0.66050.255186
470.0484370.5010.308687
48-0.067646-0.69970.242806


Parameters (Session):
par1 = 48 ; par2 = 1 ; par3 = 1 ; par4 = 0 ; par5 = 12 ; par6 = White Noise ; par7 = 0.95 ;
Parameters (R input):
par1 = 48 ; par2 = 1 ; par3 = 1 ; par4 = 0 ; par5 = 12 ; par6 = White Noise ; par7 = 0.95 ;
R code (references can be found in the software module):
if (par1 == 'Default') {
par1 = 10*log10(length(x))
} else {
par1 <- as.numeric(par1)
}
par2 <- as.numeric(par2)
par3 <- as.numeric(par3)
par4 <- as.numeric(par4)
par5 <- as.numeric(par5)
if (par6 == 'White Noise') par6 <- 'white' else par6 <- 'ma'
par7 <- as.numeric(par7)
if (par2 == 0) {
x <- log(x)
} else {
x <- (x ^ par2 - 1) / par2
}
if (par3 > 0) x <- diff(x,lag=1,difference=par3)
if (par4 > 0) x <- diff(x,lag=par5,difference=par4)
bitmap(file='pic1.png')
racf <- acf(x, par1, main='Autocorrelation', xlab='time lag', ylab='ACF', ci.type=par6, ci=par7, sub=paste('(lambda=',par2,', d=',par3,', D=',par4,', CI=', par7, ', CI type=',par6,')',sep=''))
dev.off()
bitmap(file='pic2.png')
rpacf <- pacf(x,par1,main='Partial Autocorrelation',xlab='lags',ylab='PACF')
dev.off()
(myacf <- c(racf$acf))
(mypacf <- c(rpacf$acf))
lengthx <- length(x)
sqrtn <- sqrt(lengthx)
load(file='createtable')
a<-table.start()
a<-table.row.start(a)
a<-table.element(a,'Autocorrelation Function',4,TRUE)
a<-table.row.end(a)
a<-table.row.start(a)
a<-table.element(a,'Time lag k',header=TRUE)
a<-table.element(a,hyperlink('basics.htm','ACF(k)','click here for more information about the Autocorrelation Function'),header=TRUE)
a<-table.element(a,'T-STAT',header=TRUE)
a<-table.element(a,'P-value',header=TRUE)
a<-table.row.end(a)
for (i in 2:(par1+1)) {
a<-table.row.start(a)
a<-table.element(a,i-1,header=TRUE)
a<-table.element(a,round(myacf[i],6))
mytstat <- myacf[i]*sqrtn
a<-table.element(a,round(mytstat,4))
a<-table.element(a,round(1-pt(abs(mytstat),lengthx),6))
a<-table.row.end(a)
}
a<-table.end(a)
table.save(a,file='mytable.tab')
a<-table.start()
a<-table.row.start(a)
a<-table.element(a,'Partial Autocorrelation Function',4,TRUE)
a<-table.row.end(a)
a<-table.row.start(a)
a<-table.element(a,'Time lag k',header=TRUE)
a<-table.element(a,hyperlink('basics.htm','PACF(k)','click here for more information about the Partial Autocorrelation Function'),header=TRUE)
a<-table.element(a,'T-STAT',header=TRUE)
a<-table.element(a,'P-value',header=TRUE)
a<-table.row.end(a)
for (i in 1:par1) {
a<-table.row.start(a)
a<-table.element(a,i,header=TRUE)
a<-table.element(a,round(mypacf[i],6))
mytstat <- mypacf[i]*sqrtn
a<-table.element(a,round(mytstat,4))
a<-table.element(a,round(1-pt(abs(mytstat),lengthx),6))
a<-table.row.end(a)
}
a<-table.end(a)
table.save(a,file='mytable1.tab')