Free Statistics

of Irreproducible Research!

Author's title

Author*Unverified author*
R Software Modulerwasp_autocorrelation.wasp
Title produced by software(Partial) Autocorrelation Function
Date of computationWed, 17 Nov 2010 09:54:20 +0000
Cite this page as followsStatistical Computations at FreeStatistics.org, Office for Research Development and Education, URL https://freestatistics.org/blog/index.php?v=date/2010/Nov/17/t1289987570qos2vwnijpsh15m.htm/, Retrieved Sat, 20 Apr 2024 15:05:42 +0000
Statistical Computations at FreeStatistics.org, Office for Research Development and Education, URL https://freestatistics.org/blog/index.php?pk=96573, Retrieved Sat, 20 Apr 2024 15:05:42 +0000
QR Codes:

Original text written by user:
IsPrivate?No (this computation is public)
User-defined keywordsKDGP2W12
Estimated Impact125
Family? (F = Feedback message, R = changed R code, M = changed R Module, P = changed Parameters, D = changed Data)
-       [(Partial) Autocorrelation Function] [] [2010-11-17 09:54:20] [49c40d716750d950b45a50638ed38982] [Current]
Feedback Forum

Post a new message
Dataseries X:
1552
2081
1500
1437
1470
1849
1387
1592
1590
1798
1935
1887
2027
2080
1556
1682
1785
1869
1781
2082
2571
1862
1938
1505
1767
1607
1578
1495
1615
1700
1337
1531
1623
1543
1640
1524
1429
1827
1603
1351
1267
1742
1384
1392
1649
1665
1526
1717
1391
1790
1472
1350
1704
1391
1190
1351
1160
1236
1444
1257
1193
1701
1428
1611
1431
1472
1240
1276
1467
1603
2014
2463
2510


Summary of computational transaction
Raw Inputview raw input (R code)
Raw Outputview raw output of R engine
Computing time1 seconds
R Server'Gwilym Jenkins' @ 72.249.127.135

\begin{tabular}{lllllllll}
\hline
Summary of computational transaction \tabularnewline
Raw Input & view raw input (R code)  \tabularnewline
Raw Output & view raw output of R engine  \tabularnewline
Computing time & 1 seconds \tabularnewline
R Server & 'Gwilym Jenkins' @ 72.249.127.135 \tabularnewline
\hline
\end{tabular}
%Source: https://freestatistics.org/blog/index.php?pk=96573&T=0

[TABLE]
[ROW][C]Summary of computational transaction[/C][/ROW]
[ROW][C]Raw Input[/C][C]view raw input (R code) [/C][/ROW]
[ROW][C]Raw Output[/C][C]view raw output of R engine [/C][/ROW]
[ROW][C]Computing time[/C][C]1 seconds[/C][/ROW]
[ROW][C]R Server[/C][C]'Gwilym Jenkins' @ 72.249.127.135[/C][/ROW]
[/TABLE]
Source: https://freestatistics.org/blog/index.php?pk=96573&T=0

Globally Unique Identifier (entire table): ba.freestatistics.org/blog/index.php?pk=96573&T=0

As an alternative you can also use a QR Code:  

The GUIDs for individual cells are displayed in the table below:

Summary of computational transaction
Raw Inputview raw input (R code)
Raw Outputview raw output of R engine
Computing time1 seconds
R Server'Gwilym Jenkins' @ 72.249.127.135


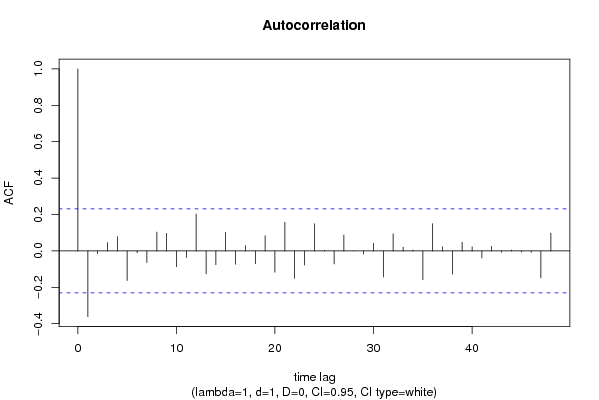
Autocorrelation Function
Time lag kACF(k)T-STATP-value
1-0.361332-3.0660.001527
2-0.014963-0.1270.44966
30.0466010.39540.346849
40.0789420.66980.252549
5-0.162768-1.38110.085755
6-0.010793-0.09160.463642
7-0.063215-0.53640.29667
80.10390.88160.190458
90.0963710.81770.208104
10-0.087023-0.73840.231332
11-0.036491-0.30960.378864
120.2022181.71590.045242
13-0.125858-1.06790.144557
14-0.075623-0.64170.261558
150.1020340.86580.194741
16-0.072821-0.61790.269294
170.0293330.24890.402073
18-0.070107-0.59490.276894
190.0833260.7070.24091
20-0.11679-0.9910.162503
210.1572391.33420.093168
22-0.150883-1.28030.102277
23-0.077764-0.65980.255728
240.1492551.26650.104714
250.0029510.0250.490046
26-0.071704-0.60840.272408
270.0868090.73660.23188
28-0.000218-0.00180.499265
29-0.017392-0.14760.441546
300.0420750.3570.361062
31-0.143432-1.21710.113778
320.0939290.7970.214031
330.020660.17530.430665
340.0047440.04030.484001
35-0.158976-1.3490.090789
360.1495861.26930.104214
370.0222270.18860.425467
38-0.127414-1.08110.14162
390.0474150.40230.344318
400.0224130.19020.424851
41-0.038534-0.3270.372318
420.0254810.21620.414716
43-0.006866-0.05830.476851
440.0048920.04150.483501
45-0.005725-0.04860.480695
46-0.007787-0.06610.47375
47-0.14823-1.25780.106268
480.0976730.82880.204984

\begin{tabular}{lllllllll}
\hline
Autocorrelation Function \tabularnewline
Time lag k & ACF(k) & T-STAT & P-value \tabularnewline
1 & -0.361332 & -3.066 & 0.001527 \tabularnewline
2 & -0.014963 & -0.127 & 0.44966 \tabularnewline
3 & 0.046601 & 0.3954 & 0.346849 \tabularnewline
4 & 0.078942 & 0.6698 & 0.252549 \tabularnewline
5 & -0.162768 & -1.3811 & 0.085755 \tabularnewline
6 & -0.010793 & -0.0916 & 0.463642 \tabularnewline
7 & -0.063215 & -0.5364 & 0.29667 \tabularnewline
8 & 0.1039 & 0.8816 & 0.190458 \tabularnewline
9 & 0.096371 & 0.8177 & 0.208104 \tabularnewline
10 & -0.087023 & -0.7384 & 0.231332 \tabularnewline
11 & -0.036491 & -0.3096 & 0.378864 \tabularnewline
12 & 0.202218 & 1.7159 & 0.045242 \tabularnewline
13 & -0.125858 & -1.0679 & 0.144557 \tabularnewline
14 & -0.075623 & -0.6417 & 0.261558 \tabularnewline
15 & 0.102034 & 0.8658 & 0.194741 \tabularnewline
16 & -0.072821 & -0.6179 & 0.269294 \tabularnewline
17 & 0.029333 & 0.2489 & 0.402073 \tabularnewline
18 & -0.070107 & -0.5949 & 0.276894 \tabularnewline
19 & 0.083326 & 0.707 & 0.24091 \tabularnewline
20 & -0.11679 & -0.991 & 0.162503 \tabularnewline
21 & 0.157239 & 1.3342 & 0.093168 \tabularnewline
22 & -0.150883 & -1.2803 & 0.102277 \tabularnewline
23 & -0.077764 & -0.6598 & 0.255728 \tabularnewline
24 & 0.149255 & 1.2665 & 0.104714 \tabularnewline
25 & 0.002951 & 0.025 & 0.490046 \tabularnewline
26 & -0.071704 & -0.6084 & 0.272408 \tabularnewline
27 & 0.086809 & 0.7366 & 0.23188 \tabularnewline
28 & -0.000218 & -0.0018 & 0.499265 \tabularnewline
29 & -0.017392 & -0.1476 & 0.441546 \tabularnewline
30 & 0.042075 & 0.357 & 0.361062 \tabularnewline
31 & -0.143432 & -1.2171 & 0.113778 \tabularnewline
32 & 0.093929 & 0.797 & 0.214031 \tabularnewline
33 & 0.02066 & 0.1753 & 0.430665 \tabularnewline
34 & 0.004744 & 0.0403 & 0.484001 \tabularnewline
35 & -0.158976 & -1.349 & 0.090789 \tabularnewline
36 & 0.149586 & 1.2693 & 0.104214 \tabularnewline
37 & 0.022227 & 0.1886 & 0.425467 \tabularnewline
38 & -0.127414 & -1.0811 & 0.14162 \tabularnewline
39 & 0.047415 & 0.4023 & 0.344318 \tabularnewline
40 & 0.022413 & 0.1902 & 0.424851 \tabularnewline
41 & -0.038534 & -0.327 & 0.372318 \tabularnewline
42 & 0.025481 & 0.2162 & 0.414716 \tabularnewline
43 & -0.006866 & -0.0583 & 0.476851 \tabularnewline
44 & 0.004892 & 0.0415 & 0.483501 \tabularnewline
45 & -0.005725 & -0.0486 & 0.480695 \tabularnewline
46 & -0.007787 & -0.0661 & 0.47375 \tabularnewline
47 & -0.14823 & -1.2578 & 0.106268 \tabularnewline
48 & 0.097673 & 0.8288 & 0.204984 \tabularnewline
\hline
\end{tabular}
%Source: https://freestatistics.org/blog/index.php?pk=96573&T=1

[TABLE]
[ROW][C]Autocorrelation Function[/C][/ROW]
[ROW][C]Time lag k[/C][C]ACF(k)[/C][C]T-STAT[/C][C]P-value[/C][/ROW]
[ROW][C]1[/C][C]-0.361332[/C][C]-3.066[/C][C]0.001527[/C][/ROW]
[ROW][C]2[/C][C]-0.014963[/C][C]-0.127[/C][C]0.44966[/C][/ROW]
[ROW][C]3[/C][C]0.046601[/C][C]0.3954[/C][C]0.346849[/C][/ROW]
[ROW][C]4[/C][C]0.078942[/C][C]0.6698[/C][C]0.252549[/C][/ROW]
[ROW][C]5[/C][C]-0.162768[/C][C]-1.3811[/C][C]0.085755[/C][/ROW]
[ROW][C]6[/C][C]-0.010793[/C][C]-0.0916[/C][C]0.463642[/C][/ROW]
[ROW][C]7[/C][C]-0.063215[/C][C]-0.5364[/C][C]0.29667[/C][/ROW]
[ROW][C]8[/C][C]0.1039[/C][C]0.8816[/C][C]0.190458[/C][/ROW]
[ROW][C]9[/C][C]0.096371[/C][C]0.8177[/C][C]0.208104[/C][/ROW]
[ROW][C]10[/C][C]-0.087023[/C][C]-0.7384[/C][C]0.231332[/C][/ROW]
[ROW][C]11[/C][C]-0.036491[/C][C]-0.3096[/C][C]0.378864[/C][/ROW]
[ROW][C]12[/C][C]0.202218[/C][C]1.7159[/C][C]0.045242[/C][/ROW]
[ROW][C]13[/C][C]-0.125858[/C][C]-1.0679[/C][C]0.144557[/C][/ROW]
[ROW][C]14[/C][C]-0.075623[/C][C]-0.6417[/C][C]0.261558[/C][/ROW]
[ROW][C]15[/C][C]0.102034[/C][C]0.8658[/C][C]0.194741[/C][/ROW]
[ROW][C]16[/C][C]-0.072821[/C][C]-0.6179[/C][C]0.269294[/C][/ROW]
[ROW][C]17[/C][C]0.029333[/C][C]0.2489[/C][C]0.402073[/C][/ROW]
[ROW][C]18[/C][C]-0.070107[/C][C]-0.5949[/C][C]0.276894[/C][/ROW]
[ROW][C]19[/C][C]0.083326[/C][C]0.707[/C][C]0.24091[/C][/ROW]
[ROW][C]20[/C][C]-0.11679[/C][C]-0.991[/C][C]0.162503[/C][/ROW]
[ROW][C]21[/C][C]0.157239[/C][C]1.3342[/C][C]0.093168[/C][/ROW]
[ROW][C]22[/C][C]-0.150883[/C][C]-1.2803[/C][C]0.102277[/C][/ROW]
[ROW][C]23[/C][C]-0.077764[/C][C]-0.6598[/C][C]0.255728[/C][/ROW]
[ROW][C]24[/C][C]0.149255[/C][C]1.2665[/C][C]0.104714[/C][/ROW]
[ROW][C]25[/C][C]0.002951[/C][C]0.025[/C][C]0.490046[/C][/ROW]
[ROW][C]26[/C][C]-0.071704[/C][C]-0.6084[/C][C]0.272408[/C][/ROW]
[ROW][C]27[/C][C]0.086809[/C][C]0.7366[/C][C]0.23188[/C][/ROW]
[ROW][C]28[/C][C]-0.000218[/C][C]-0.0018[/C][C]0.499265[/C][/ROW]
[ROW][C]29[/C][C]-0.017392[/C][C]-0.1476[/C][C]0.441546[/C][/ROW]
[ROW][C]30[/C][C]0.042075[/C][C]0.357[/C][C]0.361062[/C][/ROW]
[ROW][C]31[/C][C]-0.143432[/C][C]-1.2171[/C][C]0.113778[/C][/ROW]
[ROW][C]32[/C][C]0.093929[/C][C]0.797[/C][C]0.214031[/C][/ROW]
[ROW][C]33[/C][C]0.02066[/C][C]0.1753[/C][C]0.430665[/C][/ROW]
[ROW][C]34[/C][C]0.004744[/C][C]0.0403[/C][C]0.484001[/C][/ROW]
[ROW][C]35[/C][C]-0.158976[/C][C]-1.349[/C][C]0.090789[/C][/ROW]
[ROW][C]36[/C][C]0.149586[/C][C]1.2693[/C][C]0.104214[/C][/ROW]
[ROW][C]37[/C][C]0.022227[/C][C]0.1886[/C][C]0.425467[/C][/ROW]
[ROW][C]38[/C][C]-0.127414[/C][C]-1.0811[/C][C]0.14162[/C][/ROW]
[ROW][C]39[/C][C]0.047415[/C][C]0.4023[/C][C]0.344318[/C][/ROW]
[ROW][C]40[/C][C]0.022413[/C][C]0.1902[/C][C]0.424851[/C][/ROW]
[ROW][C]41[/C][C]-0.038534[/C][C]-0.327[/C][C]0.372318[/C][/ROW]
[ROW][C]42[/C][C]0.025481[/C][C]0.2162[/C][C]0.414716[/C][/ROW]
[ROW][C]43[/C][C]-0.006866[/C][C]-0.0583[/C][C]0.476851[/C][/ROW]
[ROW][C]44[/C][C]0.004892[/C][C]0.0415[/C][C]0.483501[/C][/ROW]
[ROW][C]45[/C][C]-0.005725[/C][C]-0.0486[/C][C]0.480695[/C][/ROW]
[ROW][C]46[/C][C]-0.007787[/C][C]-0.0661[/C][C]0.47375[/C][/ROW]
[ROW][C]47[/C][C]-0.14823[/C][C]-1.2578[/C][C]0.106268[/C][/ROW]
[ROW][C]48[/C][C]0.097673[/C][C]0.8288[/C][C]0.204984[/C][/ROW]
[/TABLE]
Source: https://freestatistics.org/blog/index.php?pk=96573&T=1

Globally Unique Identifier (entire table): ba.freestatistics.org/blog/index.php?pk=96573&T=1

As an alternative you can also use a QR Code:  

The GUIDs for individual cells are displayed in the table below:

Autocorrelation Function
Time lag kACF(k)T-STATP-value
1-0.361332-3.0660.001527
2-0.014963-0.1270.44966
30.0466010.39540.346849
40.0789420.66980.252549
5-0.162768-1.38110.085755
6-0.010793-0.09160.463642
7-0.063215-0.53640.29667
80.10390.88160.190458
90.0963710.81770.208104
10-0.087023-0.73840.231332
11-0.036491-0.30960.378864
120.2022181.71590.045242
13-0.125858-1.06790.144557
14-0.075623-0.64170.261558
150.1020340.86580.194741
16-0.072821-0.61790.269294
170.0293330.24890.402073
18-0.070107-0.59490.276894
190.0833260.7070.24091
20-0.11679-0.9910.162503
210.1572391.33420.093168
22-0.150883-1.28030.102277
23-0.077764-0.65980.255728
240.1492551.26650.104714
250.0029510.0250.490046
26-0.071704-0.60840.272408
270.0868090.73660.23188
28-0.000218-0.00180.499265
29-0.017392-0.14760.441546
300.0420750.3570.361062
31-0.143432-1.21710.113778
320.0939290.7970.214031
330.020660.17530.430665
340.0047440.04030.484001
35-0.158976-1.3490.090789
360.1495861.26930.104214
370.0222270.18860.425467
38-0.127414-1.08110.14162
390.0474150.40230.344318
400.0224130.19020.424851
41-0.038534-0.3270.372318
420.0254810.21620.414716
43-0.006866-0.05830.476851
440.0048920.04150.483501
45-0.005725-0.04860.480695
46-0.007787-0.06610.47375
47-0.14823-1.25780.106268
480.0976730.82880.204984


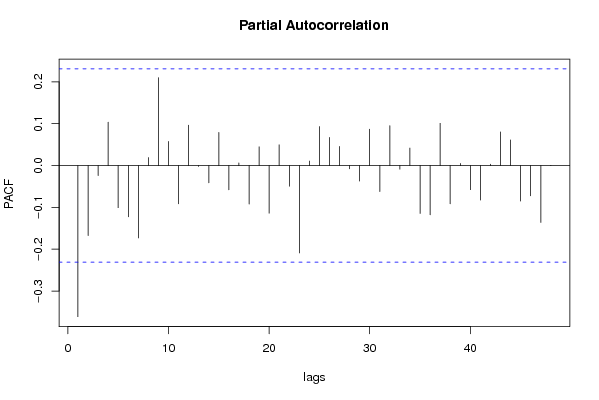
Partial Autocorrelation Function
Time lag kPACF(k)T-STATP-value
1-0.361332-3.0660.001527
2-0.167377-1.42020.079927
3-0.02389-0.20270.419966
40.1035970.8790.191149
5-0.100775-0.85510.197665
6-0.122483-1.03930.151071
7-0.173065-1.46850.073161
80.0191810.16280.435585
90.2100751.78250.039438
100.0575480.48830.313407
11-0.091501-0.77640.220025
120.0963670.81770.208112
13-0.002209-0.01870.492549
14-0.041316-0.35060.363464
150.0792550.67250.25171
16-0.057954-0.49180.312193
170.0061320.0520.479324
18-0.092058-0.78110.218641
190.044920.38120.352103
20-0.113837-0.96590.168654
210.0496470.42130.337408
22-0.049287-0.41820.338519
23-0.208868-1.77230.040287
240.0107660.09130.463734
250.0931560.79050.215928
260.0672950.5710.284883
270.0457920.38860.349376
28-0.007691-0.06530.474073
29-0.03704-0.31430.377102
300.0868650.73710.231736
31-0.062356-0.52910.29918
320.0951750.80760.210995
33-0.008607-0.0730.47099
340.0417150.3540.3622
35-0.114435-0.9710.167396
36-0.117831-0.99980.160371
370.1009320.85640.197298
38-0.091485-0.77630.220065
390.0050830.04310.482858
40-0.057879-0.49110.312419
41-0.082409-0.69930.243319
420.0031620.02680.489334
430.0804170.68240.2486
440.0613660.52070.302083
45-0.085043-0.72160.236435
46-0.072287-0.61340.270781
47-0.136188-1.15560.125833
480.0006960.00590.497653

\begin{tabular}{lllllllll}
\hline
Partial Autocorrelation Function \tabularnewline
Time lag k & PACF(k) & T-STAT & P-value \tabularnewline
1 & -0.361332 & -3.066 & 0.001527 \tabularnewline
2 & -0.167377 & -1.4202 & 0.079927 \tabularnewline
3 & -0.02389 & -0.2027 & 0.419966 \tabularnewline
4 & 0.103597 & 0.879 & 0.191149 \tabularnewline
5 & -0.100775 & -0.8551 & 0.197665 \tabularnewline
6 & -0.122483 & -1.0393 & 0.151071 \tabularnewline
7 & -0.173065 & -1.4685 & 0.073161 \tabularnewline
8 & 0.019181 & 0.1628 & 0.435585 \tabularnewline
9 & 0.210075 & 1.7825 & 0.039438 \tabularnewline
10 & 0.057548 & 0.4883 & 0.313407 \tabularnewline
11 & -0.091501 & -0.7764 & 0.220025 \tabularnewline
12 & 0.096367 & 0.8177 & 0.208112 \tabularnewline
13 & -0.002209 & -0.0187 & 0.492549 \tabularnewline
14 & -0.041316 & -0.3506 & 0.363464 \tabularnewline
15 & 0.079255 & 0.6725 & 0.25171 \tabularnewline
16 & -0.057954 & -0.4918 & 0.312193 \tabularnewline
17 & 0.006132 & 0.052 & 0.479324 \tabularnewline
18 & -0.092058 & -0.7811 & 0.218641 \tabularnewline
19 & 0.04492 & 0.3812 & 0.352103 \tabularnewline
20 & -0.113837 & -0.9659 & 0.168654 \tabularnewline
21 & 0.049647 & 0.4213 & 0.337408 \tabularnewline
22 & -0.049287 & -0.4182 & 0.338519 \tabularnewline
23 & -0.208868 & -1.7723 & 0.040287 \tabularnewline
24 & 0.010766 & 0.0913 & 0.463734 \tabularnewline
25 & 0.093156 & 0.7905 & 0.215928 \tabularnewline
26 & 0.067295 & 0.571 & 0.284883 \tabularnewline
27 & 0.045792 & 0.3886 & 0.349376 \tabularnewline
28 & -0.007691 & -0.0653 & 0.474073 \tabularnewline
29 & -0.03704 & -0.3143 & 0.377102 \tabularnewline
30 & 0.086865 & 0.7371 & 0.231736 \tabularnewline
31 & -0.062356 & -0.5291 & 0.29918 \tabularnewline
32 & 0.095175 & 0.8076 & 0.210995 \tabularnewline
33 & -0.008607 & -0.073 & 0.47099 \tabularnewline
34 & 0.041715 & 0.354 & 0.3622 \tabularnewline
35 & -0.114435 & -0.971 & 0.167396 \tabularnewline
36 & -0.117831 & -0.9998 & 0.160371 \tabularnewline
37 & 0.100932 & 0.8564 & 0.197298 \tabularnewline
38 & -0.091485 & -0.7763 & 0.220065 \tabularnewline
39 & 0.005083 & 0.0431 & 0.482858 \tabularnewline
40 & -0.057879 & -0.4911 & 0.312419 \tabularnewline
41 & -0.082409 & -0.6993 & 0.243319 \tabularnewline
42 & 0.003162 & 0.0268 & 0.489334 \tabularnewline
43 & 0.080417 & 0.6824 & 0.2486 \tabularnewline
44 & 0.061366 & 0.5207 & 0.302083 \tabularnewline
45 & -0.085043 & -0.7216 & 0.236435 \tabularnewline
46 & -0.072287 & -0.6134 & 0.270781 \tabularnewline
47 & -0.136188 & -1.1556 & 0.125833 \tabularnewline
48 & 0.000696 & 0.0059 & 0.497653 \tabularnewline
\hline
\end{tabular}
%Source: https://freestatistics.org/blog/index.php?pk=96573&T=2

[TABLE]
[ROW][C]Partial Autocorrelation Function[/C][/ROW]
[ROW][C]Time lag k[/C][C]PACF(k)[/C][C]T-STAT[/C][C]P-value[/C][/ROW]
[ROW][C]1[/C][C]-0.361332[/C][C]-3.066[/C][C]0.001527[/C][/ROW]
[ROW][C]2[/C][C]-0.167377[/C][C]-1.4202[/C][C]0.079927[/C][/ROW]
[ROW][C]3[/C][C]-0.02389[/C][C]-0.2027[/C][C]0.419966[/C][/ROW]
[ROW][C]4[/C][C]0.103597[/C][C]0.879[/C][C]0.191149[/C][/ROW]
[ROW][C]5[/C][C]-0.100775[/C][C]-0.8551[/C][C]0.197665[/C][/ROW]
[ROW][C]6[/C][C]-0.122483[/C][C]-1.0393[/C][C]0.151071[/C][/ROW]
[ROW][C]7[/C][C]-0.173065[/C][C]-1.4685[/C][C]0.073161[/C][/ROW]
[ROW][C]8[/C][C]0.019181[/C][C]0.1628[/C][C]0.435585[/C][/ROW]
[ROW][C]9[/C][C]0.210075[/C][C]1.7825[/C][C]0.039438[/C][/ROW]
[ROW][C]10[/C][C]0.057548[/C][C]0.4883[/C][C]0.313407[/C][/ROW]
[ROW][C]11[/C][C]-0.091501[/C][C]-0.7764[/C][C]0.220025[/C][/ROW]
[ROW][C]12[/C][C]0.096367[/C][C]0.8177[/C][C]0.208112[/C][/ROW]
[ROW][C]13[/C][C]-0.002209[/C][C]-0.0187[/C][C]0.492549[/C][/ROW]
[ROW][C]14[/C][C]-0.041316[/C][C]-0.3506[/C][C]0.363464[/C][/ROW]
[ROW][C]15[/C][C]0.079255[/C][C]0.6725[/C][C]0.25171[/C][/ROW]
[ROW][C]16[/C][C]-0.057954[/C][C]-0.4918[/C][C]0.312193[/C][/ROW]
[ROW][C]17[/C][C]0.006132[/C][C]0.052[/C][C]0.479324[/C][/ROW]
[ROW][C]18[/C][C]-0.092058[/C][C]-0.7811[/C][C]0.218641[/C][/ROW]
[ROW][C]19[/C][C]0.04492[/C][C]0.3812[/C][C]0.352103[/C][/ROW]
[ROW][C]20[/C][C]-0.113837[/C][C]-0.9659[/C][C]0.168654[/C][/ROW]
[ROW][C]21[/C][C]0.049647[/C][C]0.4213[/C][C]0.337408[/C][/ROW]
[ROW][C]22[/C][C]-0.049287[/C][C]-0.4182[/C][C]0.338519[/C][/ROW]
[ROW][C]23[/C][C]-0.208868[/C][C]-1.7723[/C][C]0.040287[/C][/ROW]
[ROW][C]24[/C][C]0.010766[/C][C]0.0913[/C][C]0.463734[/C][/ROW]
[ROW][C]25[/C][C]0.093156[/C][C]0.7905[/C][C]0.215928[/C][/ROW]
[ROW][C]26[/C][C]0.067295[/C][C]0.571[/C][C]0.284883[/C][/ROW]
[ROW][C]27[/C][C]0.045792[/C][C]0.3886[/C][C]0.349376[/C][/ROW]
[ROW][C]28[/C][C]-0.007691[/C][C]-0.0653[/C][C]0.474073[/C][/ROW]
[ROW][C]29[/C][C]-0.03704[/C][C]-0.3143[/C][C]0.377102[/C][/ROW]
[ROW][C]30[/C][C]0.086865[/C][C]0.7371[/C][C]0.231736[/C][/ROW]
[ROW][C]31[/C][C]-0.062356[/C][C]-0.5291[/C][C]0.29918[/C][/ROW]
[ROW][C]32[/C][C]0.095175[/C][C]0.8076[/C][C]0.210995[/C][/ROW]
[ROW][C]33[/C][C]-0.008607[/C][C]-0.073[/C][C]0.47099[/C][/ROW]
[ROW][C]34[/C][C]0.041715[/C][C]0.354[/C][C]0.3622[/C][/ROW]
[ROW][C]35[/C][C]-0.114435[/C][C]-0.971[/C][C]0.167396[/C][/ROW]
[ROW][C]36[/C][C]-0.117831[/C][C]-0.9998[/C][C]0.160371[/C][/ROW]
[ROW][C]37[/C][C]0.100932[/C][C]0.8564[/C][C]0.197298[/C][/ROW]
[ROW][C]38[/C][C]-0.091485[/C][C]-0.7763[/C][C]0.220065[/C][/ROW]
[ROW][C]39[/C][C]0.005083[/C][C]0.0431[/C][C]0.482858[/C][/ROW]
[ROW][C]40[/C][C]-0.057879[/C][C]-0.4911[/C][C]0.312419[/C][/ROW]
[ROW][C]41[/C][C]-0.082409[/C][C]-0.6993[/C][C]0.243319[/C][/ROW]
[ROW][C]42[/C][C]0.003162[/C][C]0.0268[/C][C]0.489334[/C][/ROW]
[ROW][C]43[/C][C]0.080417[/C][C]0.6824[/C][C]0.2486[/C][/ROW]
[ROW][C]44[/C][C]0.061366[/C][C]0.5207[/C][C]0.302083[/C][/ROW]
[ROW][C]45[/C][C]-0.085043[/C][C]-0.7216[/C][C]0.236435[/C][/ROW]
[ROW][C]46[/C][C]-0.072287[/C][C]-0.6134[/C][C]0.270781[/C][/ROW]
[ROW][C]47[/C][C]-0.136188[/C][C]-1.1556[/C][C]0.125833[/C][/ROW]
[ROW][C]48[/C][C]0.000696[/C][C]0.0059[/C][C]0.497653[/C][/ROW]
[/TABLE]
Source: https://freestatistics.org/blog/index.php?pk=96573&T=2

Globally Unique Identifier (entire table): ba.freestatistics.org/blog/index.php?pk=96573&T=2

As an alternative you can also use a QR Code:  

The GUIDs for individual cells are displayed in the table below:

Partial Autocorrelation Function
Time lag kPACF(k)T-STATP-value
1-0.361332-3.0660.001527
2-0.167377-1.42020.079927
3-0.02389-0.20270.419966
40.1035970.8790.191149
5-0.100775-0.85510.197665
6-0.122483-1.03930.151071
7-0.173065-1.46850.073161
80.0191810.16280.435585
90.2100751.78250.039438
100.0575480.48830.313407
11-0.091501-0.77640.220025
120.0963670.81770.208112
13-0.002209-0.01870.492549
14-0.041316-0.35060.363464
150.0792550.67250.25171
16-0.057954-0.49180.312193
170.0061320.0520.479324
18-0.092058-0.78110.218641
190.044920.38120.352103
20-0.113837-0.96590.168654
210.0496470.42130.337408
22-0.049287-0.41820.338519
23-0.208868-1.77230.040287
240.0107660.09130.463734
250.0931560.79050.215928
260.0672950.5710.284883
270.0457920.38860.349376
28-0.007691-0.06530.474073
29-0.03704-0.31430.377102
300.0868650.73710.231736
31-0.062356-0.52910.29918
320.0951750.80760.210995
33-0.008607-0.0730.47099
340.0417150.3540.3622
35-0.114435-0.9710.167396
36-0.117831-0.99980.160371
370.1009320.85640.197298
38-0.091485-0.77630.220065
390.0050830.04310.482858
40-0.057879-0.49110.312419
41-0.082409-0.69930.243319
420.0031620.02680.489334
430.0804170.68240.2486
440.0613660.52070.302083
45-0.085043-0.72160.236435
46-0.072287-0.61340.270781
47-0.136188-1.15560.125833
480.0006960.00590.497653


Parameters (Session):
par1 = 48 ; par2 = 1 ; par3 = 1 ; par4 = 0 ; par5 = 12 ; par6 = White Noise ; par7 = 0.95 ;
Parameters (R input):
par1 = 48 ; par2 = 1 ; par3 = 1 ; par4 = 0 ; par5 = 12 ; par6 = White Noise ; par7 = 0.95 ;
R code (references can be found in the software module):
if (par1 == 'Default') {
par1 = 10*log10(length(x))
} else {
par1 <- as.numeric(par1)
}
par2 <- as.numeric(par2)
par3 <- as.numeric(par3)
par4 <- as.numeric(par4)
par5 <- as.numeric(par5)
if (par6 == 'White Noise') par6 <- 'white' else par6 <- 'ma'
par7 <- as.numeric(par7)
if (par2 == 0) {
x <- log(x)
} else {
x <- (x ^ par2 - 1) / par2
}
if (par3 > 0) x <- diff(x,lag=1,difference=par3)
if (par4 > 0) x <- diff(x,lag=par5,difference=par4)
bitmap(file='pic1.png')
racf <- acf(x, par1, main='Autocorrelation', xlab='time lag', ylab='ACF', ci.type=par6, ci=par7, sub=paste('(lambda=',par2,', d=',par3,', D=',par4,', CI=', par7, ', CI type=',par6,')',sep=''))
dev.off()
bitmap(file='pic2.png')
rpacf <- pacf(x,par1,main='Partial Autocorrelation',xlab='lags',ylab='PACF')
dev.off()
(myacf <- c(racf$acf))
(mypacf <- c(rpacf$acf))
lengthx <- length(x)
sqrtn <- sqrt(lengthx)
load(file='createtable')
a<-table.start()
a<-table.row.start(a)
a<-table.element(a,'Autocorrelation Function',4,TRUE)
a<-table.row.end(a)
a<-table.row.start(a)
a<-table.element(a,'Time lag k',header=TRUE)
a<-table.element(a,hyperlink('basics.htm','ACF(k)','click here for more information about the Autocorrelation Function'),header=TRUE)
a<-table.element(a,'T-STAT',header=TRUE)
a<-table.element(a,'P-value',header=TRUE)
a<-table.row.end(a)
for (i in 2:(par1+1)) {
a<-table.row.start(a)
a<-table.element(a,i-1,header=TRUE)
a<-table.element(a,round(myacf[i],6))
mytstat <- myacf[i]*sqrtn
a<-table.element(a,round(mytstat,4))
a<-table.element(a,round(1-pt(abs(mytstat),lengthx),6))
a<-table.row.end(a)
}
a<-table.end(a)
table.save(a,file='mytable.tab')
a<-table.start()
a<-table.row.start(a)
a<-table.element(a,'Partial Autocorrelation Function',4,TRUE)
a<-table.row.end(a)
a<-table.row.start(a)
a<-table.element(a,'Time lag k',header=TRUE)
a<-table.element(a,hyperlink('basics.htm','PACF(k)','click here for more information about the Partial Autocorrelation Function'),header=TRUE)
a<-table.element(a,'T-STAT',header=TRUE)
a<-table.element(a,'P-value',header=TRUE)
a<-table.row.end(a)
for (i in 1:par1) {
a<-table.row.start(a)
a<-table.element(a,i,header=TRUE)
a<-table.element(a,round(mypacf[i],6))
mytstat <- mypacf[i]*sqrtn
a<-table.element(a,round(mytstat,4))
a<-table.element(a,round(1-pt(abs(mytstat),lengthx),6))
a<-table.row.end(a)
}
a<-table.end(a)
table.save(a,file='mytable1.tab')