Free Statistics

of Irreproducible Research!

Author's title

Author*Unverified author*
R Software Modulerwasp_autocorrelation.wasp
Title produced by software(Partial) Autocorrelation Function
Date of computationWed, 17 Nov 2010 09:52:12 +0000
Cite this page as followsStatistical Computations at FreeStatistics.org, Office for Research Development and Education, URL https://freestatistics.org/blog/index.php?v=date/2010/Nov/17/t1289987467o3p322rd54r8mvw.htm/, Retrieved Fri, 26 Apr 2024 04:45:30 +0000
Statistical Computations at FreeStatistics.org, Office for Research Development and Education, URL https://freestatistics.org/blog/index.php?pk=96570, Retrieved Fri, 26 Apr 2024 04:45:30 +0000
QR Codes:

Original text written by user:
IsPrivate?No (this computation is public)
User-defined keywordsKDGP2W12
Estimated Impact133
Family? (F = Feedback message, R = changed R code, M = changed R Module, P = changed Parameters, D = changed Data)
-       [(Partial) Autocorrelation Function] [] [2010-11-17 09:52:12] [49c40d716750d950b45a50638ed38982] [Current]
Feedback Forum

Post a new message
Dataseries X:
1552
2081
1500
1437
1470
1849
1387
1592
1590
1798
1935
1887
2027
2080
1556
1682
1785
1869
1781
2082
2571
1862
1938
1505
1767
1607
1578
1495
1615
1700
1337
1531
1623
1543
1640
1524
1429
1827
1603
1351
1267
1742
1384
1392
1649
1665
1526
1717
1391
1790
1472
1350
1704
1391
1190
1351
1160
1236
1444
1257
1193
1701
1428
1611
1431
1472
1240
1276
1467
1603
2014
2463
2510


Summary of computational transaction
Raw Inputview raw input (R code)
Raw Outputview raw output of R engine
Computing time2 seconds
R Server'Gwilym Jenkins' @ 72.249.127.135

\begin{tabular}{lllllllll}
\hline
Summary of computational transaction \tabularnewline
Raw Input & view raw input (R code)  \tabularnewline
Raw Output & view raw output of R engine  \tabularnewline
Computing time & 2 seconds \tabularnewline
R Server & 'Gwilym Jenkins' @ 72.249.127.135 \tabularnewline
\hline
\end{tabular}
%Source: https://freestatistics.org/blog/index.php?pk=96570&T=0

[TABLE]
[ROW][C]Summary of computational transaction[/C][/ROW]
[ROW][C]Raw Input[/C][C]view raw input (R code) [/C][/ROW]
[ROW][C]Raw Output[/C][C]view raw output of R engine [/C][/ROW]
[ROW][C]Computing time[/C][C]2 seconds[/C][/ROW]
[ROW][C]R Server[/C][C]'Gwilym Jenkins' @ 72.249.127.135[/C][/ROW]
[/TABLE]
Source: https://freestatistics.org/blog/index.php?pk=96570&T=0

Globally Unique Identifier (entire table): ba.freestatistics.org/blog/index.php?pk=96570&T=0

As an alternative you can also use a QR Code:  

The GUIDs for individual cells are displayed in the table below:

Summary of computational transaction
Raw Inputview raw input (R code)
Raw Outputview raw output of R engine
Computing time2 seconds
R Server'Gwilym Jenkins' @ 72.249.127.135


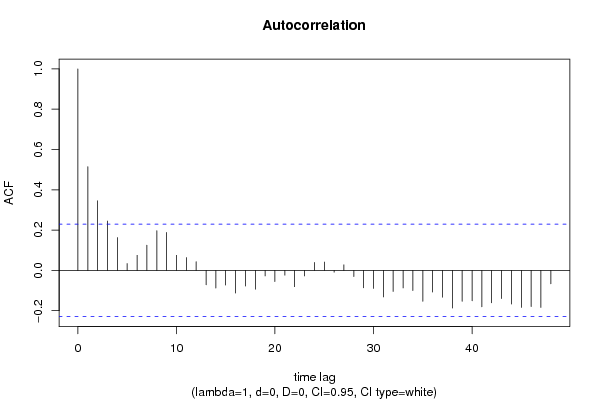
Autocorrelation Function
Time lag kACF(k)T-STATP-value
10.5149424.39971.8e-05
20.3454522.95150.002125
30.2449662.0930.019913
40.1629571.39230.084029
50.0343350.29340.385042
60.075240.64290.261167
70.1252261.06990.144088
80.1975451.68780.047857
90.1885091.61060.055789
100.075260.6430.261113
110.0636890.54420.293994
120.0432640.36960.356357
13-0.071368-0.60980.271953
14-0.087392-0.74670.228827
15-0.072773-0.62180.268015
16-0.112169-0.95840.170519
17-0.077436-0.66160.255151
18-0.093091-0.79540.214488
19-0.027052-0.23110.408931
20-0.055407-0.47340.318671
21-0.023516-0.20090.420661
22-0.080724-0.68970.246283
23-0.027352-0.23370.407938
240.0396530.33880.367867
250.0414350.3540.362173
26-0.008682-0.07420.470534
270.0278190.23770.406394
28-0.030599-0.26140.397246
29-0.086045-0.73520.232296
30-0.089303-0.7630.223958
31-0.131884-1.12680.131755
32-0.104269-0.89090.187963
33-0.086728-0.7410.230533
34-0.100012-0.85450.197811
35-0.153116-1.30820.097451
36-0.107649-0.91980.180366
37-0.13306-1.13690.129657
38-0.186595-1.59430.057599
39-0.15338-1.31050.097071
40-0.15054-1.28620.101217
41-0.180846-1.54520.063317
42-0.160894-1.37470.086718
43-0.139793-1.19440.118095
44-0.166652-1.42390.079372
45-0.183705-1.56960.060419
46-0.179517-1.53380.064702
47-0.183674-1.56930.06045
48-0.066337-0.56680.286299

\begin{tabular}{lllllllll}
\hline
Autocorrelation Function \tabularnewline
Time lag k & ACF(k) & T-STAT & P-value \tabularnewline
1 & 0.514942 & 4.3997 & 1.8e-05 \tabularnewline
2 & 0.345452 & 2.9515 & 0.002125 \tabularnewline
3 & 0.244966 & 2.093 & 0.019913 \tabularnewline
4 & 0.162957 & 1.3923 & 0.084029 \tabularnewline
5 & 0.034335 & 0.2934 & 0.385042 \tabularnewline
6 & 0.07524 & 0.6429 & 0.261167 \tabularnewline
7 & 0.125226 & 1.0699 & 0.144088 \tabularnewline
8 & 0.197545 & 1.6878 & 0.047857 \tabularnewline
9 & 0.188509 & 1.6106 & 0.055789 \tabularnewline
10 & 0.07526 & 0.643 & 0.261113 \tabularnewline
11 & 0.063689 & 0.5442 & 0.293994 \tabularnewline
12 & 0.043264 & 0.3696 & 0.356357 \tabularnewline
13 & -0.071368 & -0.6098 & 0.271953 \tabularnewline
14 & -0.087392 & -0.7467 & 0.228827 \tabularnewline
15 & -0.072773 & -0.6218 & 0.268015 \tabularnewline
16 & -0.112169 & -0.9584 & 0.170519 \tabularnewline
17 & -0.077436 & -0.6616 & 0.255151 \tabularnewline
18 & -0.093091 & -0.7954 & 0.214488 \tabularnewline
19 & -0.027052 & -0.2311 & 0.408931 \tabularnewline
20 & -0.055407 & -0.4734 & 0.318671 \tabularnewline
21 & -0.023516 & -0.2009 & 0.420661 \tabularnewline
22 & -0.080724 & -0.6897 & 0.246283 \tabularnewline
23 & -0.027352 & -0.2337 & 0.407938 \tabularnewline
24 & 0.039653 & 0.3388 & 0.367867 \tabularnewline
25 & 0.041435 & 0.354 & 0.362173 \tabularnewline
26 & -0.008682 & -0.0742 & 0.470534 \tabularnewline
27 & 0.027819 & 0.2377 & 0.406394 \tabularnewline
28 & -0.030599 & -0.2614 & 0.397246 \tabularnewline
29 & -0.086045 & -0.7352 & 0.232296 \tabularnewline
30 & -0.089303 & -0.763 & 0.223958 \tabularnewline
31 & -0.131884 & -1.1268 & 0.131755 \tabularnewline
32 & -0.104269 & -0.8909 & 0.187963 \tabularnewline
33 & -0.086728 & -0.741 & 0.230533 \tabularnewline
34 & -0.100012 & -0.8545 & 0.197811 \tabularnewline
35 & -0.153116 & -1.3082 & 0.097451 \tabularnewline
36 & -0.107649 & -0.9198 & 0.180366 \tabularnewline
37 & -0.13306 & -1.1369 & 0.129657 \tabularnewline
38 & -0.186595 & -1.5943 & 0.057599 \tabularnewline
39 & -0.15338 & -1.3105 & 0.097071 \tabularnewline
40 & -0.15054 & -1.2862 & 0.101217 \tabularnewline
41 & -0.180846 & -1.5452 & 0.063317 \tabularnewline
42 & -0.160894 & -1.3747 & 0.086718 \tabularnewline
43 & -0.139793 & -1.1944 & 0.118095 \tabularnewline
44 & -0.166652 & -1.4239 & 0.079372 \tabularnewline
45 & -0.183705 & -1.5696 & 0.060419 \tabularnewline
46 & -0.179517 & -1.5338 & 0.064702 \tabularnewline
47 & -0.183674 & -1.5693 & 0.06045 \tabularnewline
48 & -0.066337 & -0.5668 & 0.286299 \tabularnewline
\hline
\end{tabular}
%Source: https://freestatistics.org/blog/index.php?pk=96570&T=1

[TABLE]
[ROW][C]Autocorrelation Function[/C][/ROW]
[ROW][C]Time lag k[/C][C]ACF(k)[/C][C]T-STAT[/C][C]P-value[/C][/ROW]
[ROW][C]1[/C][C]0.514942[/C][C]4.3997[/C][C]1.8e-05[/C][/ROW]
[ROW][C]2[/C][C]0.345452[/C][C]2.9515[/C][C]0.002125[/C][/ROW]
[ROW][C]3[/C][C]0.244966[/C][C]2.093[/C][C]0.019913[/C][/ROW]
[ROW][C]4[/C][C]0.162957[/C][C]1.3923[/C][C]0.084029[/C][/ROW]
[ROW][C]5[/C][C]0.034335[/C][C]0.2934[/C][C]0.385042[/C][/ROW]
[ROW][C]6[/C][C]0.07524[/C][C]0.6429[/C][C]0.261167[/C][/ROW]
[ROW][C]7[/C][C]0.125226[/C][C]1.0699[/C][C]0.144088[/C][/ROW]
[ROW][C]8[/C][C]0.197545[/C][C]1.6878[/C][C]0.047857[/C][/ROW]
[ROW][C]9[/C][C]0.188509[/C][C]1.6106[/C][C]0.055789[/C][/ROW]
[ROW][C]10[/C][C]0.07526[/C][C]0.643[/C][C]0.261113[/C][/ROW]
[ROW][C]11[/C][C]0.063689[/C][C]0.5442[/C][C]0.293994[/C][/ROW]
[ROW][C]12[/C][C]0.043264[/C][C]0.3696[/C][C]0.356357[/C][/ROW]
[ROW][C]13[/C][C]-0.071368[/C][C]-0.6098[/C][C]0.271953[/C][/ROW]
[ROW][C]14[/C][C]-0.087392[/C][C]-0.7467[/C][C]0.228827[/C][/ROW]
[ROW][C]15[/C][C]-0.072773[/C][C]-0.6218[/C][C]0.268015[/C][/ROW]
[ROW][C]16[/C][C]-0.112169[/C][C]-0.9584[/C][C]0.170519[/C][/ROW]
[ROW][C]17[/C][C]-0.077436[/C][C]-0.6616[/C][C]0.255151[/C][/ROW]
[ROW][C]18[/C][C]-0.093091[/C][C]-0.7954[/C][C]0.214488[/C][/ROW]
[ROW][C]19[/C][C]-0.027052[/C][C]-0.2311[/C][C]0.408931[/C][/ROW]
[ROW][C]20[/C][C]-0.055407[/C][C]-0.4734[/C][C]0.318671[/C][/ROW]
[ROW][C]21[/C][C]-0.023516[/C][C]-0.2009[/C][C]0.420661[/C][/ROW]
[ROW][C]22[/C][C]-0.080724[/C][C]-0.6897[/C][C]0.246283[/C][/ROW]
[ROW][C]23[/C][C]-0.027352[/C][C]-0.2337[/C][C]0.407938[/C][/ROW]
[ROW][C]24[/C][C]0.039653[/C][C]0.3388[/C][C]0.367867[/C][/ROW]
[ROW][C]25[/C][C]0.041435[/C][C]0.354[/C][C]0.362173[/C][/ROW]
[ROW][C]26[/C][C]-0.008682[/C][C]-0.0742[/C][C]0.470534[/C][/ROW]
[ROW][C]27[/C][C]0.027819[/C][C]0.2377[/C][C]0.406394[/C][/ROW]
[ROW][C]28[/C][C]-0.030599[/C][C]-0.2614[/C][C]0.397246[/C][/ROW]
[ROW][C]29[/C][C]-0.086045[/C][C]-0.7352[/C][C]0.232296[/C][/ROW]
[ROW][C]30[/C][C]-0.089303[/C][C]-0.763[/C][C]0.223958[/C][/ROW]
[ROW][C]31[/C][C]-0.131884[/C][C]-1.1268[/C][C]0.131755[/C][/ROW]
[ROW][C]32[/C][C]-0.104269[/C][C]-0.8909[/C][C]0.187963[/C][/ROW]
[ROW][C]33[/C][C]-0.086728[/C][C]-0.741[/C][C]0.230533[/C][/ROW]
[ROW][C]34[/C][C]-0.100012[/C][C]-0.8545[/C][C]0.197811[/C][/ROW]
[ROW][C]35[/C][C]-0.153116[/C][C]-1.3082[/C][C]0.097451[/C][/ROW]
[ROW][C]36[/C][C]-0.107649[/C][C]-0.9198[/C][C]0.180366[/C][/ROW]
[ROW][C]37[/C][C]-0.13306[/C][C]-1.1369[/C][C]0.129657[/C][/ROW]
[ROW][C]38[/C][C]-0.186595[/C][C]-1.5943[/C][C]0.057599[/C][/ROW]
[ROW][C]39[/C][C]-0.15338[/C][C]-1.3105[/C][C]0.097071[/C][/ROW]
[ROW][C]40[/C][C]-0.15054[/C][C]-1.2862[/C][C]0.101217[/C][/ROW]
[ROW][C]41[/C][C]-0.180846[/C][C]-1.5452[/C][C]0.063317[/C][/ROW]
[ROW][C]42[/C][C]-0.160894[/C][C]-1.3747[/C][C]0.086718[/C][/ROW]
[ROW][C]43[/C][C]-0.139793[/C][C]-1.1944[/C][C]0.118095[/C][/ROW]
[ROW][C]44[/C][C]-0.166652[/C][C]-1.4239[/C][C]0.079372[/C][/ROW]
[ROW][C]45[/C][C]-0.183705[/C][C]-1.5696[/C][C]0.060419[/C][/ROW]
[ROW][C]46[/C][C]-0.179517[/C][C]-1.5338[/C][C]0.064702[/C][/ROW]
[ROW][C]47[/C][C]-0.183674[/C][C]-1.5693[/C][C]0.06045[/C][/ROW]
[ROW][C]48[/C][C]-0.066337[/C][C]-0.5668[/C][C]0.286299[/C][/ROW]
[/TABLE]
Source: https://freestatistics.org/blog/index.php?pk=96570&T=1

Globally Unique Identifier (entire table): ba.freestatistics.org/blog/index.php?pk=96570&T=1

As an alternative you can also use a QR Code:  

The GUIDs for individual cells are displayed in the table below:

Autocorrelation Function
Time lag kACF(k)T-STATP-value
10.5149424.39971.8e-05
20.3454522.95150.002125
30.2449662.0930.019913
40.1629571.39230.084029
50.0343350.29340.385042
60.075240.64290.261167
70.1252261.06990.144088
80.1975451.68780.047857
90.1885091.61060.055789
100.075260.6430.261113
110.0636890.54420.293994
120.0432640.36960.356357
13-0.071368-0.60980.271953
14-0.087392-0.74670.228827
15-0.072773-0.62180.268015
16-0.112169-0.95840.170519
17-0.077436-0.66160.255151
18-0.093091-0.79540.214488
19-0.027052-0.23110.408931
20-0.055407-0.47340.318671
21-0.023516-0.20090.420661
22-0.080724-0.68970.246283
23-0.027352-0.23370.407938
240.0396530.33880.367867
250.0414350.3540.362173
26-0.008682-0.07420.470534
270.0278190.23770.406394
28-0.030599-0.26140.397246
29-0.086045-0.73520.232296
30-0.089303-0.7630.223958
31-0.131884-1.12680.131755
32-0.104269-0.89090.187963
33-0.086728-0.7410.230533
34-0.100012-0.85450.197811
35-0.153116-1.30820.097451
36-0.107649-0.91980.180366
37-0.13306-1.13690.129657
38-0.186595-1.59430.057599
39-0.15338-1.31050.097071
40-0.15054-1.28620.101217
41-0.180846-1.54520.063317
42-0.160894-1.37470.086718
43-0.139793-1.19440.118095
44-0.166652-1.42390.079372
45-0.183705-1.56960.060419
46-0.179517-1.53380.064702
47-0.183674-1.56930.06045
48-0.066337-0.56680.286299


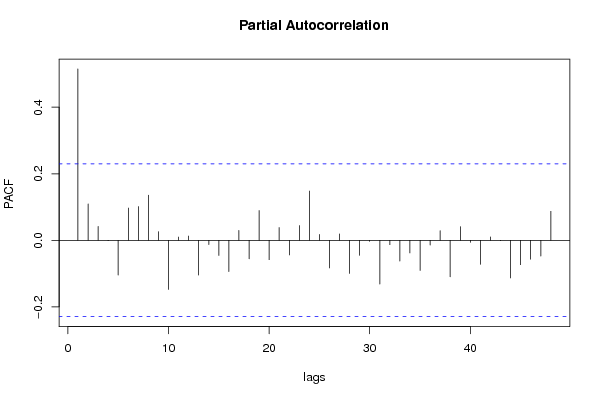
Partial Autocorrelation Function
Time lag kPACF(k)T-STATP-value
10.5149424.39971.8e-05
20.1092580.93350.17682
30.0416670.3560.361433
4-0.001224-0.01050.495844
5-0.104501-0.89290.187434
60.096820.82720.205402
70.1013160.86560.194761
80.1354721.15750.125426
90.0257450.220.413255
10-0.147775-1.26260.105377
110.0098250.08390.466667
120.0128130.10950.456565
13-0.104274-0.89090.187951
14-0.012935-0.11050.456152
15-0.045364-0.38760.349724
16-0.093872-0.8020.212566
170.0295760.25270.400606
18-0.05562-0.47520.318027
190.0893540.76340.223832
20-0.058133-0.49670.31045
210.0384820.32880.371628
22-0.044026-0.37620.353946
230.0443720.37910.352853
240.1479551.26410.105103
250.0175520.150.440603
26-0.082963-0.70880.240341
270.0191620.16370.435203
28-0.099498-0.85010.199021
29-0.044911-0.38370.351152
30-0.002913-0.02490.490106
31-0.131473-1.12330.132495
32-0.013263-0.11330.455043
33-0.062308-0.53240.298047
34-0.037797-0.32290.373833
35-0.090675-0.77470.220501
36-0.014237-0.12160.451759
370.0289590.24740.402636
38-0.109764-0.93780.175713
390.0408990.34940.363881
40-0.00594-0.05070.479832
41-0.071955-0.61480.270304
420.0101870.0870.465439
43-0.000981-0.00840.496668
44-0.113143-0.96670.168445
45-0.073101-0.62460.267099
46-0.056893-0.48610.314177
47-0.047291-0.40410.343676
480.0870950.74410.229591

\begin{tabular}{lllllllll}
\hline
Partial Autocorrelation Function \tabularnewline
Time lag k & PACF(k) & T-STAT & P-value \tabularnewline
1 & 0.514942 & 4.3997 & 1.8e-05 \tabularnewline
2 & 0.109258 & 0.9335 & 0.17682 \tabularnewline
3 & 0.041667 & 0.356 & 0.361433 \tabularnewline
4 & -0.001224 & -0.0105 & 0.495844 \tabularnewline
5 & -0.104501 & -0.8929 & 0.187434 \tabularnewline
6 & 0.09682 & 0.8272 & 0.205402 \tabularnewline
7 & 0.101316 & 0.8656 & 0.194761 \tabularnewline
8 & 0.135472 & 1.1575 & 0.125426 \tabularnewline
9 & 0.025745 & 0.22 & 0.413255 \tabularnewline
10 & -0.147775 & -1.2626 & 0.105377 \tabularnewline
11 & 0.009825 & 0.0839 & 0.466667 \tabularnewline
12 & 0.012813 & 0.1095 & 0.456565 \tabularnewline
13 & -0.104274 & -0.8909 & 0.187951 \tabularnewline
14 & -0.012935 & -0.1105 & 0.456152 \tabularnewline
15 & -0.045364 & -0.3876 & 0.349724 \tabularnewline
16 & -0.093872 & -0.802 & 0.212566 \tabularnewline
17 & 0.029576 & 0.2527 & 0.400606 \tabularnewline
18 & -0.05562 & -0.4752 & 0.318027 \tabularnewline
19 & 0.089354 & 0.7634 & 0.223832 \tabularnewline
20 & -0.058133 & -0.4967 & 0.31045 \tabularnewline
21 & 0.038482 & 0.3288 & 0.371628 \tabularnewline
22 & -0.044026 & -0.3762 & 0.353946 \tabularnewline
23 & 0.044372 & 0.3791 & 0.352853 \tabularnewline
24 & 0.147955 & 1.2641 & 0.105103 \tabularnewline
25 & 0.017552 & 0.15 & 0.440603 \tabularnewline
26 & -0.082963 & -0.7088 & 0.240341 \tabularnewline
27 & 0.019162 & 0.1637 & 0.435203 \tabularnewline
28 & -0.099498 & -0.8501 & 0.199021 \tabularnewline
29 & -0.044911 & -0.3837 & 0.351152 \tabularnewline
30 & -0.002913 & -0.0249 & 0.490106 \tabularnewline
31 & -0.131473 & -1.1233 & 0.132495 \tabularnewline
32 & -0.013263 & -0.1133 & 0.455043 \tabularnewline
33 & -0.062308 & -0.5324 & 0.298047 \tabularnewline
34 & -0.037797 & -0.3229 & 0.373833 \tabularnewline
35 & -0.090675 & -0.7747 & 0.220501 \tabularnewline
36 & -0.014237 & -0.1216 & 0.451759 \tabularnewline
37 & 0.028959 & 0.2474 & 0.402636 \tabularnewline
38 & -0.109764 & -0.9378 & 0.175713 \tabularnewline
39 & 0.040899 & 0.3494 & 0.363881 \tabularnewline
40 & -0.00594 & -0.0507 & 0.479832 \tabularnewline
41 & -0.071955 & -0.6148 & 0.270304 \tabularnewline
42 & 0.010187 & 0.087 & 0.465439 \tabularnewline
43 & -0.000981 & -0.0084 & 0.496668 \tabularnewline
44 & -0.113143 & -0.9667 & 0.168445 \tabularnewline
45 & -0.073101 & -0.6246 & 0.267099 \tabularnewline
46 & -0.056893 & -0.4861 & 0.314177 \tabularnewline
47 & -0.047291 & -0.4041 & 0.343676 \tabularnewline
48 & 0.087095 & 0.7441 & 0.229591 \tabularnewline
\hline
\end{tabular}
%Source: https://freestatistics.org/blog/index.php?pk=96570&T=2

[TABLE]
[ROW][C]Partial Autocorrelation Function[/C][/ROW]
[ROW][C]Time lag k[/C][C]PACF(k)[/C][C]T-STAT[/C][C]P-value[/C][/ROW]
[ROW][C]1[/C][C]0.514942[/C][C]4.3997[/C][C]1.8e-05[/C][/ROW]
[ROW][C]2[/C][C]0.109258[/C][C]0.9335[/C][C]0.17682[/C][/ROW]
[ROW][C]3[/C][C]0.041667[/C][C]0.356[/C][C]0.361433[/C][/ROW]
[ROW][C]4[/C][C]-0.001224[/C][C]-0.0105[/C][C]0.495844[/C][/ROW]
[ROW][C]5[/C][C]-0.104501[/C][C]-0.8929[/C][C]0.187434[/C][/ROW]
[ROW][C]6[/C][C]0.09682[/C][C]0.8272[/C][C]0.205402[/C][/ROW]
[ROW][C]7[/C][C]0.101316[/C][C]0.8656[/C][C]0.194761[/C][/ROW]
[ROW][C]8[/C][C]0.135472[/C][C]1.1575[/C][C]0.125426[/C][/ROW]
[ROW][C]9[/C][C]0.025745[/C][C]0.22[/C][C]0.413255[/C][/ROW]
[ROW][C]10[/C][C]-0.147775[/C][C]-1.2626[/C][C]0.105377[/C][/ROW]
[ROW][C]11[/C][C]0.009825[/C][C]0.0839[/C][C]0.466667[/C][/ROW]
[ROW][C]12[/C][C]0.012813[/C][C]0.1095[/C][C]0.456565[/C][/ROW]
[ROW][C]13[/C][C]-0.104274[/C][C]-0.8909[/C][C]0.187951[/C][/ROW]
[ROW][C]14[/C][C]-0.012935[/C][C]-0.1105[/C][C]0.456152[/C][/ROW]
[ROW][C]15[/C][C]-0.045364[/C][C]-0.3876[/C][C]0.349724[/C][/ROW]
[ROW][C]16[/C][C]-0.093872[/C][C]-0.802[/C][C]0.212566[/C][/ROW]
[ROW][C]17[/C][C]0.029576[/C][C]0.2527[/C][C]0.400606[/C][/ROW]
[ROW][C]18[/C][C]-0.05562[/C][C]-0.4752[/C][C]0.318027[/C][/ROW]
[ROW][C]19[/C][C]0.089354[/C][C]0.7634[/C][C]0.223832[/C][/ROW]
[ROW][C]20[/C][C]-0.058133[/C][C]-0.4967[/C][C]0.31045[/C][/ROW]
[ROW][C]21[/C][C]0.038482[/C][C]0.3288[/C][C]0.371628[/C][/ROW]
[ROW][C]22[/C][C]-0.044026[/C][C]-0.3762[/C][C]0.353946[/C][/ROW]
[ROW][C]23[/C][C]0.044372[/C][C]0.3791[/C][C]0.352853[/C][/ROW]
[ROW][C]24[/C][C]0.147955[/C][C]1.2641[/C][C]0.105103[/C][/ROW]
[ROW][C]25[/C][C]0.017552[/C][C]0.15[/C][C]0.440603[/C][/ROW]
[ROW][C]26[/C][C]-0.082963[/C][C]-0.7088[/C][C]0.240341[/C][/ROW]
[ROW][C]27[/C][C]0.019162[/C][C]0.1637[/C][C]0.435203[/C][/ROW]
[ROW][C]28[/C][C]-0.099498[/C][C]-0.8501[/C][C]0.199021[/C][/ROW]
[ROW][C]29[/C][C]-0.044911[/C][C]-0.3837[/C][C]0.351152[/C][/ROW]
[ROW][C]30[/C][C]-0.002913[/C][C]-0.0249[/C][C]0.490106[/C][/ROW]
[ROW][C]31[/C][C]-0.131473[/C][C]-1.1233[/C][C]0.132495[/C][/ROW]
[ROW][C]32[/C][C]-0.013263[/C][C]-0.1133[/C][C]0.455043[/C][/ROW]
[ROW][C]33[/C][C]-0.062308[/C][C]-0.5324[/C][C]0.298047[/C][/ROW]
[ROW][C]34[/C][C]-0.037797[/C][C]-0.3229[/C][C]0.373833[/C][/ROW]
[ROW][C]35[/C][C]-0.090675[/C][C]-0.7747[/C][C]0.220501[/C][/ROW]
[ROW][C]36[/C][C]-0.014237[/C][C]-0.1216[/C][C]0.451759[/C][/ROW]
[ROW][C]37[/C][C]0.028959[/C][C]0.2474[/C][C]0.402636[/C][/ROW]
[ROW][C]38[/C][C]-0.109764[/C][C]-0.9378[/C][C]0.175713[/C][/ROW]
[ROW][C]39[/C][C]0.040899[/C][C]0.3494[/C][C]0.363881[/C][/ROW]
[ROW][C]40[/C][C]-0.00594[/C][C]-0.0507[/C][C]0.479832[/C][/ROW]
[ROW][C]41[/C][C]-0.071955[/C][C]-0.6148[/C][C]0.270304[/C][/ROW]
[ROW][C]42[/C][C]0.010187[/C][C]0.087[/C][C]0.465439[/C][/ROW]
[ROW][C]43[/C][C]-0.000981[/C][C]-0.0084[/C][C]0.496668[/C][/ROW]
[ROW][C]44[/C][C]-0.113143[/C][C]-0.9667[/C][C]0.168445[/C][/ROW]
[ROW][C]45[/C][C]-0.073101[/C][C]-0.6246[/C][C]0.267099[/C][/ROW]
[ROW][C]46[/C][C]-0.056893[/C][C]-0.4861[/C][C]0.314177[/C][/ROW]
[ROW][C]47[/C][C]-0.047291[/C][C]-0.4041[/C][C]0.343676[/C][/ROW]
[ROW][C]48[/C][C]0.087095[/C][C]0.7441[/C][C]0.229591[/C][/ROW]
[/TABLE]
Source: https://freestatistics.org/blog/index.php?pk=96570&T=2

Globally Unique Identifier (entire table): ba.freestatistics.org/blog/index.php?pk=96570&T=2

As an alternative you can also use a QR Code:  

The GUIDs for individual cells are displayed in the table below:

Partial Autocorrelation Function
Time lag kPACF(k)T-STATP-value
10.5149424.39971.8e-05
20.1092580.93350.17682
30.0416670.3560.361433
4-0.001224-0.01050.495844
5-0.104501-0.89290.187434
60.096820.82720.205402
70.1013160.86560.194761
80.1354721.15750.125426
90.0257450.220.413255
10-0.147775-1.26260.105377
110.0098250.08390.466667
120.0128130.10950.456565
13-0.104274-0.89090.187951
14-0.012935-0.11050.456152
15-0.045364-0.38760.349724
16-0.093872-0.8020.212566
170.0295760.25270.400606
18-0.05562-0.47520.318027
190.0893540.76340.223832
20-0.058133-0.49670.31045
210.0384820.32880.371628
22-0.044026-0.37620.353946
230.0443720.37910.352853
240.1479551.26410.105103
250.0175520.150.440603
26-0.082963-0.70880.240341
270.0191620.16370.435203
28-0.099498-0.85010.199021
29-0.044911-0.38370.351152
30-0.002913-0.02490.490106
31-0.131473-1.12330.132495
32-0.013263-0.11330.455043
33-0.062308-0.53240.298047
34-0.037797-0.32290.373833
35-0.090675-0.77470.220501
36-0.014237-0.12160.451759
370.0289590.24740.402636
38-0.109764-0.93780.175713
390.0408990.34940.363881
40-0.00594-0.05070.479832
41-0.071955-0.61480.270304
420.0101870.0870.465439
43-0.000981-0.00840.496668
44-0.113143-0.96670.168445
45-0.073101-0.62460.267099
46-0.056893-0.48610.314177
47-0.047291-0.40410.343676
480.0870950.74410.229591


Parameters (Session):
par1 = 48 ; par2 = 1 ; par3 = 0 ; par4 = 0 ; par5 = 12 ; par6 = White Noise ; par7 = 0.95 ;
Parameters (R input):
par1 = 48 ; par2 = 1 ; par3 = 0 ; par4 = 0 ; par5 = 12 ; par6 = White Noise ; par7 = 0.95 ;
R code (references can be found in the software module):
if (par1 == 'Default') {
par1 = 10*log10(length(x))
} else {
par1 <- as.numeric(par1)
}
par2 <- as.numeric(par2)
par3 <- as.numeric(par3)
par4 <- as.numeric(par4)
par5 <- as.numeric(par5)
if (par6 == 'White Noise') par6 <- 'white' else par6 <- 'ma'
par7 <- as.numeric(par7)
if (par2 == 0) {
x <- log(x)
} else {
x <- (x ^ par2 - 1) / par2
}
if (par3 > 0) x <- diff(x,lag=1,difference=par3)
if (par4 > 0) x <- diff(x,lag=par5,difference=par4)
bitmap(file='pic1.png')
racf <- acf(x, par1, main='Autocorrelation', xlab='time lag', ylab='ACF', ci.type=par6, ci=par7, sub=paste('(lambda=',par2,', d=',par3,', D=',par4,', CI=', par7, ', CI type=',par6,')',sep=''))
dev.off()
bitmap(file='pic2.png')
rpacf <- pacf(x,par1,main='Partial Autocorrelation',xlab='lags',ylab='PACF')
dev.off()
(myacf <- c(racf$acf))
(mypacf <- c(rpacf$acf))
lengthx <- length(x)
sqrtn <- sqrt(lengthx)
load(file='createtable')
a<-table.start()
a<-table.row.start(a)
a<-table.element(a,'Autocorrelation Function',4,TRUE)
a<-table.row.end(a)
a<-table.row.start(a)
a<-table.element(a,'Time lag k',header=TRUE)
a<-table.element(a,hyperlink('basics.htm','ACF(k)','click here for more information about the Autocorrelation Function'),header=TRUE)
a<-table.element(a,'T-STAT',header=TRUE)
a<-table.element(a,'P-value',header=TRUE)
a<-table.row.end(a)
for (i in 2:(par1+1)) {
a<-table.row.start(a)
a<-table.element(a,i-1,header=TRUE)
a<-table.element(a,round(myacf[i],6))
mytstat <- myacf[i]*sqrtn
a<-table.element(a,round(mytstat,4))
a<-table.element(a,round(1-pt(abs(mytstat),lengthx),6))
a<-table.row.end(a)
}
a<-table.end(a)
table.save(a,file='mytable.tab')
a<-table.start()
a<-table.row.start(a)
a<-table.element(a,'Partial Autocorrelation Function',4,TRUE)
a<-table.row.end(a)
a<-table.row.start(a)
a<-table.element(a,'Time lag k',header=TRUE)
a<-table.element(a,hyperlink('basics.htm','PACF(k)','click here for more information about the Partial Autocorrelation Function'),header=TRUE)
a<-table.element(a,'T-STAT',header=TRUE)
a<-table.element(a,'P-value',header=TRUE)
a<-table.row.end(a)
for (i in 1:par1) {
a<-table.row.start(a)
a<-table.element(a,i,header=TRUE)
a<-table.element(a,round(mypacf[i],6))
mytstat <- mypacf[i]*sqrtn
a<-table.element(a,round(mytstat,4))
a<-table.element(a,round(1-pt(abs(mytstat),lengthx),6))
a<-table.row.end(a)
}
a<-table.end(a)
table.save(a,file='mytable1.tab')