| Tabulation of Results | ||
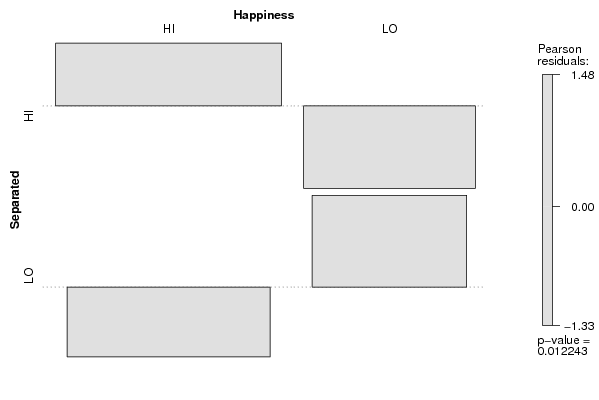
| Separated x Happiness | ||
| HI | LO | HI | 64 | 25 | LO | 38 | 34 |
| Tabulation of Expected Results | ||
| Separated x Happiness | ||
| HI | LO | HI | 56.39 | 32.61 | LO | 45.61 | 26.39 |
| Statistical Results | |
| Pearson's Chi-squared test with Yates' continuity correction | |
| Chi Square Statistic | 5.48 |
| Degrees of Freedom | 1 |
| P value | 0.02 |