Free Statistics

of Irreproducible Research!

Author's title

Author*The author of this computation has been verified*
R Software Modulerwasp_linear_regression.wasp
Title produced by softwareLinear Regression Graphical Model Validation
Date of computationSun, 14 Nov 2010 13:58:56 +0000
Cite this page as followsStatistical Computations at FreeStatistics.org, Office for Research Development and Education, URL https://freestatistics.org/blog/index.php?v=date/2010/Nov/14/t1289744684oadf18zjj1h6qrk.htm/, Retrieved Thu, 25 Apr 2024 21:38:51 +0000
Statistical Computations at FreeStatistics.org, Office for Research Development and Education, URL https://freestatistics.org/blog/index.php?pk=94529, Retrieved Thu, 25 Apr 2024 21:38:51 +0000
QR Codes:

Original text written by user:
IsPrivate?No (this computation is public)
User-defined keywords
Estimated Impact154
Family? (F = Feedback message, R = changed R code, M = changed R Module, P = changed Parameters, D = changed Data)
-     [Paired and Unpaired Two Samples Tests about the Mean] [WS 5 Question 3] [2010-11-01 07:38:26] [00b18f0d8e13a2047ccd266ce7bab24a]
- RMPD    [Linear Regression Graphical Model Validation] [WS 6 Tutorial Hyp...] [2010-11-14 13:58:56] [4d0f7ea43b071af5c75b527ee1ef14c2] [Current]
Feedback Forum

Post a new message
Dataseries X:
265,563
187,07
299,256
241,34
273,941
444,295
161,93
165,479
206,776
239,511
239,745
242,754
179,838
225,461
196,268
172,547
171,014
177,49
173,437
274,655
284,46
182,315
173,285
299,614
210,206
199,094
262,88
263,541
274,238
202,129
334,315
308,94
252,318
185,563
413,511
1106,398
273,259
574,372
759,868
327,407
256,36
240,008
173,67
238,118
235,992
408,621
179,122
255,652
268,266
530,302
173,219
232,34
192,501
183,531
350,53
328,007
290,481
379,511
377,958
400,172
217,748
295,181
211,378
316,197
379,669
258,469
240,495
284,281
187,215
280,35
370,187
531,922
191,488
134,172
190,977
260,172
206,12
215,08
290,83
309,294
382,906
258,801
349,659
271,266
299,364
413,597
257,665
254,641
188,567
287,861
228,466
246,064
149,793
507,767
247,852
183,211
2066,436
231,218
392,645
249,121
221,141
250,407
75,519
308,224
224,196
276,864
190,497
237,699
262,694
260,526
172,548
225,083
766,972
269,769
129,247
204,574
248,89
218,497
276,094
186,915
320,408
225,897
284,475
209,491
185,969
259,326
220,919
250,521
271,423
497,847
200,453
315,686
214,901
231,418
223,284
267,548
464,313
266,963
191,439
188,014
271,659
265,295
277,424
195,734
4964,628
165,909
227,169
207,74
285,945
325,672
205,476
256,9
219,281
187,339
207,837
192,052
272,044
256,234
102,331
Dataseries Y:
15,34
24,164
17,038
14,91
23,744
13,87
14,931
12,594
16,616
20,545
17,471
16,896
13,838
8,925
13,148
13,943
16,35
10,29
14,06
80,415
19,579
15,117
13,998
20,441
15,822
19,506
20,781
29,42
16,055
24,878
41,172
17,072
17,83
19,282
20,233
18,766
22,029
304,004
30,275
18,185
16,406
12,776
11,845
14,661
21,061
17,206
11,501
17,741
17,276
40,198
15,25
14,127
29,77
16,781
44,172
19,75
22,806
18,983
56,465
11,375
20,045
20,876
15,952
15,253
34,067
31,238
27,412
23,828
15,829
24,081
33,328
35,75
25,047
12,203
18,803
15,942
21,309
23,886
22,061
20,723
15,029
19,707
12,928
17,163
15,753
18,303
35,821
16,61
15,232
15,819
15,008
17,921
14,248
13,789
21,033
19,363
35,832
18,316
18,284
13,12
15,094
16,241
14,742
36,378
19,566
15,272
15,343
16,533
13,447
16,603
10,718
13,351
305,45
16,068
15,088
20,528
18,828
14,005
18,032
12,964
29,277
10,908
16,47
14,473
13,604
19,186
25,847
30,249
23,725
304,038
15,984
16,152
18,029
12,933
17,922
17,477
32,225
14,375
15,79
13,088
36,608
21,043
13,384
23,969
102,863
18,508
15,889
15,065
12,534
17,703
14,857
23,793
34,532
11,392
14,916
14,579
25,62
14,94
13,322


Summary of computational transaction
Raw Inputview raw input (R code)
Raw Outputview raw output of R engine
Computing time4 seconds
R Server'George Udny Yule' @ 72.249.76.132

\begin{tabular}{lllllllll}
\hline
Summary of computational transaction \tabularnewline
Raw Input & view raw input (R code)  \tabularnewline
Raw Output & view raw output of R engine  \tabularnewline
Computing time & 4 seconds \tabularnewline
R Server & 'George Udny Yule' @ 72.249.76.132 \tabularnewline
\hline
\end{tabular}
%Source: https://freestatistics.org/blog/index.php?pk=94529&T=0

[TABLE]
[ROW][C]Summary of computational transaction[/C][/ROW]
[ROW][C]Raw Input[/C][C]view raw input (R code) [/C][/ROW]
[ROW][C]Raw Output[/C][C]view raw output of R engine [/C][/ROW]
[ROW][C]Computing time[/C][C]4 seconds[/C][/ROW]
[ROW][C]R Server[/C][C]'George Udny Yule' @ 72.249.76.132[/C][/ROW]
[/TABLE]
Source: https://freestatistics.org/blog/index.php?pk=94529&T=0

Globally Unique Identifier (entire table): ba.freestatistics.org/blog/index.php?pk=94529&T=0

As an alternative you can also use a QR Code:  

The GUIDs for individual cells are displayed in the table below:

Summary of computational transaction
Raw Inputview raw input (R code)
Raw Outputview raw output of R engine
Computing time4 seconds
R Server'George Udny Yule' @ 72.249.76.132


Simple Linear Regression
StatisticsEstimateS.D.T-STAT (H0: coeff=0)P-value (two-sided)
constant term17.46571594208703.858459242774344.526603714888181.17808148392129e-05
slope0.02624678931948010.007456472109246723.520001005157870.000564938637743317

\begin{tabular}{lllllllll}
\hline
Simple Linear Regression \tabularnewline
Statistics & Estimate & S.D. & T-STAT (H0: coeff=0) & P-value (two-sided) \tabularnewline
constant term & 17.4657159420870 & 3.85845924277434 & 4.52660371488818 & 1.17808148392129e-05 \tabularnewline
slope & 0.0262467893194801 & 0.00745647210924672 & 3.52000100515787 & 0.000564938637743317 \tabularnewline
\hline
\end{tabular}
%Source: https://freestatistics.org/blog/index.php?pk=94529&T=1

[TABLE]
[ROW][C]Simple Linear Regression[/C][/ROW]
[ROW][C]Statistics[/C][C]Estimate[/C][C]S.D.[/C][C]T-STAT (H0: coeff=0)[/C][C]P-value (two-sided)[/C][/ROW]
[ROW][C]constant term[/C][C]17.4657159420870[/C][C]3.85845924277434[/C][C]4.52660371488818[/C][C]1.17808148392129e-05[/C][/ROW]
[ROW][C]slope[/C][C]0.0262467893194801[/C][C]0.00745647210924672[/C][C]3.52000100515787[/C][C]0.000564938637743317[/C][/ROW]
[/TABLE]
Source: https://freestatistics.org/blog/index.php?pk=94529&T=1

Globally Unique Identifier (entire table): ba.freestatistics.org/blog/index.php?pk=94529&T=1

As an alternative you can also use a QR Code:  

The GUIDs for individual cells are displayed in the table below:

Simple Linear Regression
StatisticsEstimateS.D.T-STAT (H0: coeff=0)P-value (two-sided)
constant term17.46571594208703.858459242774344.526603714888181.17808148392129e-05
slope0.02624678931948010.007456472109246723.520001005157870.000564938637743317


Parameters (Session):
par1 = 0 ;
Parameters (R input):
par1 = 0 ;
R code (references can be found in the software module):
par1 <- as.numeric(par1)
library(lattice)
z <- as.data.frame(cbind(x,y))
m <- lm(y~x)
summary(m)
bitmap(file='test1.png')
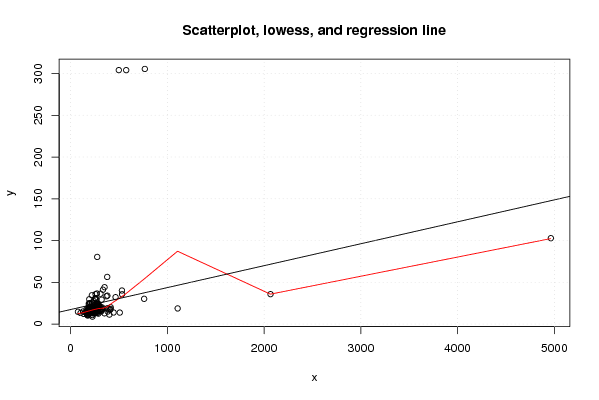
plot(z,main='Scatterplot, lowess, and regression line')
lines(lowess(z),col='red')
abline(m)
grid()
dev.off()
bitmap(file='test2.png')
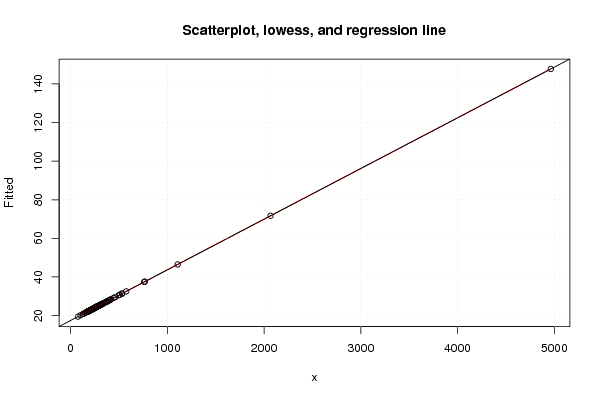
m2 <- lm(m$fitted.values ~ x)
summary(m2)
z2 <- as.data.frame(cbind(x,m$fitted.values))
names(z2) <- list('x','Fitted')
plot(z2,main='Scatterplot, lowess, and regression line')
lines(lowess(z2),col='red')
abline(m2)
grid()
dev.off()
bitmap(file='test3.png')
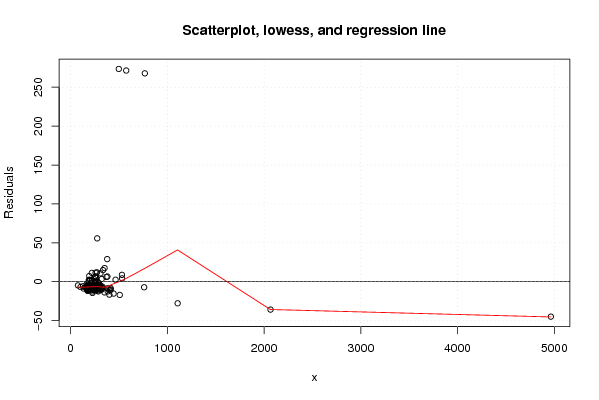
m3 <- lm(m$residuals ~ x)
summary(m3)
z3 <- as.data.frame(cbind(x,m$residuals))
names(z3) <- list('x','Residuals')
plot(z3,main='Scatterplot, lowess, and regression line')
lines(lowess(z3),col='red')
abline(m3)
grid()
dev.off()
bitmap(file='test4.png')
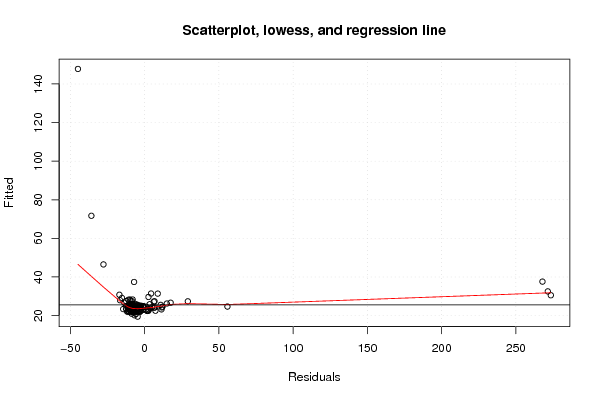
m4 <- lm(m$fitted.values ~ m$residuals)
summary(m4)
z4 <- as.data.frame(cbind(m$residuals,m$fitted.values))
names(z4) <- list('Residuals','Fitted')
plot(z4,main='Scatterplot, lowess, and regression line')
lines(lowess(z4),col='red')
abline(m4)
grid()
dev.off()
bitmap(file='test5.png')
myr <- as.ts(m$residuals)
z5 <- as.data.frame(cbind(lag(myr,1),myr))
names(z5) <- list('Lagged Residuals','Residuals')
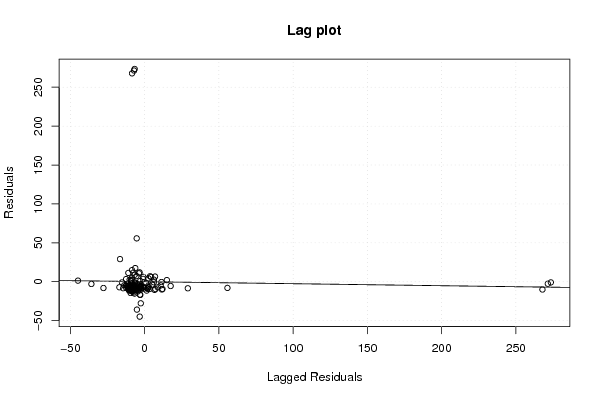
plot(z5,main='Lag plot')
m5 <- lm(z5)
summary(m5)
abline(m5)
grid()
dev.off()
bitmap(file='test6.png')
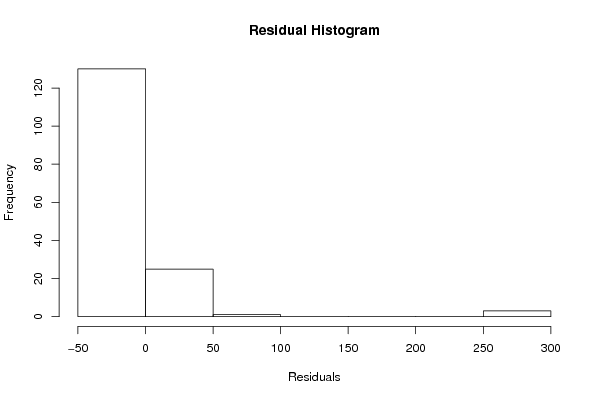
hist(m$residuals,main='Residual Histogram',xlab='Residuals')
dev.off()
bitmap(file='test7.png')
if (par1 > 0)
{
densityplot(~m$residuals,col='black',main=paste('Density Plot bw = ',par1),bw=par1)
} else {
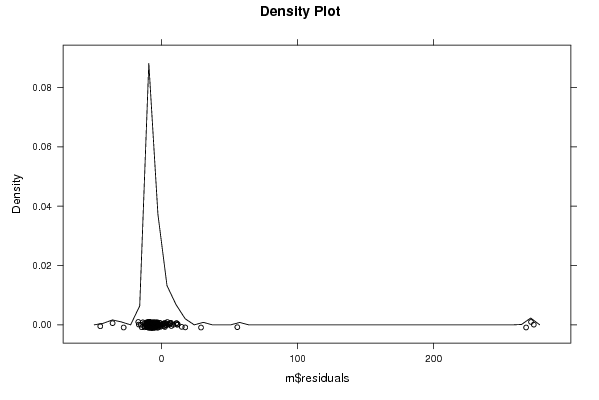
densityplot(~m$residuals,col='black',main='Density Plot')
}
dev.off()
bitmap(file='test8.png')
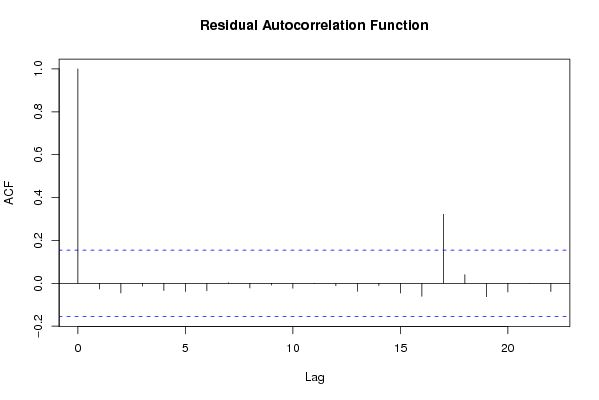
acf(m$residuals,main='Residual Autocorrelation Function')
dev.off()
bitmap(file='test9.png')
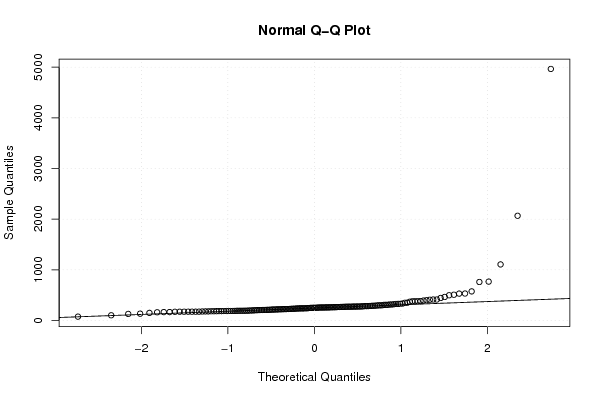
qqnorm(x)
qqline(x)
grid()
dev.off()
load(file='createtable')
a<-table.start()
a<-table.row.start(a)
a<-table.element(a,'Simple Linear Regression',5,TRUE)
a<-table.row.end(a)
a<-table.row.start(a)
a<-table.element(a,'Statistics',1,TRUE)
a<-table.element(a,'Estimate',1,TRUE)
a<-table.element(a,'S.D.',1,TRUE)
a<-table.element(a,'T-STAT (H0: coeff=0)',1,TRUE)
a<-table.element(a,'P-value (two-sided)',1,TRUE)
a<-table.row.end(a)
a<-table.row.start(a)
a<-table.element(a,'constant term',header=TRUE)
a<-table.element(a,m$coefficients[[1]])
sd <- sqrt(vcov(m)[1,1])
a<-table.element(a,sd)
tstat <- m$coefficients[[1]]/sd
a<-table.element(a,tstat)
pval <- 2*(1-pt(abs(tstat),length(x)-2))
a<-table.element(a,pval)
a<-table.row.end(a)
a<-table.row.start(a)
a<-table.element(a,'slope',header=TRUE)
a<-table.element(a,m$coefficients[[2]])
sd <- sqrt(vcov(m)[2,2])
a<-table.element(a,sd)
tstat <- m$coefficients[[2]]/sd
a<-table.element(a,tstat)
pval <- 2*(1-pt(abs(tstat),length(x)-2))
a<-table.element(a,pval)
a<-table.row.end(a)
a<-table.end(a)
table.save(a,file='mytable.tab')