| Tabulation of Results | ||
| Score x Construct | ||
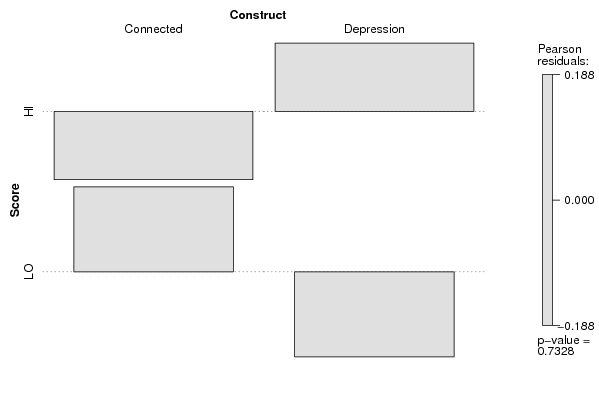
| Connected | Depression | HI | 97 | 100 | LO | 65 | 62 |
| Tabulation of Expected Results | ||
| Score x Construct | ||
| Connected | Depression | HI | 98.5 | 98.5 | LO | 63.5 | 63.5 |
| Statistical Results | |
| Pearson's Chi-squared test with Yates' continuity correction | |
| Chi Square Statistic | 0.05 |
| Degrees of Freedom | 1 |
| P value | 0.82 |