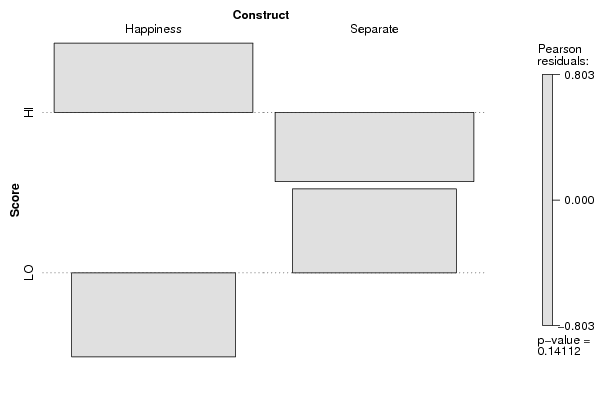
| Tabulation of Results | ||
| Score x Construct | ||
| Happiness | Separate | HI | 103 | 90 | LO | 59 | 72 |
| Tabulation of Expected Results | ||
| Score x Construct | ||
| Happiness | Separate | HI | 96.5 | 96.5 | LO | 65.5 | 65.5 |
| Statistical Results | |
| Pearson's Chi-squared test with Yates' continuity correction | |
| Chi Square Statistic | 1.85 |
| Degrees of Freedom | 1 |
| P value | 0.17 |