Free Statistics

of Irreproducible Research!

Author's title

Author*Unverified author*
R Software Modulerwasp_regression_trees.wasp
Title produced by softwareRecursive Partitioning (Regression Trees)
Date of computationWed, 26 May 2010 11:36:13 +0000
Cite this page as followsStatistical Computations at FreeStatistics.org, Office for Research Development and Education, URL https://freestatistics.org/blog/index.php?v=date/2010/May/26/t1274873818d0idhxq5v2gehel.htm/, Retrieved Fri, 03 May 2024 09:22:52 +0000
Statistical Computations at FreeStatistics.org, Office for Research Development and Education, URL https://freestatistics.org/blog/index.php?pk=76462, Retrieved Fri, 03 May 2024 09:22:52 +0000
QR Codes:

Original text written by user:
IsPrivate?No (this computation is public)
User-defined keywordsB611,regression tree,steven,coomans,thesis,per2maand
Estimated Impact128
Family? (F = Feedback message, R = changed R code, M = changed R Module, P = changed Parameters, D = changed Data)
-       [Recursive Partitioning (Regression Trees)] [B611,regression t...] [2010-05-26 11:36:13] [d41d8cd98f00b204e9800998ecf8427e] [Current]
Feedback Forum

Post a new message
Dataseries X:
22.325	NA	22.6302772146684	34.004660000026	76,15
94.125	22.325	93.756538256208	34.004660000026	100,8
12.275	29.505	12.4174361918487	34.004660000026	24
7.125	27.782	7.957394580737	34.004660000026	1,875
18.925	25.7163	18.5967972646909	34.004660000026	2,15
38.025	25.03717	37.6891879612587	34.004660000026	75,775
28.138	26.335953	28.3831854617570	34.004660000026	63,4
2.386	26.5161577	3.268311761931	34.004660000026	0
13.225	24.10314193	13.4256098558079	34.004660000026	10,5
26.25	23.015327737	25.9613378599121	34.004660000026	26,25
31.975	23.3387949633	31.677913672259	34.004660000026	53,65
31.275	24.20241546697	30.9670977340054	34.004660000026	27,55
34.4875	24.909673920273	34.1052947012212	34.004660000026	30,3
52.1375	25.8674565282457	52.3157623512095	34.004660000026	51,5
15.675	28.4944608754211	15.3162678731622	34.004660000026	73
48.9	27.2125147878790	48.638206172574	34.004660000026	24,75
16.5	29.3812633090911	16.5588725982834	34.004660000026	34,4
37	28.093136978182	36.8388933781173	34.004660000026	34
54.125	28.9838232803638	53.7729755226329	34.004660000026	71,65
34.4875	31.4979409523274	34.1226326563131	34.004660000026	69,25
44.4875	31.7968968570947	43.9518330273531	34.004660000026	39,875
40.2	33.0659571713852	40.2574947399717	34.004660000026	56,375
52.13	33.7793614542467	52.0305427112002	34.004660000026	17,25
49.575	35.614425308822	49.4446735915632	34.004660000026	69,5
44.3625	37.0104827779398	44.3510798393309	34.004660000026	68,875


Summary of computational transaction
Raw Inputview raw input (R code)
Raw Outputview raw output of R engine
Computing time2 seconds
R Server'George Udny Yule' @ 72.249.76.132
R Framework error message
Warning: there are blank lines in the 'Data X' field.
Please, use NA for missing data - blank lines are simply
 deleted and are NOT treated as missing values.

\begin{tabular}{lllllllll}
\hline
Summary of computational transaction \tabularnewline
Raw Input & view raw input (R code)  \tabularnewline
Raw Output & view raw output of R engine  \tabularnewline
Computing time & 2 seconds \tabularnewline
R Server & 'George Udny Yule' @ 72.249.76.132 \tabularnewline
R Framework error message & 
Warning: there are blank lines in the 'Data X' field.
Please, use NA for missing data - blank lines are simply
 deleted and are NOT treated as missing values.
\tabularnewline \hline \end{tabular} %Source: https://freestatistics.org/blog/index.php?pk=76462&T=0

[TABLE]
[ROW][C]Summary of computational transaction[/C][/ROW]
[ROW][C]Raw Input[/C][C]view raw input (R code) [/C][/ROW]
[ROW][C]Raw Output[/C][C]view raw output of R engine [/C][/ROW]
[ROW][C]Computing time[/C][C]2 seconds[/C][/ROW]
[ROW][C]R Server[/C][C]'George Udny Yule' @ 72.249.76.132[/C][/ROW]
[ROW][C]R Framework error message[/C][C]
Warning: there are blank lines in the 'Data X' field.
Please, use NA for missing data - blank lines are simply
 deleted and are NOT treated as missing values.
[/C][/ROW] [/TABLE] Source: https://freestatistics.org/blog/index.php?pk=76462&T=0

Globally Unique Identifier (entire table): ba.freestatistics.org/blog/index.php?pk=76462&T=0

As an alternative you can also use a QR Code:  

The GUIDs for individual cells are displayed in the table below:

Summary of computational transaction
Raw Inputview raw input (R code)
Raw Outputview raw output of R engine
Computing time2 seconds
R Server'George Udny Yule' @ 72.249.76.132
R Framework error message
Warning: there are blank lines in the 'Data X' field.
Please, use NA for missing data - blank lines are simply
 deleted and are NOT treated as missing values.


Model Performance
#Complexitysplitrelative errorCV errorCV S.D.
10.581011.0870.414
20.0110.4190.5670.275

\begin{tabular}{lllllllll}
\hline
Model Performance \tabularnewline
# & Complexity & split & relative error & CV error & CV S.D. \tabularnewline
1 & 0.581 & 0 & 1 & 1.087 & 0.414 \tabularnewline
2 & 0.01 & 1 & 0.419 & 0.567 & 0.275 \tabularnewline
\hline
\end{tabular}
%Source: https://freestatistics.org/blog/index.php?pk=76462&T=1

[TABLE]
[ROW][C]Model Performance[/C][/ROW]
[ROW][C]#[/C][C]Complexity[/C][C]split[/C][C]relative error[/C][C]CV error[/C][C]CV S.D.[/C][/ROW]
[ROW][C]1[/C][C]0.581[/C][C]0[/C][C]1[/C][C]1.087[/C][C]0.414[/C][/ROW]
[ROW][C]2[/C][C]0.01[/C][C]1[/C][C]0.419[/C][C]0.567[/C][C]0.275[/C][/ROW]
[/TABLE]
Source: https://freestatistics.org/blog/index.php?pk=76462&T=1

Globally Unique Identifier (entire table): ba.freestatistics.org/blog/index.php?pk=76462&T=1

As an alternative you can also use a QR Code:  

The GUIDs for individual cells are displayed in the table below:

Model Performance
#Complexitysplitrelative errorCV errorCV S.D.
10.581011.0870.414
20.0110.4190.5670.275


Parameters (Session):
par1 = 1 ; par2 = No ;
Parameters (R input):
par1 = 1 ; par2 = No ;
R code (references can be found in the software module):
library(rpart)
library(partykit)
par1 <- as.numeric(par1)
autoprune <- function ( tree, method='Minimum CV'){
xerr <- tree$cptable[,'xerror']
cpmin.id <- which.min(xerr)
if (method == 'Minimum CV Error plus 1 SD'){
xstd <- tree$cptable[,'xstd']
errt <- xerr[cpmin.id] + xstd[cpmin.id]
cpSE1.min <- which.min( errt < xerr )
mycp <- (tree$cptable[,'CP'])[cpSE1.min]
}
if (method == 'Minimum CV') {
mycp <- (tree$cptable[,'CP'])[cpmin.id]
}
return (mycp)
}
conf.multi.mat <- function(true, new)
{
if ( all( is.na(match( levels(true),levels(new) ) )) )
stop ( 'conflict of vector levels')
multi.t <- list()
for (mylev in levels(true) ) {
true.tmp <- true
new.tmp <- new
left.lev <- levels (true.tmp)[- match(mylev,levels(true) ) ]
levels(true.tmp) <- list ( mylev = mylev, all = left.lev )
levels(new.tmp) <- list ( mylev = mylev, all = left.lev )
curr.t <- conf.mat ( true.tmp , new.tmp )
multi.t[[mylev]] <- curr.t
multi.t[[mylev]]$precision <-
round( curr.t$conf[1,1] / sum( curr.t$conf[1,] ), 2 )
}
return (multi.t)
}
x <- t(y)
k <- length(x[1,])
n <- length(x[,1])
x1 <- cbind(x[,par1], x[,1:k!=par1])
mycolnames <- c(colnames(x)[par1], colnames(x)[1:k!=par1])
colnames(x1) <- mycolnames #colnames(x)[par1]
m <- rpart(as.data.frame(x1))
par2
if (par2 != 'No') {
mincp <- autoprune(m,method=par2)
print(mincp)
m <- prune(m,cp=mincp)
}
m$cptable
bitmap(file='test1.png')
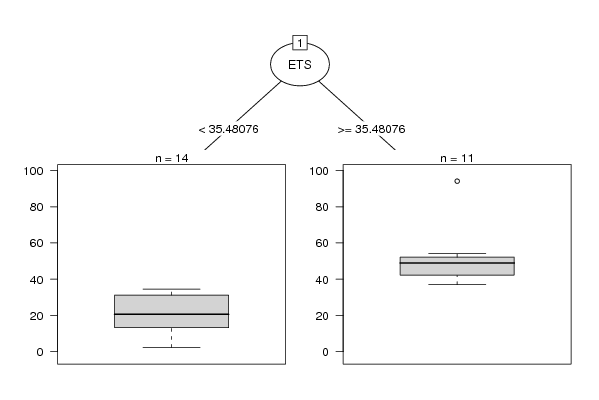
plot(as.party(m),tp_args=list(id=FALSE))
dev.off()
bitmap(file='test2.png')
plotcp(m)
dev.off()
cbind(y=m$y,pred=predict(m),res=residuals(m))
myr <- residuals(m)
myp <- predict(m)
bitmap(file='test4.png')
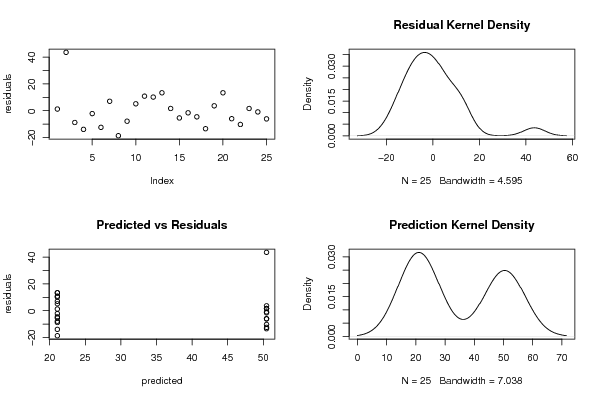
op <- par(mfrow=c(2,2))
plot(myr,ylab='residuals')
plot(density(myr),main='Residual Kernel Density')
plot(myp,myr,xlab='predicted',ylab='residuals',main='Predicted vs Residuals')
plot(density(myp),main='Prediction Kernel Density')
par(op)
dev.off()
load(file='createtable')
a<-table.start()
a<-table.row.start(a)
a<-table.element(a,'Model Performance',6,TRUE)
a<-table.row.end(a)
a<-table.row.start(a)
a<-table.element(a,'#',header=TRUE)
a<-table.element(a,'Complexity',header=TRUE)
a<-table.element(a,'split',header=TRUE)
a<-table.element(a,'relative error',header=TRUE)
a<-table.element(a,'CV error',header=TRUE)
a<-table.element(a,'CV S.D.',header=TRUE)
a<-table.row.end(a)
for (i in 1:length(m$cptable[,1])) {
a<-table.row.start(a)
a<-table.element(a,i,header=TRUE)
a<-table.element(a,round(m$cptable[i,'CP'],3))
a<-table.element(a,m$cptable[i,'nsplit'])
a<-table.element(a,round(m$cptable[i,'rel error'],3))
a<-table.element(a,round(m$cptable[i,'xerror'],3))
a<-table.element(a,round(m$cptable[i,'xstd'],3))
a<-table.row.end(a)
}
a<-table.end(a)
table.save(a,file='mytable.tab')