Free Statistics

of Irreproducible Research!

Author's title

Author*Unverified author*
R Software Modulerwasp_regression_trees.wasp
Title produced by softwareRecursive Partitioning (Regression Trees)
Date of computationWed, 26 May 2010 10:54:54 +0000
Cite this page as followsStatistical Computations at FreeStatistics.org, Office for Research Development and Education, URL https://freestatistics.org/blog/index.php?v=date/2010/May/26/t1274871352f8rik8ythou3ogg.htm/, Retrieved Fri, 03 May 2024 10:54:40 +0000
Statistical Computations at FreeStatistics.org, Office for Research Development and Education, URL https://freestatistics.org/blog/index.php?pk=76451, Retrieved Fri, 03 May 2024 10:54:40 +0000
QR Codes:

Original text written by user:
IsPrivate?No (this computation is public)
User-defined keywordsFM50,regression tree,steven,coomans,thesis,per maand
Estimated Impact164
Family? (F = Feedback message, R = changed R code, M = changed R Module, P = changed Parameters, D = changed Data)
-       [Recursive Partitioning (Regression Trees)] [FM50,regression t...] [2010-05-26 10:54:54] [d41d8cd98f00b204e9800998ecf8427e] [Current]
Feedback Forum

Post a new message
Dataseries X:
1216.67	NA	1216.57896906222	1544.42911895378	1122
1186.17	1216.67	1186.32706637457	1366.3834494132	1191,3
1217.475	1213.62	1217.61518741362	1394.74447514204	1849,75
1096.95	1214.0055	1097.13722496335	1435.70978225614	1159,8
1685.6	1202.29995	1685.35698835458	1515.17300887526	1441,8
1758.5	1250.629955	1758.44429928912	1913.84222078324	1577,3
1786.6	1301.4169595	1786.57095582242	1957.10781265414	1537,8
2049.895	1349.93526355	2049.71036034501	2003.16986500382	1732,3
1845.895	1419.931237195	1845.92826649821	2094.36317239399	1932,3
2015.02	1462.5276134755	2014.98176910371	1946.73777811992	1781,5
1609.63	1517.77685212795	1609.54241047328	1915.17835198758	1504
918.725	1526.96216691516	918.654492873966	1514.01237467182	1155,75
1240.96	1466.13845022364	1240.97493327842	1137.92569933516	1243,5
1671.785	1443.62060520128	1671.67364264948	1425.79213659270	1479,5
2451.83	1466.43704468115	2451.42825634976	1747.14542398917	NA
1886.14	1564.97634021303	1886.27704742758	2134.15076490796	2076
2110.66	1597.09270619173	2110.72659138529	1997.1087832377	842,5
1856.87	1648.44943557256	1857.08748894488	1923.93219142466	2231,5
1775.765	1669.29149201530	1775.92924079464	1716.64848512266	1909,3
1569.625	1679.93884281377	1569.80044248696	1805.52638387444	1759,75
1835.69	1668.90745853239	1835.63172097274	1484.35743354946	1932,5
2041.46	1685.58571267915	2041.35676313207	1879.55614969438	2071,3
1667.035	1721.17314141124	1666.89228111939	1735.86760859793	1918
948.25	1715.75932727012	948.159567965853	1248.06282806837	1358
1365.66	1639.00839454310	1365.60094114980	1208.49264795729	1475,3
1681.025	1611.67355508879	1680.97488911353	1648.62405416901	1457,5
1661.9	1618.60869957991	1661.97891553469	2137.48151321946	1646,5
2194.88	1622.93782962192	2194.64696222739	1538.92416659111	1904,3
2051.025	1680.13204665973	2051.10610598749	2262.95786264119	1983,5
2365.845	1717.22134199376	2365.8268033643	1895.75731478471	2150 
2398.5	1782.08370779438	2398.49010356152	2133.06714654175	2045 
2181.85	1843.72533701494	2181.91895239553	2005.89702658791	2455 
2626.77	1877.53780331345	2626.61215634528	2019.35823239364	2597 
2529.72	1952.46102298210	2529.72574330652	2287.02645105581	2532 
1700.3	2010.18692068389	1700.40313375847	1877.51131114692	2515 
605.38	1979.19822861550	605.770298247161	1044.00598415714	1445 
1200.495	1841.81640575395	1200.41697572286	856.884940781561	1491 
1597.02	1777.68426517856	1596.87595983126	1388.94763408102	1462 
1174.955	1759.61783866070	1175.24282736234	1582.51626983244	1690 
1612.88	1701.15155479463	1612.75933399255	1625.07070253864	1646 
1683.55	1692.32439931517	1683.56473508225	1708.99836048230	1422 
2260.955	1691.44695938365	2260.72911247337	2015.60437152167	407 
2455.335	1748.39776344529	2455.16084014401	2312.82789083737	2135 
2365.62	1819.09148710076	2365.56505712385	2274.66272273801	2069 
2417.755	1873.74433839068	2417.71252994142	2485.27099441534	2234 
2308.785	1928.14540455161	2308.84414672757	2262.79978259441	2500 
1629.94	1966.20936409645	1630.02245147924	1758.7604073078	2059 
1053.275	1932.58242768681	1053.15585122134	1007.45449610215	1117 
1330.235	1844.65168491813	1330.29555655607	1365.70594512373	1634 
1543.85	1793.21001642631	1543.91407603040	1566.13002581225	1600 


Summary of computational transaction
Raw Inputview raw input (R code)
Raw Outputview raw output of R engine
Computing time2 seconds
R Server'RServer@AstonUniversity' @ vre.aston.ac.uk

\begin{tabular}{lllllllll}
\hline
Summary of computational transaction \tabularnewline
Raw Input & view raw input (R code)  \tabularnewline
Raw Output & view raw output of R engine  \tabularnewline
Computing time & 2 seconds \tabularnewline
R Server & 'RServer@AstonUniversity' @ vre.aston.ac.uk \tabularnewline
\hline
\end{tabular}
%Source: https://freestatistics.org/blog/index.php?pk=76451&T=0

[TABLE]
[ROW][C]Summary of computational transaction[/C][/ROW]
[ROW][C]Raw Input[/C][C]view raw input (R code) [/C][/ROW]
[ROW][C]Raw Output[/C][C]view raw output of R engine [/C][/ROW]
[ROW][C]Computing time[/C][C]2 seconds[/C][/ROW]
[ROW][C]R Server[/C][C]'RServer@AstonUniversity' @ vre.aston.ac.uk[/C][/ROW]
[/TABLE]
Source: https://freestatistics.org/blog/index.php?pk=76451&T=0

Globally Unique Identifier (entire table): ba.freestatistics.org/blog/index.php?pk=76451&T=0

As an alternative you can also use a QR Code:  

The GUIDs for individual cells are displayed in the table below:

Summary of computational transaction
Raw Inputview raw input (R code)
Raw Outputview raw output of R engine
Computing time2 seconds
R Server'RServer@AstonUniversity' @ vre.aston.ac.uk


Model Performance
#Complexitysplitrelative errorCV errorCV S.D.
10.659011.0210.167
20.18810.3410.4380.081
30.07920.1530.1760.037
40.0130.0740.1740.038

\begin{tabular}{lllllllll}
\hline
Model Performance \tabularnewline
# & Complexity & split & relative error & CV error & CV S.D. \tabularnewline
1 & 0.659 & 0 & 1 & 1.021 & 0.167 \tabularnewline
2 & 0.188 & 1 & 0.341 & 0.438 & 0.081 \tabularnewline
3 & 0.079 & 2 & 0.153 & 0.176 & 0.037 \tabularnewline
4 & 0.01 & 3 & 0.074 & 0.174 & 0.038 \tabularnewline
\hline
\end{tabular}
%Source: https://freestatistics.org/blog/index.php?pk=76451&T=1

[TABLE]
[ROW][C]Model Performance[/C][/ROW]
[ROW][C]#[/C][C]Complexity[/C][C]split[/C][C]relative error[/C][C]CV error[/C][C]CV S.D.[/C][/ROW]
[ROW][C]1[/C][C]0.659[/C][C]0[/C][C]1[/C][C]1.021[/C][C]0.167[/C][/ROW]
[ROW][C]2[/C][C]0.188[/C][C]1[/C][C]0.341[/C][C]0.438[/C][C]0.081[/C][/ROW]
[ROW][C]3[/C][C]0.079[/C][C]2[/C][C]0.153[/C][C]0.176[/C][C]0.037[/C][/ROW]
[ROW][C]4[/C][C]0.01[/C][C]3[/C][C]0.074[/C][C]0.174[/C][C]0.038[/C][/ROW]
[/TABLE]
Source: https://freestatistics.org/blog/index.php?pk=76451&T=1

Globally Unique Identifier (entire table): ba.freestatistics.org/blog/index.php?pk=76451&T=1

As an alternative you can also use a QR Code:  

The GUIDs for individual cells are displayed in the table below:

Model Performance
#Complexitysplitrelative errorCV errorCV S.D.
10.659011.0210.167
20.18810.3410.4380.081
30.07920.1530.1760.037
40.0130.0740.1740.038


Parameters (Session):
par1 = 1 ; par2 = No ;
Parameters (R input):
par1 = 1 ; par2 = No ;
R code (references can be found in the software module):
library(rpart)
library(partykit)
par1 <- as.numeric(par1)
autoprune <- function ( tree, method='Minimum CV'){
xerr <- tree$cptable[,'xerror']
cpmin.id <- which.min(xerr)
if (method == 'Minimum CV Error plus 1 SD'){
xstd <- tree$cptable[,'xstd']
errt <- xerr[cpmin.id] + xstd[cpmin.id]
cpSE1.min <- which.min( errt < xerr )
mycp <- (tree$cptable[,'CP'])[cpSE1.min]
}
if (method == 'Minimum CV') {
mycp <- (tree$cptable[,'CP'])[cpmin.id]
}
return (mycp)
}
conf.multi.mat <- function(true, new)
{
if ( all( is.na(match( levels(true),levels(new) ) )) )
stop ( 'conflict of vector levels')
multi.t <- list()
for (mylev in levels(true) ) {
true.tmp <- true
new.tmp <- new
left.lev <- levels (true.tmp)[- match(mylev,levels(true) ) ]
levels(true.tmp) <- list ( mylev = mylev, all = left.lev )
levels(new.tmp) <- list ( mylev = mylev, all = left.lev )
curr.t <- conf.mat ( true.tmp , new.tmp )
multi.t[[mylev]] <- curr.t
multi.t[[mylev]]$precision <-
round( curr.t$conf[1,1] / sum( curr.t$conf[1,] ), 2 )
}
return (multi.t)
}
x <- t(y)
k <- length(x[1,])
n <- length(x[,1])
x1 <- cbind(x[,par1], x[,1:k!=par1])
mycolnames <- c(colnames(x)[par1], colnames(x)[1:k!=par1])
colnames(x1) <- mycolnames #colnames(x)[par1]
m <- rpart(as.data.frame(x1))
par2
if (par2 != 'No') {
mincp <- autoprune(m,method=par2)
print(mincp)
m <- prune(m,cp=mincp)
}
m$cptable
bitmap(file='test1.png')
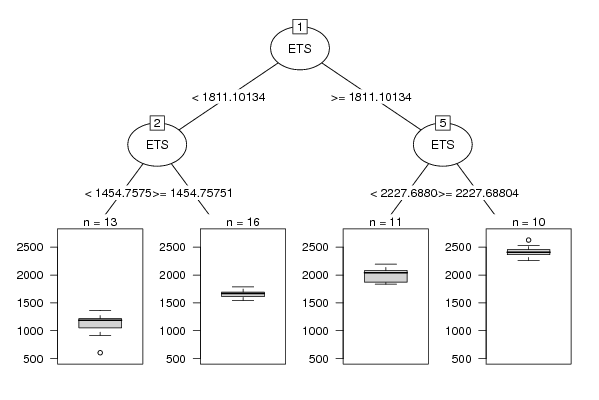
plot(as.party(m),tp_args=list(id=FALSE))
dev.off()
bitmap(file='test2.png')
plotcp(m)
dev.off()
cbind(y=m$y,pred=predict(m),res=residuals(m))
myr <- residuals(m)
myp <- predict(m)
bitmap(file='test4.png')
op <- par(mfrow=c(2,2))
plot(myr,ylab='residuals')
plot(density(myr),main='Residual Kernel Density')
plot(myp,myr,xlab='predicted',ylab='residuals',main='Predicted vs Residuals')
plot(density(myp),main='Prediction Kernel Density')
par(op)
dev.off()
load(file='createtable')
a<-table.start()
a<-table.row.start(a)
a<-table.element(a,'Model Performance',6,TRUE)
a<-table.row.end(a)
a<-table.row.start(a)
a<-table.element(a,'#',header=TRUE)
a<-table.element(a,'Complexity',header=TRUE)
a<-table.element(a,'split',header=TRUE)
a<-table.element(a,'relative error',header=TRUE)
a<-table.element(a,'CV error',header=TRUE)
a<-table.element(a,'CV S.D.',header=TRUE)
a<-table.row.end(a)
for (i in 1:length(m$cptable[,1])) {
a<-table.row.start(a)
a<-table.element(a,i,header=TRUE)
a<-table.element(a,round(m$cptable[i,'CP'],3))
a<-table.element(a,m$cptable[i,'nsplit'])
a<-table.element(a,round(m$cptable[i,'rel error'],3))
a<-table.element(a,round(m$cptable[i,'xerror'],3))
a<-table.element(a,round(m$cptable[i,'xstd'],3))
a<-table.row.end(a)
}
a<-table.end(a)
table.save(a,file='mytable.tab')