Free Statistics

of Irreproducible Research!

Author's title

Author*Unverified author*
R Software Modulerwasp_smp.wasp
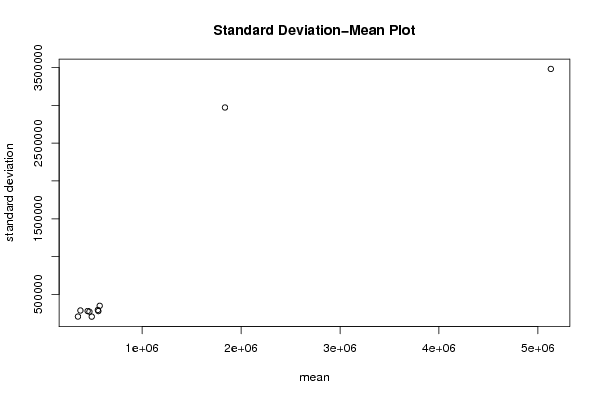
Title produced by softwareStandard Deviation-Mean Plot
Date of computationFri, 21 May 2010 15:10:31 +0000
Cite this page as followsStatistical Computations at FreeStatistics.org, Office for Research Development and Education, URL https://freestatistics.org/blog/index.php?v=date/2010/May/21/t1274454707m1j3rqcs4r577y8.htm/, Retrieved Thu, 02 May 2024 18:29:50 +0000
Statistical Computations at FreeStatistics.org, Office for Research Development and Education, URL https://freestatistics.org/blog/index.php?pk=76251, Retrieved Thu, 02 May 2024 18:29:50 +0000
QR Codes:

Original text written by user:
IsPrivate?No (this computation is public)
User-defined keywordsKDGP2W83
Estimated Impact177
Family? (F = Feedback message, R = changed R code, M = changed R Module, P = changed Parameters, D = changed Data)
-       [Standard Deviation-Mean Plot] [katleen.vandenakk...] [2010-05-21 15:10:31] [8b7f9564fd63910ef0a86e3a376c4af8] [Current]
Feedback Forum

Post a new message
Dataseries X:
285708
905858
225733
405481
845758
805651
395747
695853
175625
405534
965639
575634
576023
566089
336141
26271
586226
376484
176583
287042
997142
207694
418003
838258
848182
658215
208304
398599
438399
578393
988390
958304
318251
78307
408520
748640
258520
518618
388588
238842
328957
499266
109011
168896
798921
878732
897576
518317
228370
758167
658491
518170
398212
498286
78136
647990
357927
698061
407932
637934
397784
217980
47737
467672
67651
167524
687406
367345
157553
887453
227566
817279
697059
997185
847075
547122
996977
346998
967154
547097
586853
46728
236883
36784
277085
446998
586725
496845
86765
146966
197113
657096
337200
17273
457284
507696
547628
157435
67793
267631
518397
918560
918895
429509
289569
9010172
1810617
7111400
1611919
9712714
2913310
1013816
6714518
2414721
9114534
8214993
6215159
515612
9415340
3715267


Summary of computational transaction
Raw Inputview raw input (R code)
Raw Outputview raw output of R engine
Computing time1 seconds
R Server'Sir Ronald Aylmer Fisher' @ 193.190.124.24

\begin{tabular}{lllllllll}
\hline
Summary of computational transaction \tabularnewline
Raw Input & view raw input (R code)  \tabularnewline
Raw Output & view raw output of R engine  \tabularnewline
Computing time & 1 seconds \tabularnewline
R Server & 'Sir Ronald Aylmer Fisher' @ 193.190.124.24 \tabularnewline
\hline
\end{tabular}
%Source: https://freestatistics.org/blog/index.php?pk=76251&T=0

[TABLE]
[ROW][C]Summary of computational transaction[/C][/ROW]
[ROW][C]Raw Input[/C][C]view raw input (R code) [/C][/ROW]
[ROW][C]Raw Output[/C][C]view raw output of R engine [/C][/ROW]
[ROW][C]Computing time[/C][C]1 seconds[/C][/ROW]
[ROW][C]R Server[/C][C]'Sir Ronald Aylmer Fisher' @ 193.190.124.24[/C][/ROW]
[/TABLE]
Source: https://freestatistics.org/blog/index.php?pk=76251&T=0

Globally Unique Identifier (entire table): ba.freestatistics.org/blog/index.php?pk=76251&T=0

As an alternative you can also use a QR Code:  

The GUIDs for individual cells are displayed in the table below:

Summary of computational transaction
Raw Inputview raw input (R code)
Raw Outputview raw output of R engine
Computing time1 seconds
R Server'Sir Ronald Aylmer Fisher' @ 193.190.124.24


Standard Deviation-Mean Plot
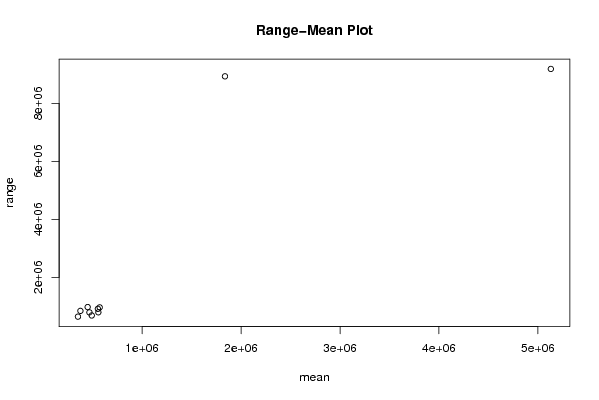
SectionMeanStandard DeviationRange
1557351.75278667.068769469790014
2449329.666666667279119.091065358970871
3552542293576.548607313910083
4467020.333333333271222.122646678788565
5490639.666666667204934.673417180680031
6375912.5286556.062956274839716
7571159.583333333348449.524479374960401
8351253.833333333206211.577946197639823
91837300.52971861.283963998942379
105130991.916666673481740.948976969197102

\begin{tabular}{lllllllll}
\hline
Standard Deviation-Mean Plot \tabularnewline
Section & Mean & Standard Deviation & Range \tabularnewline
1 & 557351.75 & 278667.068769469 & 790014 \tabularnewline
2 & 449329.666666667 & 279119.091065358 & 970871 \tabularnewline
3 & 552542 & 293576.548607313 & 910083 \tabularnewline
4 & 467020.333333333 & 271222.122646678 & 788565 \tabularnewline
5 & 490639.666666667 & 204934.673417180 & 680031 \tabularnewline
6 & 375912.5 & 286556.062956274 & 839716 \tabularnewline
7 & 571159.583333333 & 348449.524479374 & 960401 \tabularnewline
8 & 351253.833333333 & 206211.577946197 & 639823 \tabularnewline
9 & 1837300.5 & 2971861.28396399 & 8942379 \tabularnewline
10 & 5130991.91666667 & 3481740.94897696 & 9197102 \tabularnewline
\hline
\end{tabular}
%Source: https://freestatistics.org/blog/index.php?pk=76251&T=1

[TABLE]
[ROW][C]Standard Deviation-Mean Plot[/C][/ROW]
[ROW][C]Section[/C][C]Mean[/C][C]Standard Deviation[/C][C]Range[/C][/ROW]
[ROW][C]1[/C][C]557351.75[/C][C]278667.068769469[/C][C]790014[/C][/ROW]
[ROW][C]2[/C][C]449329.666666667[/C][C]279119.091065358[/C][C]970871[/C][/ROW]
[ROW][C]3[/C][C]552542[/C][C]293576.548607313[/C][C]910083[/C][/ROW]
[ROW][C]4[/C][C]467020.333333333[/C][C]271222.122646678[/C][C]788565[/C][/ROW]
[ROW][C]5[/C][C]490639.666666667[/C][C]204934.673417180[/C][C]680031[/C][/ROW]
[ROW][C]6[/C][C]375912.5[/C][C]286556.062956274[/C][C]839716[/C][/ROW]
[ROW][C]7[/C][C]571159.583333333[/C][C]348449.524479374[/C][C]960401[/C][/ROW]
[ROW][C]8[/C][C]351253.833333333[/C][C]206211.577946197[/C][C]639823[/C][/ROW]
[ROW][C]9[/C][C]1837300.5[/C][C]2971861.28396399[/C][C]8942379[/C][/ROW]
[ROW][C]10[/C][C]5130991.91666667[/C][C]3481740.94897696[/C][C]9197102[/C][/ROW]
[/TABLE]
Source: https://freestatistics.org/blog/index.php?pk=76251&T=1

Globally Unique Identifier (entire table): ba.freestatistics.org/blog/index.php?pk=76251&T=1

As an alternative you can also use a QR Code:  

The GUIDs for individual cells are displayed in the table below:

Standard Deviation-Mean Plot
SectionMeanStandard DeviationRange
1557351.75278667.068769469790014
2449329.666666667279119.091065358970871
3552542293576.548607313910083
4467020.333333333271222.122646678788565
5490639.666666667204934.673417180680031
6375912.5286556.062956274839716
7571159.583333333348449.524479374960401
8351253.833333333206211.577946197639823
91837300.52971861.283963998942379
105130991.916666673481740.948976969197102


Regression: S.E.(k) = alpha + beta * Mean(k)
alpha46984.5859097762
beta0.756015367988514
S.D.0.130702415819694
T-STAT5.78424938244024
p-value0.000412509946048805

\begin{tabular}{lllllllll}
\hline
Regression: S.E.(k) = alpha + beta * Mean(k) \tabularnewline
alpha & 46984.5859097762 \tabularnewline
beta & 0.756015367988514 \tabularnewline
S.D. & 0.130702415819694 \tabularnewline
T-STAT & 5.78424938244024 \tabularnewline
p-value & 0.000412509946048805 \tabularnewline
\hline
\end{tabular}
%Source: https://freestatistics.org/blog/index.php?pk=76251&T=2

[TABLE]
[ROW][C]Regression: S.E.(k) = alpha + beta * Mean(k)[/C][/ROW]
[ROW][C]alpha[/C][C]46984.5859097762[/C][/ROW]
[ROW][C]beta[/C][C]0.756015367988514[/C][/ROW]
[ROW][C]S.D.[/C][C]0.130702415819694[/C][/ROW]
[ROW][C]T-STAT[/C][C]5.78424938244024[/C][/ROW]
[ROW][C]p-value[/C][C]0.000412509946048805[/C][/ROW]
[/TABLE]
Source: https://freestatistics.org/blog/index.php?pk=76251&T=2

Globally Unique Identifier (entire table): ba.freestatistics.org/blog/index.php?pk=76251&T=2

As an alternative you can also use a QR Code:  

The GUIDs for individual cells are displayed in the table below:

Regression: S.E.(k) = alpha + beta * Mean(k)
alpha46984.5859097762
beta0.756015367988514
S.D.0.130702415819694
T-STAT5.78424938244024
p-value0.000412509946048805


Regression: ln S.E.(k) = alpha + beta * ln Mean(k)
alpha-3.12704437592461
beta1.19981148782277
S.D.0.13529812954441
T-STAT8.86790890504477
p-value2.06563923544080e-05
Lambda-0.199811487822775

\begin{tabular}{lllllllll}
\hline
Regression: ln S.E.(k) = alpha + beta * ln Mean(k) \tabularnewline
alpha & -3.12704437592461 \tabularnewline
beta & 1.19981148782277 \tabularnewline
S.D. & 0.13529812954441 \tabularnewline
T-STAT & 8.86790890504477 \tabularnewline
p-value & 2.06563923544080e-05 \tabularnewline
Lambda & -0.199811487822775 \tabularnewline
\hline
\end{tabular}
%Source: https://freestatistics.org/blog/index.php?pk=76251&T=3

[TABLE]
[ROW][C]Regression: ln S.E.(k) = alpha + beta * ln Mean(k)[/C][/ROW]
[ROW][C]alpha[/C][C]-3.12704437592461[/C][/ROW]
[ROW][C]beta[/C][C]1.19981148782277[/C][/ROW]
[ROW][C]S.D.[/C][C]0.13529812954441[/C][/ROW]
[ROW][C]T-STAT[/C][C]8.86790890504477[/C][/ROW]
[ROW][C]p-value[/C][C]2.06563923544080e-05[/C][/ROW]
[ROW][C]Lambda[/C][C]-0.199811487822775[/C][/ROW]
[/TABLE]
Source: https://freestatistics.org/blog/index.php?pk=76251&T=3

Globally Unique Identifier (entire table): ba.freestatistics.org/blog/index.php?pk=76251&T=3

As an alternative you can also use a QR Code:  

The GUIDs for individual cells are displayed in the table below:

Regression: ln S.E.(k) = alpha + beta * ln Mean(k)
alpha-3.12704437592461
beta1.19981148782277
S.D.0.13529812954441
T-STAT8.86790890504477
p-value2.06563923544080e-05
Lambda-0.199811487822775


Parameters (Session):
par1 = 12 ;
Parameters (R input):
par1 = 12 ;
R code (references can be found in the software module):
par1 <- as.numeric(par1)
(n <- length(x))
(np <- floor(n / par1))
arr <- array(NA,dim=c(par1,np))
j <- 0
k <- 1
for (i in 1:(np*par1))
{
j = j + 1
arr[j,k] <- x[i]
if (j == par1) {
j = 0
k=k+1
}
}
arr
arr.mean <- array(NA,dim=np)
arr.sd <- array(NA,dim=np)
arr.range <- array(NA,dim=np)
for (j in 1:np)
{
arr.mean[j] <- mean(arr[,j],na.rm=TRUE)
arr.sd[j] <- sd(arr[,j],na.rm=TRUE)
arr.range[j] <- max(arr[,j],na.rm=TRUE) - min(arr[,j],na.rm=TRUE)
}
arr.mean
arr.sd
arr.range
(lm1 <- lm(arr.sd~arr.mean))
(lnlm1 <- lm(log(arr.sd)~log(arr.mean)))
(lm2 <- lm(arr.range~arr.mean))
bitmap(file='test1.png')
plot(arr.mean,arr.sd,main='Standard Deviation-Mean Plot',xlab='mean',ylab='standard deviation')
dev.off()
bitmap(file='test2.png')
plot(arr.mean,arr.range,main='Range-Mean Plot',xlab='mean',ylab='range')
dev.off()
load(file='createtable')
a<-table.start()
a<-table.row.start(a)
a<-table.element(a,'Standard Deviation-Mean Plot',4,TRUE)
a<-table.row.end(a)
a<-table.row.start(a)
a<-table.element(a,'Section',header=TRUE)
a<-table.element(a,'Mean',header=TRUE)
a<-table.element(a,'Standard Deviation',header=TRUE)
a<-table.element(a,'Range',header=TRUE)
a<-table.row.end(a)
for (j in 1:np) {
a<-table.row.start(a)
a<-table.element(a,j,header=TRUE)
a<-table.element(a,arr.mean[j])
a<-table.element(a,arr.sd[j] )
a<-table.element(a,arr.range[j] )
a<-table.row.end(a)
}
a<-table.end(a)
table.save(a,file='mytable.tab')
a<-table.start()
a<-table.row.start(a)
a<-table.element(a,'Regression: S.E.(k) = alpha + beta * Mean(k)',2,TRUE)
a<-table.row.end(a)
a<-table.row.start(a)
a<-table.element(a,'alpha',header=TRUE)
a<-table.element(a,lm1$coefficients[[1]])
a<-table.row.end(a)
a<-table.row.start(a)
a<-table.element(a,'beta',header=TRUE)
a<-table.element(a,lm1$coefficients[[2]])
a<-table.row.end(a)
a<-table.row.start(a)
a<-table.element(a,'S.D.',header=TRUE)
a<-table.element(a,summary(lm1)$coefficients[2,2])
a<-table.row.end(a)
a<-table.row.start(a)
a<-table.element(a,'T-STAT',header=TRUE)
a<-table.element(a,summary(lm1)$coefficients[2,3])
a<-table.row.end(a)
a<-table.row.start(a)
a<-table.element(a,'p-value',header=TRUE)
a<-table.element(a,summary(lm1)$coefficients[2,4])
a<-table.row.end(a)
a<-table.end(a)
table.save(a,file='mytable1.tab')
a<-table.start()
a<-table.row.start(a)
a<-table.element(a,'Regression: ln S.E.(k) = alpha + beta * ln Mean(k)',2,TRUE)
a<-table.row.end(a)
a<-table.row.start(a)
a<-table.element(a,'alpha',header=TRUE)
a<-table.element(a,lnlm1$coefficients[[1]])
a<-table.row.end(a)
a<-table.row.start(a)
a<-table.element(a,'beta',header=TRUE)
a<-table.element(a,lnlm1$coefficients[[2]])
a<-table.row.end(a)
a<-table.row.start(a)
a<-table.element(a,'S.D.',header=TRUE)
a<-table.element(a,summary(lnlm1)$coefficients[2,2])
a<-table.row.end(a)
a<-table.row.start(a)
a<-table.element(a,'T-STAT',header=TRUE)
a<-table.element(a,summary(lnlm1)$coefficients[2,3])
a<-table.row.end(a)
a<-table.row.start(a)
a<-table.element(a,'p-value',header=TRUE)
a<-table.element(a,summary(lnlm1)$coefficients[2,4])
a<-table.row.end(a)
a<-table.row.start(a)
a<-table.element(a,'Lambda',header=TRUE)
a<-table.element(a,1-lnlm1$coefficients[[2]])
a<-table.row.end(a)
a<-table.end(a)
table.save(a,file='mytable2.tab')