Free Statistics
of Irreproducible Research!
Description of Statistical Computation | |
|---|---|
| Author's title | |
| Author | *The author of this computation has been verified* |
| R Software Module | Rscript (source code is shown below) |
| Title produced by software | R console |
| Date of computation | Thu, 20 May 2010 12:11:13 +0000 |
| Cite this page as follows | Statistical Computations at FreeStatistics.org, Office for Research Development and Education, URL https://freestatistics.org/blog/index.php?v=date/2010/May/20/t1274357474qzky2oqd2o33g80.htm/, Retrieved Wed, 01 May 2024 00:21:45 +0000 |
| Statistical Computations at FreeStatistics.org, Office for Research Development and Education, URL https://freestatistics.org/blog/index.php?pk=76223, Retrieved Wed, 01 May 2024 00:21:45 +0000 | |
| QR Codes: | |
|
| |
| Original text written by user: | This example is used in the manual files of the RC package. |
| IsPrivate? | No (this computation is public) |
| User-defined keywords | blogtest |
| Estimated Impact | 244 |
Tree of Dependent Computations | |
| Family? (F = Feedback message, R = changed R code, M = changed R Module, P = changed Parameters, D = changed Data) | |
| - [R console] [correlation test] [2010-05-20 12:11:13] [256f657a32c6b2b7628dddcfa9a822d0] [Current] | |
| Feedback Forum | |
Post a new message | |
Dataset | |
| Dataseries X: | |
-1.87133071317958 1.73453902805104 -0.426772691475442 0.391743026958578 0.173248576063434 -0.663642662340445 -1.20211908004035 0.266650237221081 0.110554377104077 0.724277889013119 -0.584567864661603 1.18098283804906 -1.2414765632646 0.202342895805145 -0.180162655085526 -1.02983423605531 0.997667866364666 0.479362710252987 0.876131698019883 -1.83877693114031 -0.136817284394659 2.36102504496192 -0.389267130140999 0.0310225529215209 -1.75681431513785 -0.781915690875951 -0.613477321110985 -0.00124795373683329 0.0182918441639314 -0.325030467929078 -0.393338617851453 -1.52322027252478 0.201618783470415 2.33583497596917 1.23849803611477 1.01511767279272 1.51188829764427 0.59448367838127 -0.194478869919112 -1.3093439566602 0.043423947260836 0.771859051027305 -0.754670910952608 -0.28153309288691 1.81532569644161 1.20430986469411 -1.10223610780947 0.14444506872984 0.93657438721938 -1.14956814030633 0.591160247245489 -0.860726715405021 -1.34445224425019 -0.388688582023819 0.0719809901538183 0.897125666975064 -1.08488716262666 0.157203361844083 1.10255065045532 -0.0654238429183664 0.0566901366724585 -2.51181532567996 -0.941003635616579 -1.06867951512642 0.247664414808435 0.570594570774287 0.578156110799626 -0.799024490468245 -0.186650820818671 -0.720419103453819 -1.42194221902808 0.575379000326387 -0.912009672787537 1.63943413222915 -0.23055140887528 1.33636869465919 -0.562842058792005 -0.300532766666318 -0.0192544401759524 0.0125600307303598 1.19361702686074 0.734741941436982 0.226080139172586 -0.910766618986843 -0.373872822327926 0.756298100852919 0.791468441826496 -1.90838734697183 0.75635256410981 0.354297665348886 0.310633549067398 -0.507923792266491 -0.478358090336383 -0.880559694001014 1.03434726911947 0.390316594295309 0.678430802114728 2.34307607885717 -0.812201835873736 0.745003289437628 | |
Tables (Output of Computation) | |
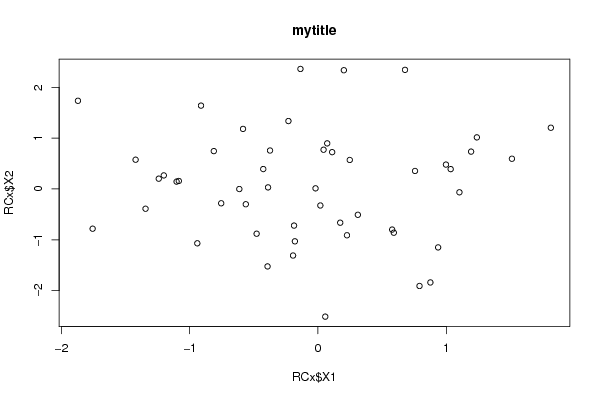
> title = 'my title'


> {
+     plot(RCx$X1, RCx$X2, main = title)
+     res <- cor.test(RCx$X1, RCx$X2)
+     print(res)
+ }

	Pearson's product-moment correlation

data:  RCx$X1 and RCx$X2
t = -0.1173, df = 48, p-value = 0.9071
alternative hypothesis: true correlation is not equal to 0
95 percent confidence interval:
 -0.2938908  0.2626575
sample estimates:
        cor
-0.01692783
| |
Figures (Output of Computation) | |
Input Parameters & R Code | |
| Parameters (Session): | |
| par1 = 'mytitle' ; | |
| Parameters (R input): | |
| R code (body of R function): | |
{ | |