Free Statistics
of Irreproducible Research!
Description of Statistical Computation | |
|---|---|
| Author's title | |
| Author | *The author of this computation has been verified* |
| R Software Module | Rscript (source code is shown below) |
| Title produced by software | R console |
| Date of computation | Thu, 20 May 2010 11:49:52 +0000 |
| Cite this page as follows | Statistical Computations at FreeStatistics.org, Office for Research Development and Education, URL https://freestatistics.org/blog/index.php?v=date/2010/May/20/t1274356193fw9uj7m5c1qy6i1.htm/, Retrieved Mon, 07 Jul 2025 21:14:04 +0000 |
| Statistical Computations at FreeStatistics.org, Office for Research Development and Education, URL https://freestatistics.org/blog/index.php?pk=76221, Retrieved Mon, 07 Jul 2025 21:14:04 +0000 | |
| QR Codes: | |
|
| |
| Original text written by user: | This example is used in the manual files of the RC package. |
| IsPrivate? | No (this computation is public) |
| User-defined keywords | blogtest |
| Estimated Impact | 279 |
Tree of Dependent Computations | |
| Family? (F = Feedback message, R = changed R code, M = changed R Module, P = changed Parameters, D = changed Data) | |
| - [R console] [correlation test] [2010-05-20 11:49:52] [256f657a32c6b2b7628dddcfa9a822d0] [Current] | |
| Feedback Forum | |
Post a new message | |
Dataset | |
| Dataseries X: | |
-0.242785820789455 -0.448076049588504 -0.790414902430913 -1.75382675503891 -0.845508628765118 0.598045798635701 -0.551498842695536 -0.290982729275714 1.10549837371719 0.766328674031005 -0.268186190331807 -1.15048542431361 0.533430504997528 0.584360773221066 0.571927881404563 1.09134591128903 0.743830215420665 1.0815521912411 -0.39069483950893 0.00596137412423002 0.363463638936884 -0.303384342645692 1.73039254814022 0.298081843135412 1.34921012125058 -0.506669631928545 -0.448572462051871 0.4448765097719 -0.429336669470266 -0.178150754284342 1.61703924160225 -0.582074582141795 1.50403479192854 -0.0913845226259583 0.824814046254663 1.35087578896178 1.64236331580666 -0.0197604112456083 -1.14549528187242 -0.614229714278711 -0.538251513315787 0.614137334815754 -1.52108750948936 1.05861785526173 1.49407101497119 -0.929008042203786 -1.5051954035373 -0.35078585529749 0.412984395937957 1.19989043010522 -2.04013317528607 -0.892705026546438 0.366767741271024 -0.095858188618955 0.79099886105125 -0.579519422827632 -1.17728892549712 0.234912639522664 0.196065229185173 -0.862906892948017 -1.2565101018772 0.812099548297935 0.332605263346521 0.557045060894646 0.931306652111252 -1.08272735855011 1.00033780783978 -0.833515695504792 0.0994519142255626 0.628707158023596 1.75858162124756 -0.676403829354147 -1.00329949634692 -0.880995443879385 0.217398425560524 -0.743555779297397 -2.00831089528166 1.34488546658367 -0.478917975438608 0.0753817564369461 -1.19619969792589 2.17098731278984 -0.628049344983053 0.36175114034273 -0.524332109007275 1.09054764550555 1.00525166942522 -0.484982329707443 1.1664348074528 -0.328325171479315 0.563100947522032 -1.04361521474175 -1.25816993014076 1.54377711413856 0.01171495124387 -0.181381965528713 0.551509459113242 -2.49514811187921 0.68011484817904 1.45321003119153 | |
Tables (Output of Computation) | |
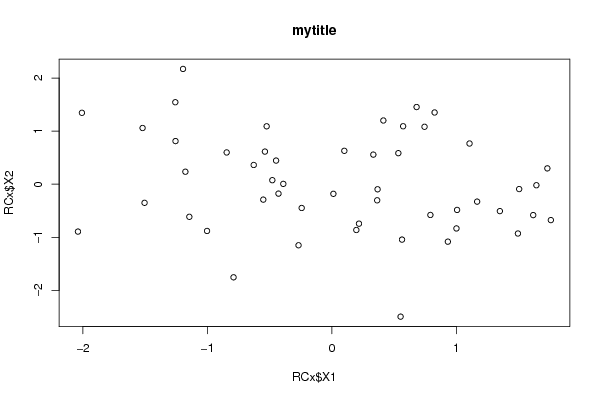
> title = 'my title'


> {
+     plot(RCx$X1, RCx$X2, main = title)
+     res <- cor.test(RCx$X1, RCx$X2)
+     print(res)
+ }

	Pearson's product-moment correlation

data:  RCx$X1 and RCx$X2
t = -1.5362, df = 48, p-value = 0.1311
alternative hypothesis: true correlation is not equal to 0
95 percent confidence interval:
 -0.46670169  0.06583964
sample estimates:
       cor
-0.2164753
| |
Figures (Output of Computation) | |
Input Parameters & R Code | |
| Parameters (Session): | |
| par1 = 'mytitle' ; | |
| Parameters (R input): | |
| R code (body of R function): | |
{ | |