Free Statistics

of Irreproducible Research!

Author's title

Author*Unverified author*
R Software Modulerwasp_smp.wasp
Title produced by softwareStandard Deviation-Mean Plot
Date of computationThu, 20 May 2010 10:48:00 +0000
Cite this page as followsStatistical Computations at FreeStatistics.org, Office for Research Development and Education, URL https://freestatistics.org/blog/index.php?v=date/2010/May/20/t1274352561vbbsootj14pd9ko.htm/, Retrieved Wed, 01 May 2024 02:23:43 +0000
Statistical Computations at FreeStatistics.org, Office for Research Development and Education, URL https://freestatistics.org/blog/index.php?pk=76217, Retrieved Wed, 01 May 2024 02:23:43 +0000
QR Codes:

Original text written by user:
IsPrivate?No (this computation is public)
User-defined keywordsKDGP2W83
Estimated Impact231
Family? (F = Feedback message, R = changed R code, M = changed R Module, P = changed Parameters, D = changed Data)
-     [Variability] [Spreidingsmaten -...] [2010-05-20 10:38:39] [eff9c8e59483abf95ad26d00265fce8e]
- RMP     [Standard Deviation-Mean Plot] [Gemiddeldegrafiek...] [2010-05-20 10:48:00] [615289131d9f16e370470ddcc9ade44c] [Current]
Feedback Forum

Post a new message
Dataseries X:
25204
24977
24320
22680
22052
21467
21383
21777
21928
21814
22937
23595
20830
19650
19195
19644
18483
18079
19178
18391
18441
18584
20108
20148
19394
17745
17696
17032
16438
15683
15594
15713
15937
16171
15928
16348
15579
15305
15648
14954
15137
15839
16050
15168
17064
16005
14886
14931
14544
13812
13031
12574
11964
11451
11346
11353
10702
10646
10556
10463
10407
10625
10872
10805
10653
10574
10431
10383
10296
10872
10635
10297
10570


Summary of computational transaction
Raw Inputview raw input (R code)
Raw Outputview raw output of R engine
Computing time2 seconds
R Server'Sir Ronald Aylmer Fisher' @ 193.190.124.24

\begin{tabular}{lllllllll}
\hline
Summary of computational transaction \tabularnewline
Raw Input & view raw input (R code)  \tabularnewline
Raw Output & view raw output of R engine  \tabularnewline
Computing time & 2 seconds \tabularnewline
R Server & 'Sir Ronald Aylmer Fisher' @ 193.190.124.24 \tabularnewline
\hline
\end{tabular}
%Source: https://freestatistics.org/blog/index.php?pk=76217&T=0

[TABLE]
[ROW][C]Summary of computational transaction[/C][/ROW]
[ROW][C]Raw Input[/C][C]view raw input (R code) [/C][/ROW]
[ROW][C]Raw Output[/C][C]view raw output of R engine [/C][/ROW]
[ROW][C]Computing time[/C][C]2 seconds[/C][/ROW]
[ROW][C]R Server[/C][C]'Sir Ronald Aylmer Fisher' @ 193.190.124.24[/C][/ROW]
[/TABLE]
Source: https://freestatistics.org/blog/index.php?pk=76217&T=0

Globally Unique Identifier (entire table): ba.freestatistics.org/blog/index.php?pk=76217&T=0

As an alternative you can also use a QR Code:  

The GUIDs for individual cells are displayed in the table below:

Summary of computational transaction
Raw Inputview raw input (R code)
Raw Outputview raw output of R engine
Computing time2 seconds
R Server'Sir Ronald Aylmer Fisher' @ 193.190.124.24


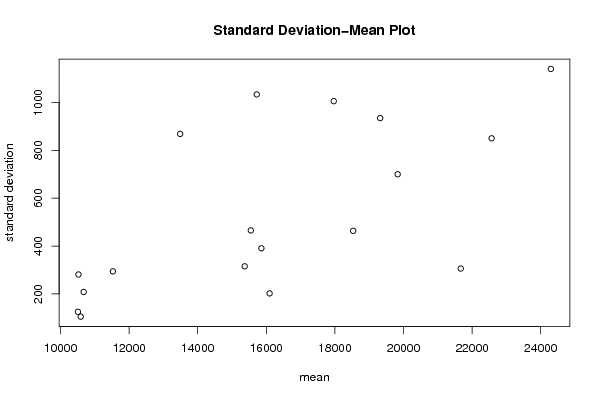
Standard Deviation-Mean Plot
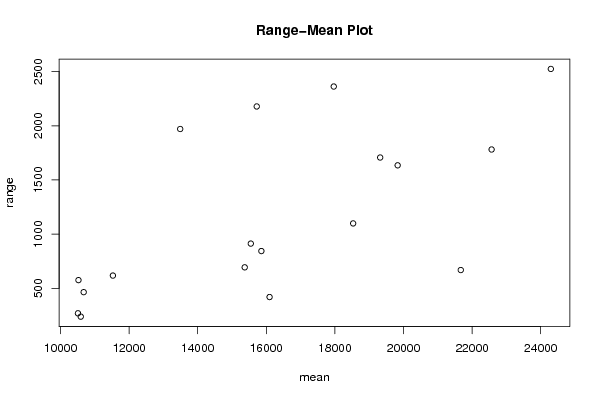
SectionMeanStandard DeviationRange
124295.251140.212662912792524
221669.75306.023283427912669
322568.5850.2950468317841781
419829.75700.0525575507411635
518532.75463.6107382995641099
619320.25934.6772615899741707
717966.751005.531161459792362
815857390.61575322389844
916096202.183085345931420
1015371.5315.297214280960694
1115548.5465.476458409374913
1215721.51033.703535836072178
1313490.25868.7801313719521970
1411528.5294.263487371437618
1510591.75104.805772741772239
1610677.25208.176807866134465
1710510.25125.052988768762270
1810525281.030247482366576

\begin{tabular}{lllllllll}
\hline
Standard Deviation-Mean Plot \tabularnewline
Section & Mean & Standard Deviation & Range \tabularnewline
1 & 24295.25 & 1140.21266291279 & 2524 \tabularnewline
2 & 21669.75 & 306.023283427912 & 669 \tabularnewline
3 & 22568.5 & 850.295046831784 & 1781 \tabularnewline
4 & 19829.75 & 700.052557550741 & 1635 \tabularnewline
5 & 18532.75 & 463.610738299564 & 1099 \tabularnewline
6 & 19320.25 & 934.677261589974 & 1707 \tabularnewline
7 & 17966.75 & 1005.53116145979 & 2362 \tabularnewline
8 & 15857 & 390.61575322389 & 844 \tabularnewline
9 & 16096 & 202.183085345931 & 420 \tabularnewline
10 & 15371.5 & 315.297214280960 & 694 \tabularnewline
11 & 15548.5 & 465.476458409374 & 913 \tabularnewline
12 & 15721.5 & 1033.70353583607 & 2178 \tabularnewline
13 & 13490.25 & 868.780131371952 & 1970 \tabularnewline
14 & 11528.5 & 294.263487371437 & 618 \tabularnewline
15 & 10591.75 & 104.805772741772 & 239 \tabularnewline
16 & 10677.25 & 208.176807866134 & 465 \tabularnewline
17 & 10510.25 & 125.052988768762 & 270 \tabularnewline
18 & 10525 & 281.030247482366 & 576 \tabularnewline
\hline
\end{tabular}
%Source: https://freestatistics.org/blog/index.php?pk=76217&T=1

[TABLE]
[ROW][C]Standard Deviation-Mean Plot[/C][/ROW]
[ROW][C]Section[/C][C]Mean[/C][C]Standard Deviation[/C][C]Range[/C][/ROW]
[ROW][C]1[/C][C]24295.25[/C][C]1140.21266291279[/C][C]2524[/C][/ROW]
[ROW][C]2[/C][C]21669.75[/C][C]306.023283427912[/C][C]669[/C][/ROW]
[ROW][C]3[/C][C]22568.5[/C][C]850.295046831784[/C][C]1781[/C][/ROW]
[ROW][C]4[/C][C]19829.75[/C][C]700.052557550741[/C][C]1635[/C][/ROW]
[ROW][C]5[/C][C]18532.75[/C][C]463.610738299564[/C][C]1099[/C][/ROW]
[ROW][C]6[/C][C]19320.25[/C][C]934.677261589974[/C][C]1707[/C][/ROW]
[ROW][C]7[/C][C]17966.75[/C][C]1005.53116145979[/C][C]2362[/C][/ROW]
[ROW][C]8[/C][C]15857[/C][C]390.61575322389[/C][C]844[/C][/ROW]
[ROW][C]9[/C][C]16096[/C][C]202.183085345931[/C][C]420[/C][/ROW]
[ROW][C]10[/C][C]15371.5[/C][C]315.297214280960[/C][C]694[/C][/ROW]
[ROW][C]11[/C][C]15548.5[/C][C]465.476458409374[/C][C]913[/C][/ROW]
[ROW][C]12[/C][C]15721.5[/C][C]1033.70353583607[/C][C]2178[/C][/ROW]
[ROW][C]13[/C][C]13490.25[/C][C]868.780131371952[/C][C]1970[/C][/ROW]
[ROW][C]14[/C][C]11528.5[/C][C]294.263487371437[/C][C]618[/C][/ROW]
[ROW][C]15[/C][C]10591.75[/C][C]104.805772741772[/C][C]239[/C][/ROW]
[ROW][C]16[/C][C]10677.25[/C][C]208.176807866134[/C][C]465[/C][/ROW]
[ROW][C]17[/C][C]10510.25[/C][C]125.052988768762[/C][C]270[/C][/ROW]
[ROW][C]18[/C][C]10525[/C][C]281.030247482366[/C][C]576[/C][/ROW]
[/TABLE]
Source: https://freestatistics.org/blog/index.php?pk=76217&T=1

Globally Unique Identifier (entire table): ba.freestatistics.org/blog/index.php?pk=76217&T=1

As an alternative you can also use a QR Code:  

The GUIDs for individual cells are displayed in the table below:

Standard Deviation-Mean Plot
SectionMeanStandard DeviationRange
124295.251140.212662912792524
221669.75306.023283427912669
322568.5850.2950468317841781
419829.75700.0525575507411635
518532.75463.6107382995641099
619320.25934.6772615899741707
717966.751005.531161459792362
815857390.61575322389844
916096202.183085345931420
1015371.5315.297214280960694
1115548.5465.476458409374913
1215721.51033.703535836072178
1313490.25868.7801313719521970
1411528.5294.263487371437618
1510591.75104.805772741772239
1610677.25208.176807866134465
1710510.25125.052988768762270
1810525281.030247482366576


Regression: S.E.(k) = alpha + beta * Mean(k)
alpha-278.882466864678
beta0.0507054369031953
S.D.0.01535513610487
T-STAT3.30218088311921
p-value0.00449858711741273

\begin{tabular}{lllllllll}
\hline
Regression: S.E.(k) = alpha + beta * Mean(k) \tabularnewline
alpha & -278.882466864678 \tabularnewline
beta & 0.0507054369031953 \tabularnewline
S.D. & 0.01535513610487 \tabularnewline
T-STAT & 3.30218088311921 \tabularnewline
p-value & 0.00449858711741273 \tabularnewline
\hline
\end{tabular}
%Source: https://freestatistics.org/blog/index.php?pk=76217&T=2

[TABLE]
[ROW][C]Regression: S.E.(k) = alpha + beta * Mean(k)[/C][/ROW]
[ROW][C]alpha[/C][C]-278.882466864678[/C][/ROW]
[ROW][C]beta[/C][C]0.0507054369031953[/C][/ROW]
[ROW][C]S.D.[/C][C]0.01535513610487[/C][/ROW]
[ROW][C]T-STAT[/C][C]3.30218088311921[/C][/ROW]
[ROW][C]p-value[/C][C]0.00449858711741273[/C][/ROW]
[/TABLE]
Source: https://freestatistics.org/blog/index.php?pk=76217&T=2

Globally Unique Identifier (entire table): ba.freestatistics.org/blog/index.php?pk=76217&T=2

As an alternative you can also use a QR Code:  

The GUIDs for individual cells are displayed in the table below:

Regression: S.E.(k) = alpha + beta * Mean(k)
alpha-278.882466864678
beta0.0507054369031953
S.D.0.01535513610487
T-STAT3.30218088311921
p-value0.00449858711741273


Regression: ln S.E.(k) = alpha + beta * ln Mean(k)
alpha-12.0622013039165
beta1.87698463317037
S.D.0.477659412611397
T-STAT3.92954599786647
p-value0.00119692615431990
Lambda-0.876984633170366

\begin{tabular}{lllllllll}
\hline
Regression: ln S.E.(k) = alpha + beta * ln Mean(k) \tabularnewline
alpha & -12.0622013039165 \tabularnewline
beta & 1.87698463317037 \tabularnewline
S.D. & 0.477659412611397 \tabularnewline
T-STAT & 3.92954599786647 \tabularnewline
p-value & 0.00119692615431990 \tabularnewline
Lambda & -0.876984633170366 \tabularnewline
\hline
\end{tabular}
%Source: https://freestatistics.org/blog/index.php?pk=76217&T=3

[TABLE]
[ROW][C]Regression: ln S.E.(k) = alpha + beta * ln Mean(k)[/C][/ROW]
[ROW][C]alpha[/C][C]-12.0622013039165[/C][/ROW]
[ROW][C]beta[/C][C]1.87698463317037[/C][/ROW]
[ROW][C]S.D.[/C][C]0.477659412611397[/C][/ROW]
[ROW][C]T-STAT[/C][C]3.92954599786647[/C][/ROW]
[ROW][C]p-value[/C][C]0.00119692615431990[/C][/ROW]
[ROW][C]Lambda[/C][C]-0.876984633170366[/C][/ROW]
[/TABLE]
Source: https://freestatistics.org/blog/index.php?pk=76217&T=3

Globally Unique Identifier (entire table): ba.freestatistics.org/blog/index.php?pk=76217&T=3

As an alternative you can also use a QR Code:  

The GUIDs for individual cells are displayed in the table below:

Regression: ln S.E.(k) = alpha + beta * ln Mean(k)
alpha-12.0622013039165
beta1.87698463317037
S.D.0.477659412611397
T-STAT3.92954599786647
p-value0.00119692615431990
Lambda-0.876984633170366


Parameters (Session):
par1 = 4 ;
Parameters (R input):
par1 = 4 ;
R code (references can be found in the software module):
par1 <- as.numeric(par1)
(n <- length(x))
(np <- floor(n / par1))
arr <- array(NA,dim=c(par1,np))
j <- 0
k <- 1
for (i in 1:(np*par1))
{
j = j + 1
arr[j,k] <- x[i]
if (j == par1) {
j = 0
k=k+1
}
}
arr
arr.mean <- array(NA,dim=np)
arr.sd <- array(NA,dim=np)
arr.range <- array(NA,dim=np)
for (j in 1:np)
{
arr.mean[j] <- mean(arr[,j],na.rm=TRUE)
arr.sd[j] <- sd(arr[,j],na.rm=TRUE)
arr.range[j] <- max(arr[,j],na.rm=TRUE) - min(arr[,j],na.rm=TRUE)
}
arr.mean
arr.sd
arr.range
(lm1 <- lm(arr.sd~arr.mean))
(lnlm1 <- lm(log(arr.sd)~log(arr.mean)))
(lm2 <- lm(arr.range~arr.mean))
bitmap(file='test1.png')
plot(arr.mean,arr.sd,main='Standard Deviation-Mean Plot',xlab='mean',ylab='standard deviation')
dev.off()
bitmap(file='test2.png')
plot(arr.mean,arr.range,main='Range-Mean Plot',xlab='mean',ylab='range')
dev.off()
load(file='createtable')
a<-table.start()
a<-table.row.start(a)
a<-table.element(a,'Standard Deviation-Mean Plot',4,TRUE)
a<-table.row.end(a)
a<-table.row.start(a)
a<-table.element(a,'Section',header=TRUE)
a<-table.element(a,'Mean',header=TRUE)
a<-table.element(a,'Standard Deviation',header=TRUE)
a<-table.element(a,'Range',header=TRUE)
a<-table.row.end(a)
for (j in 1:np) {
a<-table.row.start(a)
a<-table.element(a,j,header=TRUE)
a<-table.element(a,arr.mean[j])
a<-table.element(a,arr.sd[j] )
a<-table.element(a,arr.range[j] )
a<-table.row.end(a)
}
a<-table.end(a)
table.save(a,file='mytable.tab')
a<-table.start()
a<-table.row.start(a)
a<-table.element(a,'Regression: S.E.(k) = alpha + beta * Mean(k)',2,TRUE)
a<-table.row.end(a)
a<-table.row.start(a)
a<-table.element(a,'alpha',header=TRUE)
a<-table.element(a,lm1$coefficients[[1]])
a<-table.row.end(a)
a<-table.row.start(a)
a<-table.element(a,'beta',header=TRUE)
a<-table.element(a,lm1$coefficients[[2]])
a<-table.row.end(a)
a<-table.row.start(a)
a<-table.element(a,'S.D.',header=TRUE)
a<-table.element(a,summary(lm1)$coefficients[2,2])
a<-table.row.end(a)
a<-table.row.start(a)
a<-table.element(a,'T-STAT',header=TRUE)
a<-table.element(a,summary(lm1)$coefficients[2,3])
a<-table.row.end(a)
a<-table.row.start(a)
a<-table.element(a,'p-value',header=TRUE)
a<-table.element(a,summary(lm1)$coefficients[2,4])
a<-table.row.end(a)
a<-table.end(a)
table.save(a,file='mytable1.tab')
a<-table.start()
a<-table.row.start(a)
a<-table.element(a,'Regression: ln S.E.(k) = alpha + beta * ln Mean(k)',2,TRUE)
a<-table.row.end(a)
a<-table.row.start(a)
a<-table.element(a,'alpha',header=TRUE)
a<-table.element(a,lnlm1$coefficients[[1]])
a<-table.row.end(a)
a<-table.row.start(a)
a<-table.element(a,'beta',header=TRUE)
a<-table.element(a,lnlm1$coefficients[[2]])
a<-table.row.end(a)
a<-table.row.start(a)
a<-table.element(a,'S.D.',header=TRUE)
a<-table.element(a,summary(lnlm1)$coefficients[2,2])
a<-table.row.end(a)
a<-table.row.start(a)
a<-table.element(a,'T-STAT',header=TRUE)
a<-table.element(a,summary(lnlm1)$coefficients[2,3])
a<-table.row.end(a)
a<-table.row.start(a)
a<-table.element(a,'p-value',header=TRUE)
a<-table.element(a,summary(lnlm1)$coefficients[2,4])
a<-table.row.end(a)
a<-table.row.start(a)
a<-table.element(a,'Lambda',header=TRUE)
a<-table.element(a,1-lnlm1$coefficients[[2]])
a<-table.row.end(a)
a<-table.end(a)
table.save(a,file='mytable2.tab')