Free Statistics

of Irreproducible Research!

Author's title

Author*Unverified author*
R Software Modulerwasp_smp.wasp
Title produced by softwareStandard Deviation-Mean Plot
Date of computationWed, 19 May 2010 16:53:00 +0000
Cite this page as followsStatistical Computations at FreeStatistics.org, Office for Research Development and Education, URL https://freestatistics.org/blog/index.php?v=date/2010/May/19/t12742880751463d4tb8zr8ivn.htm/, Retrieved Mon, 29 Apr 2024 10:08:34 +0000
Statistical Computations at FreeStatistics.org, Office for Research Development and Education, URL https://freestatistics.org/blog/index.php?pk=76205, Retrieved Mon, 29 Apr 2024 10:08:34 +0000
QR Codes:

Original text written by user:
IsPrivate?No (this computation is public)
User-defined keywordsKDGP2W83
Estimated Impact168
Family? (F = Feedback message, R = changed R code, M = changed R Module, P = changed Parameters, D = changed Data)
-       [Standard Deviation-Mean Plot] [Maandelijkse cijf...] [2010-05-19 16:53:00] [26ddb8a30b965ed6738d4d4bc4c527d5] [Current]
Feedback Forum

Post a new message
Dataseries X:
580
575
558
564
581
597
587
536
524
537
536
533
528
516
502
506
518
534
528
478
469
490
493
508
517
514
510
527
542
565
555
499
511
526
532
549
561
557
566
588
620
626
620
573
573
574
580
590
593
597
595
612
628
629
621
569
567
573
584
589
591
595
594
611
613
611
594
543
537
544
555
561
562


Summary of computational transaction
Raw Inputview raw input (R code)
Raw Outputview raw output of R engine
Computing time3 seconds
R Server'George Udny Yule' @ 72.249.76.132

\begin{tabular}{lllllllll}
\hline
Summary of computational transaction \tabularnewline
Raw Input & view raw input (R code)  \tabularnewline
Raw Output & view raw output of R engine  \tabularnewline
Computing time & 3 seconds \tabularnewline
R Server & 'George Udny Yule' @ 72.249.76.132 \tabularnewline
\hline
\end{tabular}
%Source: https://freestatistics.org/blog/index.php?pk=76205&T=0

[TABLE]
[ROW][C]Summary of computational transaction[/C][/ROW]
[ROW][C]Raw Input[/C][C]view raw input (R code) [/C][/ROW]
[ROW][C]Raw Output[/C][C]view raw output of R engine [/C][/ROW]
[ROW][C]Computing time[/C][C]3 seconds[/C][/ROW]
[ROW][C]R Server[/C][C]'George Udny Yule' @ 72.249.76.132[/C][/ROW]
[/TABLE]
Source: https://freestatistics.org/blog/index.php?pk=76205&T=0

Globally Unique Identifier (entire table): ba.freestatistics.org/blog/index.php?pk=76205&T=0

As an alternative you can also use a QR Code:  

The GUIDs for individual cells are displayed in the table below:

Summary of computational transaction
Raw Inputview raw input (R code)
Raw Outputview raw output of R engine
Computing time3 seconds
R Server'George Udny Yule' @ 72.249.76.132


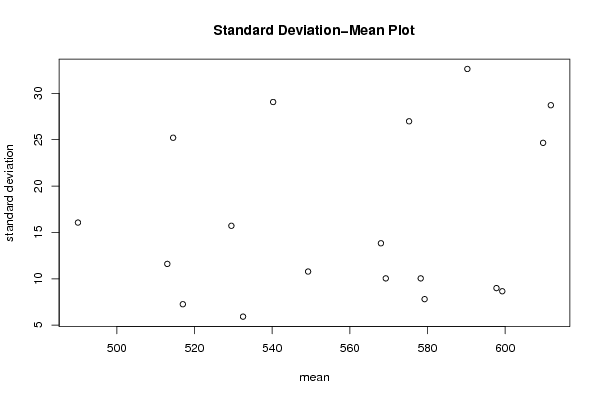
Standard Deviation-Mean Plot
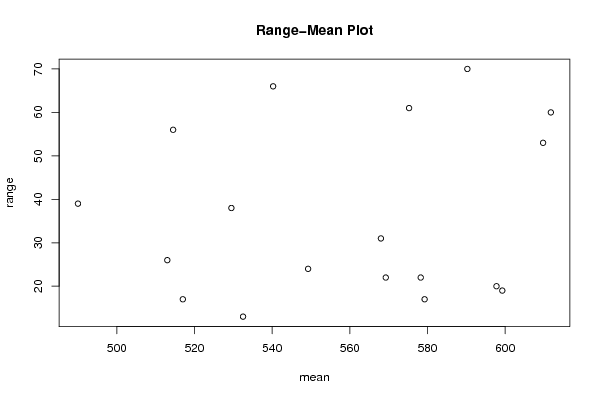
SectionMeanStandard DeviationRange
1569.2510.045728777279822
2575.2526.986107537027361
3532.55.9160797830996213
451311.604596790352826
5514.525.212430796467656
649016.06237840420939
75177.2571803523590817
8540.2529.067450295247266
9529.515.716233645501738
1056813.832329280831031
11609.7524.662724910277053
12579.257.804912982645417
13599.258.6554414483991919
14611.7528.721362548922860
15578.2510.045728777279822
16597.758.995369179009120
17590.2532.633060945407370
18549.2510.781929326423924

\begin{tabular}{lllllllll}
\hline
Standard Deviation-Mean Plot \tabularnewline
Section & Mean & Standard Deviation & Range \tabularnewline
1 & 569.25 & 10.0457287772798 & 22 \tabularnewline
2 & 575.25 & 26.9861075370273 & 61 \tabularnewline
3 & 532.5 & 5.91607978309962 & 13 \tabularnewline
4 & 513 & 11.6045967903528 & 26 \tabularnewline
5 & 514.5 & 25.2124307964676 & 56 \tabularnewline
6 & 490 & 16.062378404209 & 39 \tabularnewline
7 & 517 & 7.25718035235908 & 17 \tabularnewline
8 & 540.25 & 29.0674502952472 & 66 \tabularnewline
9 & 529.5 & 15.7162336455017 & 38 \tabularnewline
10 & 568 & 13.8323292808310 & 31 \tabularnewline
11 & 609.75 & 24.6627249102770 & 53 \tabularnewline
12 & 579.25 & 7.8049129826454 & 17 \tabularnewline
13 & 599.25 & 8.65544144839919 & 19 \tabularnewline
14 & 611.75 & 28.7213625489228 & 60 \tabularnewline
15 & 578.25 & 10.0457287772798 & 22 \tabularnewline
16 & 597.75 & 8.9953691790091 & 20 \tabularnewline
17 & 590.25 & 32.6330609454073 & 70 \tabularnewline
18 & 549.25 & 10.7819293264239 & 24 \tabularnewline
\hline
\end{tabular}
%Source: https://freestatistics.org/blog/index.php?pk=76205&T=1

[TABLE]
[ROW][C]Standard Deviation-Mean Plot[/C][/ROW]
[ROW][C]Section[/C][C]Mean[/C][C]Standard Deviation[/C][C]Range[/C][/ROW]
[ROW][C]1[/C][C]569.25[/C][C]10.0457287772798[/C][C]22[/C][/ROW]
[ROW][C]2[/C][C]575.25[/C][C]26.9861075370273[/C][C]61[/C][/ROW]
[ROW][C]3[/C][C]532.5[/C][C]5.91607978309962[/C][C]13[/C][/ROW]
[ROW][C]4[/C][C]513[/C][C]11.6045967903528[/C][C]26[/C][/ROW]
[ROW][C]5[/C][C]514.5[/C][C]25.2124307964676[/C][C]56[/C][/ROW]
[ROW][C]6[/C][C]490[/C][C]16.062378404209[/C][C]39[/C][/ROW]
[ROW][C]7[/C][C]517[/C][C]7.25718035235908[/C][C]17[/C][/ROW]
[ROW][C]8[/C][C]540.25[/C][C]29.0674502952472[/C][C]66[/C][/ROW]
[ROW][C]9[/C][C]529.5[/C][C]15.7162336455017[/C][C]38[/C][/ROW]
[ROW][C]10[/C][C]568[/C][C]13.8323292808310[/C][C]31[/C][/ROW]
[ROW][C]11[/C][C]609.75[/C][C]24.6627249102770[/C][C]53[/C][/ROW]
[ROW][C]12[/C][C]579.25[/C][C]7.8049129826454[/C][C]17[/C][/ROW]
[ROW][C]13[/C][C]599.25[/C][C]8.65544144839919[/C][C]19[/C][/ROW]
[ROW][C]14[/C][C]611.75[/C][C]28.7213625489228[/C][C]60[/C][/ROW]
[ROW][C]15[/C][C]578.25[/C][C]10.0457287772798[/C][C]22[/C][/ROW]
[ROW][C]16[/C][C]597.75[/C][C]8.9953691790091[/C][C]20[/C][/ROW]
[ROW][C]17[/C][C]590.25[/C][C]32.6330609454073[/C][C]70[/C][/ROW]
[ROW][C]18[/C][C]549.25[/C][C]10.7819293264239[/C][C]24[/C][/ROW]
[/TABLE]
Source: https://freestatistics.org/blog/index.php?pk=76205&T=1

Globally Unique Identifier (entire table): ba.freestatistics.org/blog/index.php?pk=76205&T=1

As an alternative you can also use a QR Code:  

The GUIDs for individual cells are displayed in the table below:

Standard Deviation-Mean Plot
SectionMeanStandard DeviationRange
1569.2510.045728777279822
2575.2526.986107537027361
3532.55.9160797830996213
451311.604596790352826
5514.525.212430796467656
649016.06237840420939
75177.2571803523590817
8540.2529.067450295247266
9529.515.716233645501738
1056813.832329280831031
11609.7524.662724910277053
12579.257.804912982645417
13599.258.6554414483991919
14611.7528.721362548922860
15578.2510.045728777279822
16597.758.995369179009120
17590.2532.633060945407370
18549.2510.781929326423924


Regression: S.E.(k) = alpha + beta * Mean(k)
alpha-10.4293958193841
beta0.0478631034580744
S.D.0.059129771962759
T-STAT0.80945861736486
p-value0.430125418253985

\begin{tabular}{lllllllll}
\hline
Regression: S.E.(k) = alpha + beta * Mean(k) \tabularnewline
alpha & -10.4293958193841 \tabularnewline
beta & 0.0478631034580744 \tabularnewline
S.D. & 0.059129771962759 \tabularnewline
T-STAT & 0.80945861736486 \tabularnewline
p-value & 0.430125418253985 \tabularnewline
\hline
\end{tabular}
%Source: https://freestatistics.org/blog/index.php?pk=76205&T=2

[TABLE]
[ROW][C]Regression: S.E.(k) = alpha + beta * Mean(k)[/C][/ROW]
[ROW][C]alpha[/C][C]-10.4293958193841[/C][/ROW]
[ROW][C]beta[/C][C]0.0478631034580744[/C][/ROW]
[ROW][C]S.D.[/C][C]0.059129771962759[/C][/ROW]
[ROW][C]T-STAT[/C][C]0.80945861736486[/C][/ROW]
[ROW][C]p-value[/C][C]0.430125418253985[/C][/ROW]
[/TABLE]
Source: https://freestatistics.org/blog/index.php?pk=76205&T=2

Globally Unique Identifier (entire table): ba.freestatistics.org/blog/index.php?pk=76205&T=2

As an alternative you can also use a QR Code:  

The GUIDs for individual cells are displayed in the table below:

Regression: S.E.(k) = alpha + beta * Mean(k)
alpha-10.4293958193841
beta0.0478631034580744
S.D.0.059129771962759
T-STAT0.80945861736486
p-value0.430125418253985


Regression: ln S.E.(k) = alpha + beta * ln Mean(k)
alpha-5.12130696630585
beta1.22889899515972
S.D.2.03390497780893
T-STAT0.604206690365435
p-value0.554177777009845
Lambda-0.228898995159718

\begin{tabular}{lllllllll}
\hline
Regression: ln S.E.(k) = alpha + beta * ln Mean(k) \tabularnewline
alpha & -5.12130696630585 \tabularnewline
beta & 1.22889899515972 \tabularnewline
S.D. & 2.03390497780893 \tabularnewline
T-STAT & 0.604206690365435 \tabularnewline
p-value & 0.554177777009845 \tabularnewline
Lambda & -0.228898995159718 \tabularnewline
\hline
\end{tabular}
%Source: https://freestatistics.org/blog/index.php?pk=76205&T=3

[TABLE]
[ROW][C]Regression: ln S.E.(k) = alpha + beta * ln Mean(k)[/C][/ROW]
[ROW][C]alpha[/C][C]-5.12130696630585[/C][/ROW]
[ROW][C]beta[/C][C]1.22889899515972[/C][/ROW]
[ROW][C]S.D.[/C][C]2.03390497780893[/C][/ROW]
[ROW][C]T-STAT[/C][C]0.604206690365435[/C][/ROW]
[ROW][C]p-value[/C][C]0.554177777009845[/C][/ROW]
[ROW][C]Lambda[/C][C]-0.228898995159718[/C][/ROW]
[/TABLE]
Source: https://freestatistics.org/blog/index.php?pk=76205&T=3

Globally Unique Identifier (entire table): ba.freestatistics.org/blog/index.php?pk=76205&T=3

As an alternative you can also use a QR Code:  

The GUIDs for individual cells are displayed in the table below:

Regression: ln S.E.(k) = alpha + beta * ln Mean(k)
alpha-5.12130696630585
beta1.22889899515972
S.D.2.03390497780893
T-STAT0.604206690365435
p-value0.554177777009845
Lambda-0.228898995159718


Parameters (Session):
par1 = 4 ;
Parameters (R input):
par1 = 4 ;
R code (references can be found in the software module):
par1 <- as.numeric(par1)
(n <- length(x))
(np <- floor(n / par1))
arr <- array(NA,dim=c(par1,np))
j <- 0
k <- 1
for (i in 1:(np*par1))
{
j = j + 1
arr[j,k] <- x[i]
if (j == par1) {
j = 0
k=k+1
}
}
arr
arr.mean <- array(NA,dim=np)
arr.sd <- array(NA,dim=np)
arr.range <- array(NA,dim=np)
for (j in 1:np)
{
arr.mean[j] <- mean(arr[,j],na.rm=TRUE)
arr.sd[j] <- sd(arr[,j],na.rm=TRUE)
arr.range[j] <- max(arr[,j],na.rm=TRUE) - min(arr[,j],na.rm=TRUE)
}
arr.mean
arr.sd
arr.range
(lm1 <- lm(arr.sd~arr.mean))
(lnlm1 <- lm(log(arr.sd)~log(arr.mean)))
(lm2 <- lm(arr.range~arr.mean))
bitmap(file='test1.png')
plot(arr.mean,arr.sd,main='Standard Deviation-Mean Plot',xlab='mean',ylab='standard deviation')
dev.off()
bitmap(file='test2.png')
plot(arr.mean,arr.range,main='Range-Mean Plot',xlab='mean',ylab='range')
dev.off()
load(file='createtable')
a<-table.start()
a<-table.row.start(a)
a<-table.element(a,'Standard Deviation-Mean Plot',4,TRUE)
a<-table.row.end(a)
a<-table.row.start(a)
a<-table.element(a,'Section',header=TRUE)
a<-table.element(a,'Mean',header=TRUE)
a<-table.element(a,'Standard Deviation',header=TRUE)
a<-table.element(a,'Range',header=TRUE)
a<-table.row.end(a)
for (j in 1:np) {
a<-table.row.start(a)
a<-table.element(a,j,header=TRUE)
a<-table.element(a,arr.mean[j])
a<-table.element(a,arr.sd[j] )
a<-table.element(a,arr.range[j] )
a<-table.row.end(a)
}
a<-table.end(a)
table.save(a,file='mytable.tab')
a<-table.start()
a<-table.row.start(a)
a<-table.element(a,'Regression: S.E.(k) = alpha + beta * Mean(k)',2,TRUE)
a<-table.row.end(a)
a<-table.row.start(a)
a<-table.element(a,'alpha',header=TRUE)
a<-table.element(a,lm1$coefficients[[1]])
a<-table.row.end(a)
a<-table.row.start(a)
a<-table.element(a,'beta',header=TRUE)
a<-table.element(a,lm1$coefficients[[2]])
a<-table.row.end(a)
a<-table.row.start(a)
a<-table.element(a,'S.D.',header=TRUE)
a<-table.element(a,summary(lm1)$coefficients[2,2])
a<-table.row.end(a)
a<-table.row.start(a)
a<-table.element(a,'T-STAT',header=TRUE)
a<-table.element(a,summary(lm1)$coefficients[2,3])
a<-table.row.end(a)
a<-table.row.start(a)
a<-table.element(a,'p-value',header=TRUE)
a<-table.element(a,summary(lm1)$coefficients[2,4])
a<-table.row.end(a)
a<-table.end(a)
table.save(a,file='mytable1.tab')
a<-table.start()
a<-table.row.start(a)
a<-table.element(a,'Regression: ln S.E.(k) = alpha + beta * ln Mean(k)',2,TRUE)
a<-table.row.end(a)
a<-table.row.start(a)
a<-table.element(a,'alpha',header=TRUE)
a<-table.element(a,lnlm1$coefficients[[1]])
a<-table.row.end(a)
a<-table.row.start(a)
a<-table.element(a,'beta',header=TRUE)
a<-table.element(a,lnlm1$coefficients[[2]])
a<-table.row.end(a)
a<-table.row.start(a)
a<-table.element(a,'S.D.',header=TRUE)
a<-table.element(a,summary(lnlm1)$coefficients[2,2])
a<-table.row.end(a)
a<-table.row.start(a)
a<-table.element(a,'T-STAT',header=TRUE)
a<-table.element(a,summary(lnlm1)$coefficients[2,3])
a<-table.row.end(a)
a<-table.row.start(a)
a<-table.element(a,'p-value',header=TRUE)
a<-table.element(a,summary(lnlm1)$coefficients[2,4])
a<-table.row.end(a)
a<-table.row.start(a)
a<-table.element(a,'Lambda',header=TRUE)
a<-table.element(a,1-lnlm1$coefficients[[2]])
a<-table.row.end(a)
a<-table.end(a)
table.save(a,file='mytable2.tab')