Free Statistics

of Irreproducible Research!

Author's title

Author*Unverified author*
R Software Modulerwasp_smp.wasp
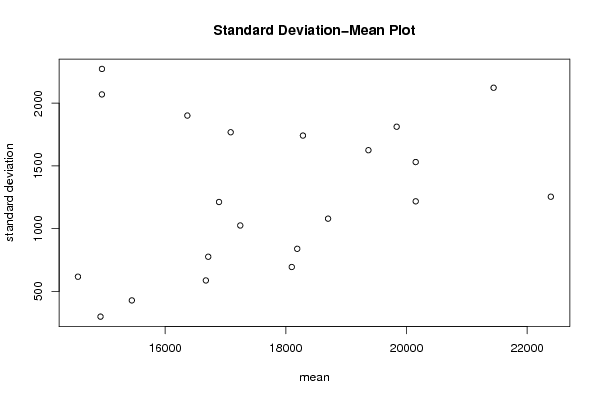
Title produced by softwareStandard Deviation-Mean Plot
Date of computationSun, 16 May 2010 18:08:12 +0000
Cite this page as followsStatistical Computations at FreeStatistics.org, Office for Research Development and Education, URL https://freestatistics.org/blog/index.php?v=date/2010/May/16/t1274033398ts77w5j1ia12a2g.htm/, Retrieved Mon, 29 Apr 2024 18:40:44 +0000
Statistical Computations at FreeStatistics.org, Office for Research Development and Education, URL https://freestatistics.org/blog/index.php?pk=76042, Retrieved Mon, 29 Apr 2024 18:40:44 +0000
QR Codes:

Original text written by user:
IsPrivate?No (this computation is public)
User-defined keywordsKDGP2W83
Estimated Impact227
Family? (F = Feedback message, R = changed R code, M = changed R Module, P = changed Parameters, D = changed Data)
-     [Univariate Data Series] [Uitvoer van België] [2010-02-04 08:24:53] [2ee36997fb1be82ef07372b18c1a823d]
- RMPD    [Standard Deviation-Mean Plot] [invoer en uitvoer...] [2010-05-16 18:08:12] [ea4db07d8da34007b79212461ea6aa7b] [Current]
Feedback Forum

Post a new message
Dataseries X:
18288.3
16049
16764.5
17880.2
16555.9
16087.1
16373.5
17842.2
22321.5
22786.7
18274.1
22392.9
23899.3
21343.5
22952.3
21374.4
21164.1
20906.5
17877.4
20664.3
22160
19813.6
17735.4
19640.2
20844.4
19823.1
18594.6
21350.6
18574.1
18924.2
17343.4
19961.2
19932.1
19464.6
16165.4
17574.9
19795.4
19439.5
17170
21072.4
17751.8
17515.5
18040.3
19090.1
17746.5
19202.1
15141.6
16258.1
18586.5
17209.4
17838.7
19123.5
16583.6
15991.2
16704.5
17422
17872
17823.2
13866.5
15912.8
17870.5
15420.3
16379.4
17903.9
15305.8
14583.3
14861
14968.9
16726.5
16283.6
11703.7
15101.8
15469.7
14956.9
15370.6
15998.1
14725.1
14768.9
13659.6
15070.3
16942.6
15761.3
12083
15023.6
15106.5


Summary of computational transaction
Raw Inputview raw input (R code)
Raw Outputview raw output of R engine
Computing time2 seconds
R Server'Sir Ronald Aylmer Fisher' @ 193.190.124.24

\begin{tabular}{lllllllll}
\hline
Summary of computational transaction \tabularnewline
Raw Input & view raw input (R code)  \tabularnewline
Raw Output & view raw output of R engine  \tabularnewline
Computing time & 2 seconds \tabularnewline
R Server & 'Sir Ronald Aylmer Fisher' @ 193.190.124.24 \tabularnewline
\hline
\end{tabular}
%Source: https://freestatistics.org/blog/index.php?pk=76042&T=0

[TABLE]
[ROW][C]Summary of computational transaction[/C][/ROW]
[ROW][C]Raw Input[/C][C]view raw input (R code) [/C][/ROW]
[ROW][C]Raw Output[/C][C]view raw output of R engine [/C][/ROW]
[ROW][C]Computing time[/C][C]2 seconds[/C][/ROW]
[ROW][C]R Server[/C][C]'Sir Ronald Aylmer Fisher' @ 193.190.124.24[/C][/ROW]
[/TABLE]
Source: https://freestatistics.org/blog/index.php?pk=76042&T=0

Globally Unique Identifier (entire table): ba.freestatistics.org/blog/index.php?pk=76042&T=0

As an alternative you can also use a QR Code:  

The GUIDs for individual cells are displayed in the table below:

Summary of computational transaction
Raw Inputview raw input (R code)
Raw Outputview raw output of R engine
Computing time2 seconds
R Server'Sir Ronald Aylmer Fisher' @ 193.190.124.24


Standard Deviation-Mean Plot
SectionMeanStandard DeviationRange
117245.51025.223419553032239.3
216714.675776.0525943302211755.1
321443.82123.010959305994512.6
422392.3751254.425609259742555.8
520153.0751530.780681820013286.7
619837.31812.211264358184424.6
720153.1751217.883980174902756
818700.7251079.676394033572617.8
918284.251741.774812272433766.7
1019369.3251625.21376517063902.4
1118099.425694.44084641291574.6
1217087.0751768.261350168584060.5
1318189.525839.369137606731914.1
1416675.325587.314574284231430.8
1516368.6251901.256669284824005.5
1616893.5251212.443016874062483.6
1714929.75298.719762765483722.5
1814953.92272.728705029855022.8
1915448.825428.270999679721041.2
2014555.975616.9707360699261410.7
2114952.6252069.922772110114859.6

\begin{tabular}{lllllllll}
\hline
Standard Deviation-Mean Plot \tabularnewline
Section & Mean & Standard Deviation & Range \tabularnewline
1 & 17245.5 & 1025.22341955303 & 2239.3 \tabularnewline
2 & 16714.675 & 776.052594330221 & 1755.1 \tabularnewline
3 & 21443.8 & 2123.01095930599 & 4512.6 \tabularnewline
4 & 22392.375 & 1254.42560925974 & 2555.8 \tabularnewline
5 & 20153.075 & 1530.78068182001 & 3286.7 \tabularnewline
6 & 19837.3 & 1812.21126435818 & 4424.6 \tabularnewline
7 & 20153.175 & 1217.88398017490 & 2756 \tabularnewline
8 & 18700.725 & 1079.67639403357 & 2617.8 \tabularnewline
9 & 18284.25 & 1741.77481227243 & 3766.7 \tabularnewline
10 & 19369.325 & 1625.2137651706 & 3902.4 \tabularnewline
11 & 18099.425 & 694.4408464129 & 1574.6 \tabularnewline
12 & 17087.075 & 1768.26135016858 & 4060.5 \tabularnewline
13 & 18189.525 & 839.36913760673 & 1914.1 \tabularnewline
14 & 16675.325 & 587.31457428423 & 1430.8 \tabularnewline
15 & 16368.625 & 1901.25666928482 & 4005.5 \tabularnewline
16 & 16893.525 & 1212.44301687406 & 2483.6 \tabularnewline
17 & 14929.75 & 298.719762765483 & 722.5 \tabularnewline
18 & 14953.9 & 2272.72870502985 & 5022.8 \tabularnewline
19 & 15448.825 & 428.27099967972 & 1041.2 \tabularnewline
20 & 14555.975 & 616.970736069926 & 1410.7 \tabularnewline
21 & 14952.625 & 2069.92277211011 & 4859.6 \tabularnewline
\hline
\end{tabular}
%Source: https://freestatistics.org/blog/index.php?pk=76042&T=1

[TABLE]
[ROW][C]Standard Deviation-Mean Plot[/C][/ROW]
[ROW][C]Section[/C][C]Mean[/C][C]Standard Deviation[/C][C]Range[/C][/ROW]
[ROW][C]1[/C][C]17245.5[/C][C]1025.22341955303[/C][C]2239.3[/C][/ROW]
[ROW][C]2[/C][C]16714.675[/C][C]776.052594330221[/C][C]1755.1[/C][/ROW]
[ROW][C]3[/C][C]21443.8[/C][C]2123.01095930599[/C][C]4512.6[/C][/ROW]
[ROW][C]4[/C][C]22392.375[/C][C]1254.42560925974[/C][C]2555.8[/C][/ROW]
[ROW][C]5[/C][C]20153.075[/C][C]1530.78068182001[/C][C]3286.7[/C][/ROW]
[ROW][C]6[/C][C]19837.3[/C][C]1812.21126435818[/C][C]4424.6[/C][/ROW]
[ROW][C]7[/C][C]20153.175[/C][C]1217.88398017490[/C][C]2756[/C][/ROW]
[ROW][C]8[/C][C]18700.725[/C][C]1079.67639403357[/C][C]2617.8[/C][/ROW]
[ROW][C]9[/C][C]18284.25[/C][C]1741.77481227243[/C][C]3766.7[/C][/ROW]
[ROW][C]10[/C][C]19369.325[/C][C]1625.2137651706[/C][C]3902.4[/C][/ROW]
[ROW][C]11[/C][C]18099.425[/C][C]694.4408464129[/C][C]1574.6[/C][/ROW]
[ROW][C]12[/C][C]17087.075[/C][C]1768.26135016858[/C][C]4060.5[/C][/ROW]
[ROW][C]13[/C][C]18189.525[/C][C]839.36913760673[/C][C]1914.1[/C][/ROW]
[ROW][C]14[/C][C]16675.325[/C][C]587.31457428423[/C][C]1430.8[/C][/ROW]
[ROW][C]15[/C][C]16368.625[/C][C]1901.25666928482[/C][C]4005.5[/C][/ROW]
[ROW][C]16[/C][C]16893.525[/C][C]1212.44301687406[/C][C]2483.6[/C][/ROW]
[ROW][C]17[/C][C]14929.75[/C][C]298.719762765483[/C][C]722.5[/C][/ROW]
[ROW][C]18[/C][C]14953.9[/C][C]2272.72870502985[/C][C]5022.8[/C][/ROW]
[ROW][C]19[/C][C]15448.825[/C][C]428.27099967972[/C][C]1041.2[/C][/ROW]
[ROW][C]20[/C][C]14555.975[/C][C]616.970736069926[/C][C]1410.7[/C][/ROW]
[ROW][C]21[/C][C]14952.625[/C][C]2069.92277211011[/C][C]4859.6[/C][/ROW]
[/TABLE]
Source: https://freestatistics.org/blog/index.php?pk=76042&T=1

Globally Unique Identifier (entire table): ba.freestatistics.org/blog/index.php?pk=76042&T=1

As an alternative you can also use a QR Code:  

The GUIDs for individual cells are displayed in the table below:

Standard Deviation-Mean Plot
SectionMeanStandard DeviationRange
117245.51025.223419553032239.3
216714.675776.0525943302211755.1
321443.82123.010959305994512.6
422392.3751254.425609259742555.8
520153.0751530.780681820013286.7
619837.31812.211264358184424.6
720153.1751217.883980174902756
818700.7251079.676394033572617.8
918284.251741.774812272433766.7
1019369.3251625.21376517063902.4
1118099.425694.44084641291574.6
1217087.0751768.261350168584060.5
1318189.525839.369137606731914.1
1416675.325587.314574284231430.8
1516368.6251901.256669284824005.5
1616893.5251212.443016874062483.6
1714929.75298.719762765483722.5
1814953.92272.728705029855022.8
1915448.825428.270999679721041.2
2014555.975616.9707360699261410.7
2114952.6252069.922772110114859.6


Regression: S.E.(k) = alpha + beta * Mean(k)
alpha53.4058736519282
beta0.0691489150524782
S.D.0.0592328687381273
T-STAT1.16740783496728
p-value0.257488027284626

\begin{tabular}{lllllllll}
\hline
Regression: S.E.(k) = alpha + beta * Mean(k) \tabularnewline
alpha & 53.4058736519282 \tabularnewline
beta & 0.0691489150524782 \tabularnewline
S.D. & 0.0592328687381273 \tabularnewline
T-STAT & 1.16740783496728 \tabularnewline
p-value & 0.257488027284626 \tabularnewline
\hline
\end{tabular}
%Source: https://freestatistics.org/blog/index.php?pk=76042&T=2

[TABLE]
[ROW][C]Regression: S.E.(k) = alpha + beta * Mean(k)[/C][/ROW]
[ROW][C]alpha[/C][C]53.4058736519282[/C][/ROW]
[ROW][C]beta[/C][C]0.0691489150524782[/C][/ROW]
[ROW][C]S.D.[/C][C]0.0592328687381273[/C][/ROW]
[ROW][C]T-STAT[/C][C]1.16740783496728[/C][/ROW]
[ROW][C]p-value[/C][C]0.257488027284626[/C][/ROW]
[/TABLE]
Source: https://freestatistics.org/blog/index.php?pk=76042&T=2

Globally Unique Identifier (entire table): ba.freestatistics.org/blog/index.php?pk=76042&T=2

As an alternative you can also use a QR Code:  

The GUIDs for individual cells are displayed in the table below:

Regression: S.E.(k) = alpha + beta * Mean(k)
alpha53.4058736519282
beta0.0691489150524782
S.D.0.0592328687381273
T-STAT1.16740783496728
p-value0.257488027284626


Regression: ln S.E.(k) = alpha + beta * ln Mean(k)
alpha-9.72597618462259
beta1.71333472925737
S.D.0.959879136782806
T-STAT1.78494839985781
p-value0.090245147570376
Lambda-0.713334729257368

\begin{tabular}{lllllllll}
\hline
Regression: ln S.E.(k) = alpha + beta * ln Mean(k) \tabularnewline
alpha & -9.72597618462259 \tabularnewline
beta & 1.71333472925737 \tabularnewline
S.D. & 0.959879136782806 \tabularnewline
T-STAT & 1.78494839985781 \tabularnewline
p-value & 0.090245147570376 \tabularnewline
Lambda & -0.713334729257368 \tabularnewline
\hline
\end{tabular}
%Source: https://freestatistics.org/blog/index.php?pk=76042&T=3

[TABLE]
[ROW][C]Regression: ln S.E.(k) = alpha + beta * ln Mean(k)[/C][/ROW]
[ROW][C]alpha[/C][C]-9.72597618462259[/C][/ROW]
[ROW][C]beta[/C][C]1.71333472925737[/C][/ROW]
[ROW][C]S.D.[/C][C]0.959879136782806[/C][/ROW]
[ROW][C]T-STAT[/C][C]1.78494839985781[/C][/ROW]
[ROW][C]p-value[/C][C]0.090245147570376[/C][/ROW]
[ROW][C]Lambda[/C][C]-0.713334729257368[/C][/ROW]
[/TABLE]
Source: https://freestatistics.org/blog/index.php?pk=76042&T=3

Globally Unique Identifier (entire table): ba.freestatistics.org/blog/index.php?pk=76042&T=3

As an alternative you can also use a QR Code:  

The GUIDs for individual cells are displayed in the table below:

Regression: ln S.E.(k) = alpha + beta * ln Mean(k)
alpha-9.72597618462259
beta1.71333472925737
S.D.0.959879136782806
T-STAT1.78494839985781
p-value0.090245147570376
Lambda-0.713334729257368


Parameters (Session):
par1 = 4 ;
Parameters (R input):
par1 = 4 ;
R code (references can be found in the software module):
par1 <- as.numeric(par1)
(n <- length(x))
(np <- floor(n / par1))
arr <- array(NA,dim=c(par1,np))
j <- 0
k <- 1
for (i in 1:(np*par1))
{
j = j + 1
arr[j,k] <- x[i]
if (j == par1) {
j = 0
k=k+1
}
}
arr
arr.mean <- array(NA,dim=np)
arr.sd <- array(NA,dim=np)
arr.range <- array(NA,dim=np)
for (j in 1:np)
{
arr.mean[j] <- mean(arr[,j],na.rm=TRUE)
arr.sd[j] <- sd(arr[,j],na.rm=TRUE)
arr.range[j] <- max(arr[,j],na.rm=TRUE) - min(arr[,j],na.rm=TRUE)
}
arr.mean
arr.sd
arr.range
(lm1 <- lm(arr.sd~arr.mean))
(lnlm1 <- lm(log(arr.sd)~log(arr.mean)))
(lm2 <- lm(arr.range~arr.mean))
bitmap(file='test1.png')
plot(arr.mean,arr.sd,main='Standard Deviation-Mean Plot',xlab='mean',ylab='standard deviation')
dev.off()
bitmap(file='test2.png')
plot(arr.mean,arr.range,main='Range-Mean Plot',xlab='mean',ylab='range')
dev.off()
load(file='createtable')
a<-table.start()
a<-table.row.start(a)
a<-table.element(a,'Standard Deviation-Mean Plot',4,TRUE)
a<-table.row.end(a)
a<-table.row.start(a)
a<-table.element(a,'Section',header=TRUE)
a<-table.element(a,'Mean',header=TRUE)
a<-table.element(a,'Standard Deviation',header=TRUE)
a<-table.element(a,'Range',header=TRUE)
a<-table.row.end(a)
for (j in 1:np) {
a<-table.row.start(a)
a<-table.element(a,j,header=TRUE)
a<-table.element(a,arr.mean[j])
a<-table.element(a,arr.sd[j] )
a<-table.element(a,arr.range[j] )
a<-table.row.end(a)
}
a<-table.end(a)
table.save(a,file='mytable.tab')
a<-table.start()
a<-table.row.start(a)
a<-table.element(a,'Regression: S.E.(k) = alpha + beta * Mean(k)',2,TRUE)
a<-table.row.end(a)
a<-table.row.start(a)
a<-table.element(a,'alpha',header=TRUE)
a<-table.element(a,lm1$coefficients[[1]])
a<-table.row.end(a)
a<-table.row.start(a)
a<-table.element(a,'beta',header=TRUE)
a<-table.element(a,lm1$coefficients[[2]])
a<-table.row.end(a)
a<-table.row.start(a)
a<-table.element(a,'S.D.',header=TRUE)
a<-table.element(a,summary(lm1)$coefficients[2,2])
a<-table.row.end(a)
a<-table.row.start(a)
a<-table.element(a,'T-STAT',header=TRUE)
a<-table.element(a,summary(lm1)$coefficients[2,3])
a<-table.row.end(a)
a<-table.row.start(a)
a<-table.element(a,'p-value',header=TRUE)
a<-table.element(a,summary(lm1)$coefficients[2,4])
a<-table.row.end(a)
a<-table.end(a)
table.save(a,file='mytable1.tab')
a<-table.start()
a<-table.row.start(a)
a<-table.element(a,'Regression: ln S.E.(k) = alpha + beta * ln Mean(k)',2,TRUE)
a<-table.row.end(a)
a<-table.row.start(a)
a<-table.element(a,'alpha',header=TRUE)
a<-table.element(a,lnlm1$coefficients[[1]])
a<-table.row.end(a)
a<-table.row.start(a)
a<-table.element(a,'beta',header=TRUE)
a<-table.element(a,lnlm1$coefficients[[2]])
a<-table.row.end(a)
a<-table.row.start(a)
a<-table.element(a,'S.D.',header=TRUE)
a<-table.element(a,summary(lnlm1)$coefficients[2,2])
a<-table.row.end(a)
a<-table.row.start(a)
a<-table.element(a,'T-STAT',header=TRUE)
a<-table.element(a,summary(lnlm1)$coefficients[2,3])
a<-table.row.end(a)
a<-table.row.start(a)
a<-table.element(a,'p-value',header=TRUE)
a<-table.element(a,summary(lnlm1)$coefficients[2,4])
a<-table.row.end(a)
a<-table.row.start(a)
a<-table.element(a,'Lambda',header=TRUE)
a<-table.element(a,1-lnlm1$coefficients[[2]])
a<-table.row.end(a)
a<-table.end(a)
table.save(a,file='mytable2.tab')