Free Statistics

of Irreproducible Research!

Author's title

Author*Unverified author*
R Software Modulerwasp_smp.wasp
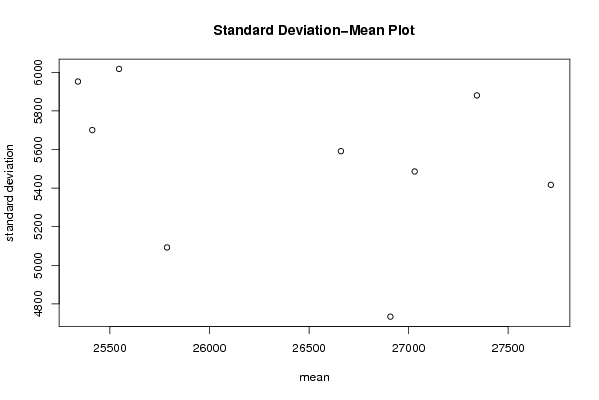
Title produced by softwareStandard Deviation-Mean Plot
Date of computationFri, 14 May 2010 17:48:39 +0000
Cite this page as followsStatistical Computations at FreeStatistics.org, Office for Research Development and Education, URL https://freestatistics.org/blog/index.php?v=date/2010/May/14/t1273859352ocy9maefi1nwh28.htm/, Retrieved Thu, 02 May 2024 17:12:00 +0000
Statistical Computations at FreeStatistics.org, Office for Research Development and Education, URL https://freestatistics.org/blog/index.php?pk=76001, Retrieved Thu, 02 May 2024 17:12:00 +0000
QR Codes:

Original text written by user:
IsPrivate?No (this computation is public)
User-defined keywordsKDGP2W83
Estimated Impact184
Family? (F = Feedback message, R = changed R code, M = changed R Module, P = changed Parameters, D = changed Data)
-       [Standard Deviation-Mean Plot] [Opgave 8 - Oef3/3...] [2010-05-14 17:48:39] [413e0fefcf22560c5655fbc122c1a3c2] [Current]
Feedback Forum

Post a new message
Dataseries X:
18450
21845
26488
22394
28057
25451
24872
33424
24052
28449
33533
37351
19969
21701
26249
24493
24603
26485
30723
34569
26689
26157
32064
38870
21337
19419
23166
28286
24570
24001
33151
24878
26804
28967
33311
40226
20504
23060
23562
27562
23940
24584
34303
25517
23494
29095
32903
34379
16991
21109
23740
25552
21752
20294
29009
25500
24166
26960
31222
38641
14672
17543
25453
32683
22449
22316
27595
25451
25421
25288
32568
35110
16052
22146
21198
19543
22084
23816
29961
26773
26635
26972
30207
38687
16974
21697
24179
23757
25013
24019
30345
24488
25156
25650
30923
37240
17466
19463
24352
26805
25236
24735
29356
31234
22724
28496
32857
37198


Summary of computational transaction
Raw Inputview raw input (R code)
Raw Outputview raw output of R engine
Computing time2 seconds
R Server'RServer@AstonUniversity' @ vre.aston.ac.uk

\begin{tabular}{lllllllll}
\hline
Summary of computational transaction \tabularnewline
Raw Input & view raw input (R code)  \tabularnewline
Raw Output & view raw output of R engine  \tabularnewline
Computing time & 2 seconds \tabularnewline
R Server & 'RServer@AstonUniversity' @ vre.aston.ac.uk \tabularnewline
\hline
\end{tabular}
%Source: https://freestatistics.org/blog/index.php?pk=76001&T=0

[TABLE]
[ROW][C]Summary of computational transaction[/C][/ROW]
[ROW][C]Raw Input[/C][C]view raw input (R code) [/C][/ROW]
[ROW][C]Raw Output[/C][C]view raw output of R engine [/C][/ROW]
[ROW][C]Computing time[/C][C]2 seconds[/C][/ROW]
[ROW][C]R Server[/C][C]'RServer@AstonUniversity' @ vre.aston.ac.uk[/C][/ROW]
[/TABLE]
Source: https://freestatistics.org/blog/index.php?pk=76001&T=0

Globally Unique Identifier (entire table): ba.freestatistics.org/blog/index.php?pk=76001&T=0

As an alternative you can also use a QR Code:  

The GUIDs for individual cells are displayed in the table below:

Summary of computational transaction
Raw Inputview raw input (R code)
Raw Outputview raw output of R engine
Computing time2 seconds
R Server'RServer@AstonUniversity' @ vre.aston.ac.uk


Standard Deviation-Mean Plot
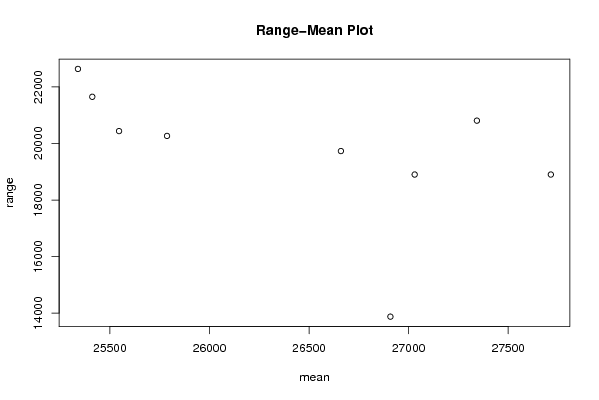
SectionMeanStandard DeviationRange
127030.55486.0910657605918901
227714.33333333335416.7235707966718901
3273435880.4961293476520807
426908.58333333334733.5061473467713875
525411.33333333335700.8074919791921650
625545.756017.624163088120438
725339.55952.3237555520422635
825786.755092.4001507594220266
926660.16666666675591.4941218918919732

\begin{tabular}{lllllllll}
\hline
Standard Deviation-Mean Plot \tabularnewline
Section & Mean & Standard Deviation & Range \tabularnewline
1 & 27030.5 & 5486.09106576059 & 18901 \tabularnewline
2 & 27714.3333333333 & 5416.72357079667 & 18901 \tabularnewline
3 & 27343 & 5880.49612934765 & 20807 \tabularnewline
4 & 26908.5833333333 & 4733.50614734677 & 13875 \tabularnewline
5 & 25411.3333333333 & 5700.80749197919 & 21650 \tabularnewline
6 & 25545.75 & 6017.6241630881 & 20438 \tabularnewline
7 & 25339.5 & 5952.32375555204 & 22635 \tabularnewline
8 & 25786.75 & 5092.40015075942 & 20266 \tabularnewline
9 & 26660.1666666667 & 5591.49412189189 & 19732 \tabularnewline
\hline
\end{tabular}
%Source: https://freestatistics.org/blog/index.php?pk=76001&T=1

[TABLE]
[ROW][C]Standard Deviation-Mean Plot[/C][/ROW]
[ROW][C]Section[/C][C]Mean[/C][C]Standard Deviation[/C][C]Range[/C][/ROW]
[ROW][C]1[/C][C]27030.5[/C][C]5486.09106576059[/C][C]18901[/C][/ROW]
[ROW][C]2[/C][C]27714.3333333333[/C][C]5416.72357079667[/C][C]18901[/C][/ROW]
[ROW][C]3[/C][C]27343[/C][C]5880.49612934765[/C][C]20807[/C][/ROW]
[ROW][C]4[/C][C]26908.5833333333[/C][C]4733.50614734677[/C][C]13875[/C][/ROW]
[ROW][C]5[/C][C]25411.3333333333[/C][C]5700.80749197919[/C][C]21650[/C][/ROW]
[ROW][C]6[/C][C]25545.75[/C][C]6017.6241630881[/C][C]20438[/C][/ROW]
[ROW][C]7[/C][C]25339.5[/C][C]5952.32375555204[/C][C]22635[/C][/ROW]
[ROW][C]8[/C][C]25786.75[/C][C]5092.40015075942[/C][C]20266[/C][/ROW]
[ROW][C]9[/C][C]26660.1666666667[/C][C]5591.49412189189[/C][C]19732[/C][/ROW]
[/TABLE]
Source: https://freestatistics.org/blog/index.php?pk=76001&T=1

Globally Unique Identifier (entire table): ba.freestatistics.org/blog/index.php?pk=76001&T=1

As an alternative you can also use a QR Code:  

The GUIDs for individual cells are displayed in the table below:

Standard Deviation-Mean Plot
SectionMeanStandard DeviationRange
127030.55486.0910657605918901
227714.33333333335416.7235707966718901
3273435880.4961293476520807
426908.58333333334733.5061473467713875
525411.33333333335700.8074919791921650
625545.756017.624163088120438
725339.55952.3237555520422635
825786.755092.4001507594220266
926660.16666666675591.4941218918919732


Regression: S.E.(k) = alpha + beta * Mean(k)
alpha9583.0932121558
beta-0.15300910685471
S.D.0.165700530502046
T-STAT-0.923407465209179
p-value0.386517789262134

\begin{tabular}{lllllllll}
\hline
Regression: S.E.(k) = alpha + beta * Mean(k) \tabularnewline
alpha & 9583.0932121558 \tabularnewline
beta & -0.15300910685471 \tabularnewline
S.D. & 0.165700530502046 \tabularnewline
T-STAT & -0.923407465209179 \tabularnewline
p-value & 0.386517789262134 \tabularnewline
\hline
\end{tabular}
%Source: https://freestatistics.org/blog/index.php?pk=76001&T=2

[TABLE]
[ROW][C]Regression: S.E.(k) = alpha + beta * Mean(k)[/C][/ROW]
[ROW][C]alpha[/C][C]9583.0932121558[/C][/ROW]
[ROW][C]beta[/C][C]-0.15300910685471[/C][/ROW]
[ROW][C]S.D.[/C][C]0.165700530502046[/C][/ROW]
[ROW][C]T-STAT[/C][C]-0.923407465209179[/C][/ROW]
[ROW][C]p-value[/C][C]0.386517789262134[/C][/ROW]
[/TABLE]
Source: https://freestatistics.org/blog/index.php?pk=76001&T=2

Globally Unique Identifier (entire table): ba.freestatistics.org/blog/index.php?pk=76001&T=2

As an alternative you can also use a QR Code:  

The GUIDs for individual cells are displayed in the table below:

Regression: S.E.(k) = alpha + beta * Mean(k)
alpha9583.0932121558
beta-0.15300910685471
S.D.0.165700530502046
T-STAT-0.923407465209179
p-value0.386517789262134


Regression: ln S.E.(k) = alpha + beta * ln Mean(k)
alpha16.1227315683148
beta-0.73718424422472
S.D.0.816242089875327
T-STAT-0.903144120315234
p-value0.396463469319517
Lambda1.73718424422472

\begin{tabular}{lllllllll}
\hline
Regression: ln S.E.(k) = alpha + beta * ln Mean(k) \tabularnewline
alpha & 16.1227315683148 \tabularnewline
beta & -0.73718424422472 \tabularnewline
S.D. & 0.816242089875327 \tabularnewline
T-STAT & -0.903144120315234 \tabularnewline
p-value & 0.396463469319517 \tabularnewline
Lambda & 1.73718424422472 \tabularnewline
\hline
\end{tabular}
%Source: https://freestatistics.org/blog/index.php?pk=76001&T=3

[TABLE]
[ROW][C]Regression: ln S.E.(k) = alpha + beta * ln Mean(k)[/C][/ROW]
[ROW][C]alpha[/C][C]16.1227315683148[/C][/ROW]
[ROW][C]beta[/C][C]-0.73718424422472[/C][/ROW]
[ROW][C]S.D.[/C][C]0.816242089875327[/C][/ROW]
[ROW][C]T-STAT[/C][C]-0.903144120315234[/C][/ROW]
[ROW][C]p-value[/C][C]0.396463469319517[/C][/ROW]
[ROW][C]Lambda[/C][C]1.73718424422472[/C][/ROW]
[/TABLE]
Source: https://freestatistics.org/blog/index.php?pk=76001&T=3

Globally Unique Identifier (entire table): ba.freestatistics.org/blog/index.php?pk=76001&T=3

As an alternative you can also use a QR Code:  

The GUIDs for individual cells are displayed in the table below:

Regression: ln S.E.(k) = alpha + beta * ln Mean(k)
alpha16.1227315683148
beta-0.73718424422472
S.D.0.816242089875327
T-STAT-0.903144120315234
p-value0.396463469319517
Lambda1.73718424422472


Parameters (Session):
par1 = 12 ;
Parameters (R input):
par1 = 12 ;
R code (references can be found in the software module):
par1 <- as.numeric(par1)
(n <- length(x))
(np <- floor(n / par1))
arr <- array(NA,dim=c(par1,np))
j <- 0
k <- 1
for (i in 1:(np*par1))
{
j = j + 1
arr[j,k] <- x[i]
if (j == par1) {
j = 0
k=k+1
}
}
arr
arr.mean <- array(NA,dim=np)
arr.sd <- array(NA,dim=np)
arr.range <- array(NA,dim=np)
for (j in 1:np)
{
arr.mean[j] <- mean(arr[,j],na.rm=TRUE)
arr.sd[j] <- sd(arr[,j],na.rm=TRUE)
arr.range[j] <- max(arr[,j],na.rm=TRUE) - min(arr[,j],na.rm=TRUE)
}
arr.mean
arr.sd
arr.range
(lm1 <- lm(arr.sd~arr.mean))
(lnlm1 <- lm(log(arr.sd)~log(arr.mean)))
(lm2 <- lm(arr.range~arr.mean))
bitmap(file='test1.png')
plot(arr.mean,arr.sd,main='Standard Deviation-Mean Plot',xlab='mean',ylab='standard deviation')
dev.off()
bitmap(file='test2.png')
plot(arr.mean,arr.range,main='Range-Mean Plot',xlab='mean',ylab='range')
dev.off()
load(file='createtable')
a<-table.start()
a<-table.row.start(a)
a<-table.element(a,'Standard Deviation-Mean Plot',4,TRUE)
a<-table.row.end(a)
a<-table.row.start(a)
a<-table.element(a,'Section',header=TRUE)
a<-table.element(a,'Mean',header=TRUE)
a<-table.element(a,'Standard Deviation',header=TRUE)
a<-table.element(a,'Range',header=TRUE)
a<-table.row.end(a)
for (j in 1:np) {
a<-table.row.start(a)
a<-table.element(a,j,header=TRUE)
a<-table.element(a,arr.mean[j])
a<-table.element(a,arr.sd[j] )
a<-table.element(a,arr.range[j] )
a<-table.row.end(a)
}
a<-table.end(a)
table.save(a,file='mytable.tab')
a<-table.start()
a<-table.row.start(a)
a<-table.element(a,'Regression: S.E.(k) = alpha + beta * Mean(k)',2,TRUE)
a<-table.row.end(a)
a<-table.row.start(a)
a<-table.element(a,'alpha',header=TRUE)
a<-table.element(a,lm1$coefficients[[1]])
a<-table.row.end(a)
a<-table.row.start(a)
a<-table.element(a,'beta',header=TRUE)
a<-table.element(a,lm1$coefficients[[2]])
a<-table.row.end(a)
a<-table.row.start(a)
a<-table.element(a,'S.D.',header=TRUE)
a<-table.element(a,summary(lm1)$coefficients[2,2])
a<-table.row.end(a)
a<-table.row.start(a)
a<-table.element(a,'T-STAT',header=TRUE)
a<-table.element(a,summary(lm1)$coefficients[2,3])
a<-table.row.end(a)
a<-table.row.start(a)
a<-table.element(a,'p-value',header=TRUE)
a<-table.element(a,summary(lm1)$coefficients[2,4])
a<-table.row.end(a)
a<-table.end(a)
table.save(a,file='mytable1.tab')
a<-table.start()
a<-table.row.start(a)
a<-table.element(a,'Regression: ln S.E.(k) = alpha + beta * ln Mean(k)',2,TRUE)
a<-table.row.end(a)
a<-table.row.start(a)
a<-table.element(a,'alpha',header=TRUE)
a<-table.element(a,lnlm1$coefficients[[1]])
a<-table.row.end(a)
a<-table.row.start(a)
a<-table.element(a,'beta',header=TRUE)
a<-table.element(a,lnlm1$coefficients[[2]])
a<-table.row.end(a)
a<-table.row.start(a)
a<-table.element(a,'S.D.',header=TRUE)
a<-table.element(a,summary(lnlm1)$coefficients[2,2])
a<-table.row.end(a)
a<-table.row.start(a)
a<-table.element(a,'T-STAT',header=TRUE)
a<-table.element(a,summary(lnlm1)$coefficients[2,3])
a<-table.row.end(a)
a<-table.row.start(a)
a<-table.element(a,'p-value',header=TRUE)
a<-table.element(a,summary(lnlm1)$coefficients[2,4])
a<-table.row.end(a)
a<-table.row.start(a)
a<-table.element(a,'Lambda',header=TRUE)
a<-table.element(a,1-lnlm1$coefficients[[2]])
a<-table.row.end(a)
a<-table.end(a)
table.save(a,file='mytable2.tab')