Free Statistics

of Irreproducible Research!

Author's title

Author*Unverified author*
R Software Modulerwasp_autocorrelation.wasp
Title produced by software(Partial) Autocorrelation Function
Date of computationMon, 03 May 2010 20:25:24 +0000
Cite this page as followsStatistical Computations at FreeStatistics.org, Office for Research Development and Education, URL https://freestatistics.org/blog/index.php?v=date/2010/May/03/t1272918414s2d4nh4eplqq96k.htm/, Retrieved Thu, 25 Apr 2024 05:39:25 +0000
Statistical Computations at FreeStatistics.org, Office for Research Development and Education, URL https://freestatistics.org/blog/index.php?pk=75309, Retrieved Thu, 25 Apr 2024 05:39:25 +0000
QR Codes:

Original text written by user:
IsPrivate?No (this computation is public)
User-defined keywordsKDGP2W21
Estimated Impact119
Family? (F = Feedback message, R = changed R code, M = changed R Module, P = changed Parameters, D = changed Data)
-     [(Partial) Autocorrelation Function] [opgave6bisoef2] [2010-05-03 20:20:37] [74be16979710d4c4e7c6647856088456]
-   PD    [(Partial) Autocorrelation Function] [opgave6bisoef2] [2010-05-03 20:25:24] [d41d8cd98f00b204e9800998ecf8427e] [Current]
Feedback Forum

Post a new message
Dataseries X:
196.9
192.1
201.8
186.9
218
214.4
227.5
204.1
225.8
223.7
244.7
243.9
257.3
234.5
251.4
243.8
247.4
245.3
262.5
270
259.9
262.2
244.9
249.3
268.2
231.2
264.3
252.7
275.5
261.5
275.5
272.3
268.6
270.4
267.7
275
272.6
248.6
279.4
270.5
292.8
297.8
296.8
290.9
282.8
312.8
303.2
301.4
289.8
279.6
302.2
299.1
319.7
310.9
315.2
338.5
315.6
321.2
318.5
342.7
261.4
287
331.5
326.9
338.6
337
358.4
344.5
345.7
344.1
317.4
354.5
345.2
314.1
352.5
361.2
365.9
332.5
364
359.1
345.6
366.9
370.2
359.9
366.6
336.3
368.5
374.2
384.3
358.9
407.7
433.3
404.7
392.7
409.7
416.5
414.3
404.3
421.4
372.6
404.7
420.2
438.4
449.1
445.8
413.8
420.5
442.3
438.9
394.5
416.8
402.9
424.5
432.3
484.1
492.7
496.3
471.9
491.2
512.9
482.4
407.9
448.5
431.1
498.8
497.1
517.1
487.7
512.5
550.1
532.5
524.1
515.7
461
529.3
467.4
559.8
536.5
531.9
546.5
547.4
536.1
482.8
551
532.9
484.1
554.8
537
558
511.4
502.9
558.6
545.1
574.3
542.2
600
588.6
524.4
618.5
580.9
557.2
571.2
597.5
601.7
558.9
600.9
601
615.7
578.1
495.9
526.8
522.1
605.1
574.4
609.7
580.7
565.1
590.7
571.5
601.3
567.3
467.9
588.9
579.4
502.6
568.7
616
586.2
575.5
599.9
568.2
516
493.4
496.8
529.9
491.7
543.2
490.8
554.7
625.7
605
645.2
645.2
611.8
600.3
549.8
635.5
617.7
643.5
485.7
689.5
692
677.3
704.7
668.6
717.8
689.8
640.4
675.2
528.1
538
527.2
655.6
650.6
623.7
748.4
727.4
750.5
678.9
659.5
691.9
639.8
663.8
572.9
592.5
734.8
696.1
589.2
662.9
661.2
672.1
583.7
705.5
631
733.3
674.9
695.5
634.1
630.6
635.2
554.1
623.9
679.3
565.6
564.1
637.2
650.8
602.7
587.5
619.2
616.5
637.9
557.9
594
668.7
603.3
674.5
573.4
706
693.7
627.5
550.7
592.3
660.2
597.3
641
663.6
595.9
638.4
665.4
671.4
637
685.7
705.8
704.8
734.4
674.2
748.6
763.4
658
627.5
528.9
488.3
575.5
735.6
685.3
613.6
629.5
634.7
652.6
728.3
634.3
690.7
676.3
675.4
595.6
712.4
735.8
544.4
567
510
564
630.7
496.7
660.9
601.2
655.2
591.6
606.1
560.7
368.3
371.6
413.9
413.9
389
399.2
429.8
395.6
472
486
525
396
511
525
492
517
525
474
539
468
543
532
565
535
534
546
494
552
511
451
537
494
549
544
598
583
582
589
578
561
592
504
545
547
585
562
520
581
590
562
548
567
542
473
531
462
479
533
552
547
562
524
479
445
406
475
589
495
484
536
555
565
564
573
569
588
546
508
560
558
516
549
595
586
597
592
538
590
576
451
538
555
532
530
553
626
601
573
569
562
468
483
460
411
458
455
600
605
545
549
415
568
577
517
558
518
489
502
569
540
550
557
542
542
582
525
584
562
639
613
604
613
625
654
638


Summary of computational transaction
Raw Inputview raw input (R code)
Raw Outputview raw output of R engine
Computing time1 seconds
R Server'Gwilym Jenkins' @ 72.249.127.135

\begin{tabular}{lllllllll}
\hline
Summary of computational transaction \tabularnewline
Raw Input & view raw input (R code)  \tabularnewline
Raw Output & view raw output of R engine  \tabularnewline
Computing time & 1 seconds \tabularnewline
R Server & 'Gwilym Jenkins' @ 72.249.127.135 \tabularnewline
\hline
\end{tabular}
%Source: https://freestatistics.org/blog/index.php?pk=75309&T=0

[TABLE]
[ROW][C]Summary of computational transaction[/C][/ROW]
[ROW][C]Raw Input[/C][C]view raw input (R code) [/C][/ROW]
[ROW][C]Raw Output[/C][C]view raw output of R engine [/C][/ROW]
[ROW][C]Computing time[/C][C]1 seconds[/C][/ROW]
[ROW][C]R Server[/C][C]'Gwilym Jenkins' @ 72.249.127.135[/C][/ROW]
[/TABLE]
Source: https://freestatistics.org/blog/index.php?pk=75309&T=0

Globally Unique Identifier (entire table): ba.freestatistics.org/blog/index.php?pk=75309&T=0

As an alternative you can also use a QR Code:  

The GUIDs for individual cells are displayed in the table below:

Summary of computational transaction
Raw Inputview raw input (R code)
Raw Outputview raw output of R engine
Computing time1 seconds
R Server'Gwilym Jenkins' @ 72.249.127.135


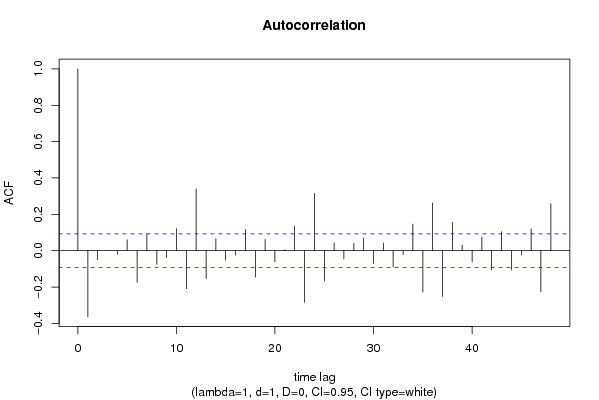
Autocorrelation Function
Time lag kACF(k)T-STATP-value
1-0.363162-7.7380
2-0.050413-1.07420.14166
30.0014920.03180.487327
4-0.019836-0.42260.336377
50.0594371.26640.103003
6-0.174167-3.7110.000116
70.0935761.99390.023383
8-0.075367-1.60590.0545
9-0.039641-0.84460.19938
100.1215812.59060.004945
11-0.20925-4.45855e-06
120.3398257.24070
13-0.153489-3.27040.000578
140.0658931.4040.0805
15-0.052778-1.12460.130686
16-0.025138-0.53560.29624
170.116732.48720.006617
18-0.146333-3.1180.000968
190.0616021.31260.094995
20-0.060663-1.29260.098411
210.0046540.09920.460523
220.1348972.87430.00212
23-0.284051-6.05240
240.3147986.70750
25-0.166075-3.53860.000222
260.0438990.93540.17505
27-0.044741-0.95330.170468
280.0399880.8520.197322
290.0693711.47810.070036
30-0.070145-1.49460.067856
310.0415530.88540.18821
32-0.089773-1.91280.0282
33-0.022411-0.47750.316615
340.1463843.1190.000965
35-0.227612-4.84981e-06
360.262475.59250
37-0.252455-5.37910
380.1559673.32320.000481
390.029910.63730.262127
40-0.06196-1.32020.093718
410.0747041.59170.056069
42-0.104796-2.23290.013021
430.1036892.20930.013825
44-0.107018-2.28030.011527
45-0.022719-0.48410.314282
460.1200422.55780.005429
47-0.22698-4.83631e-06
480.2587115.51240

\begin{tabular}{lllllllll}
\hline
Autocorrelation Function \tabularnewline
Time lag k & ACF(k) & T-STAT & P-value \tabularnewline
1 & -0.363162 & -7.738 & 0 \tabularnewline
2 & -0.050413 & -1.0742 & 0.14166 \tabularnewline
3 & 0.001492 & 0.0318 & 0.487327 \tabularnewline
4 & -0.019836 & -0.4226 & 0.336377 \tabularnewline
5 & 0.059437 & 1.2664 & 0.103003 \tabularnewline
6 & -0.174167 & -3.711 & 0.000116 \tabularnewline
7 & 0.093576 & 1.9939 & 0.023383 \tabularnewline
8 & -0.075367 & -1.6059 & 0.0545 \tabularnewline
9 & -0.039641 & -0.8446 & 0.19938 \tabularnewline
10 & 0.121581 & 2.5906 & 0.004945 \tabularnewline
11 & -0.20925 & -4.4585 & 5e-06 \tabularnewline
12 & 0.339825 & 7.2407 & 0 \tabularnewline
13 & -0.153489 & -3.2704 & 0.000578 \tabularnewline
14 & 0.065893 & 1.404 & 0.0805 \tabularnewline
15 & -0.052778 & -1.1246 & 0.130686 \tabularnewline
16 & -0.025138 & -0.5356 & 0.29624 \tabularnewline
17 & 0.11673 & 2.4872 & 0.006617 \tabularnewline
18 & -0.146333 & -3.118 & 0.000968 \tabularnewline
19 & 0.061602 & 1.3126 & 0.094995 \tabularnewline
20 & -0.060663 & -1.2926 & 0.098411 \tabularnewline
21 & 0.004654 & 0.0992 & 0.460523 \tabularnewline
22 & 0.134897 & 2.8743 & 0.00212 \tabularnewline
23 & -0.284051 & -6.0524 & 0 \tabularnewline
24 & 0.314798 & 6.7075 & 0 \tabularnewline
25 & -0.166075 & -3.5386 & 0.000222 \tabularnewline
26 & 0.043899 & 0.9354 & 0.17505 \tabularnewline
27 & -0.044741 & -0.9533 & 0.170468 \tabularnewline
28 & 0.039988 & 0.852 & 0.197322 \tabularnewline
29 & 0.069371 & 1.4781 & 0.070036 \tabularnewline
30 & -0.070145 & -1.4946 & 0.067856 \tabularnewline
31 & 0.041553 & 0.8854 & 0.18821 \tabularnewline
32 & -0.089773 & -1.9128 & 0.0282 \tabularnewline
33 & -0.022411 & -0.4775 & 0.316615 \tabularnewline
34 & 0.146384 & 3.119 & 0.000965 \tabularnewline
35 & -0.227612 & -4.8498 & 1e-06 \tabularnewline
36 & 0.26247 & 5.5925 & 0 \tabularnewline
37 & -0.252455 & -5.3791 & 0 \tabularnewline
38 & 0.155967 & 3.3232 & 0.000481 \tabularnewline
39 & 0.02991 & 0.6373 & 0.262127 \tabularnewline
40 & -0.06196 & -1.3202 & 0.093718 \tabularnewline
41 & 0.074704 & 1.5917 & 0.056069 \tabularnewline
42 & -0.104796 & -2.2329 & 0.013021 \tabularnewline
43 & 0.103689 & 2.2093 & 0.013825 \tabularnewline
44 & -0.107018 & -2.2803 & 0.011527 \tabularnewline
45 & -0.022719 & -0.4841 & 0.314282 \tabularnewline
46 & 0.120042 & 2.5578 & 0.005429 \tabularnewline
47 & -0.22698 & -4.8363 & 1e-06 \tabularnewline
48 & 0.258711 & 5.5124 & 0 \tabularnewline
\hline
\end{tabular}
%Source: https://freestatistics.org/blog/index.php?pk=75309&T=1

[TABLE]
[ROW][C]Autocorrelation Function[/C][/ROW]
[ROW][C]Time lag k[/C][C]ACF(k)[/C][C]T-STAT[/C][C]P-value[/C][/ROW]
[ROW][C]1[/C][C]-0.363162[/C][C]-7.738[/C][C]0[/C][/ROW]
[ROW][C]2[/C][C]-0.050413[/C][C]-1.0742[/C][C]0.14166[/C][/ROW]
[ROW][C]3[/C][C]0.001492[/C][C]0.0318[/C][C]0.487327[/C][/ROW]
[ROW][C]4[/C][C]-0.019836[/C][C]-0.4226[/C][C]0.336377[/C][/ROW]
[ROW][C]5[/C][C]0.059437[/C][C]1.2664[/C][C]0.103003[/C][/ROW]
[ROW][C]6[/C][C]-0.174167[/C][C]-3.711[/C][C]0.000116[/C][/ROW]
[ROW][C]7[/C][C]0.093576[/C][C]1.9939[/C][C]0.023383[/C][/ROW]
[ROW][C]8[/C][C]-0.075367[/C][C]-1.6059[/C][C]0.0545[/C][/ROW]
[ROW][C]9[/C][C]-0.039641[/C][C]-0.8446[/C][C]0.19938[/C][/ROW]
[ROW][C]10[/C][C]0.121581[/C][C]2.5906[/C][C]0.004945[/C][/ROW]
[ROW][C]11[/C][C]-0.20925[/C][C]-4.4585[/C][C]5e-06[/C][/ROW]
[ROW][C]12[/C][C]0.339825[/C][C]7.2407[/C][C]0[/C][/ROW]
[ROW][C]13[/C][C]-0.153489[/C][C]-3.2704[/C][C]0.000578[/C][/ROW]
[ROW][C]14[/C][C]0.065893[/C][C]1.404[/C][C]0.0805[/C][/ROW]
[ROW][C]15[/C][C]-0.052778[/C][C]-1.1246[/C][C]0.130686[/C][/ROW]
[ROW][C]16[/C][C]-0.025138[/C][C]-0.5356[/C][C]0.29624[/C][/ROW]
[ROW][C]17[/C][C]0.11673[/C][C]2.4872[/C][C]0.006617[/C][/ROW]
[ROW][C]18[/C][C]-0.146333[/C][C]-3.118[/C][C]0.000968[/C][/ROW]
[ROW][C]19[/C][C]0.061602[/C][C]1.3126[/C][C]0.094995[/C][/ROW]
[ROW][C]20[/C][C]-0.060663[/C][C]-1.2926[/C][C]0.098411[/C][/ROW]
[ROW][C]21[/C][C]0.004654[/C][C]0.0992[/C][C]0.460523[/C][/ROW]
[ROW][C]22[/C][C]0.134897[/C][C]2.8743[/C][C]0.00212[/C][/ROW]
[ROW][C]23[/C][C]-0.284051[/C][C]-6.0524[/C][C]0[/C][/ROW]
[ROW][C]24[/C][C]0.314798[/C][C]6.7075[/C][C]0[/C][/ROW]
[ROW][C]25[/C][C]-0.166075[/C][C]-3.5386[/C][C]0.000222[/C][/ROW]
[ROW][C]26[/C][C]0.043899[/C][C]0.9354[/C][C]0.17505[/C][/ROW]
[ROW][C]27[/C][C]-0.044741[/C][C]-0.9533[/C][C]0.170468[/C][/ROW]
[ROW][C]28[/C][C]0.039988[/C][C]0.852[/C][C]0.197322[/C][/ROW]
[ROW][C]29[/C][C]0.069371[/C][C]1.4781[/C][C]0.070036[/C][/ROW]
[ROW][C]30[/C][C]-0.070145[/C][C]-1.4946[/C][C]0.067856[/C][/ROW]
[ROW][C]31[/C][C]0.041553[/C][C]0.8854[/C][C]0.18821[/C][/ROW]
[ROW][C]32[/C][C]-0.089773[/C][C]-1.9128[/C][C]0.0282[/C][/ROW]
[ROW][C]33[/C][C]-0.022411[/C][C]-0.4775[/C][C]0.316615[/C][/ROW]
[ROW][C]34[/C][C]0.146384[/C][C]3.119[/C][C]0.000965[/C][/ROW]
[ROW][C]35[/C][C]-0.227612[/C][C]-4.8498[/C][C]1e-06[/C][/ROW]
[ROW][C]36[/C][C]0.26247[/C][C]5.5925[/C][C]0[/C][/ROW]
[ROW][C]37[/C][C]-0.252455[/C][C]-5.3791[/C][C]0[/C][/ROW]
[ROW][C]38[/C][C]0.155967[/C][C]3.3232[/C][C]0.000481[/C][/ROW]
[ROW][C]39[/C][C]0.02991[/C][C]0.6373[/C][C]0.262127[/C][/ROW]
[ROW][C]40[/C][C]-0.06196[/C][C]-1.3202[/C][C]0.093718[/C][/ROW]
[ROW][C]41[/C][C]0.074704[/C][C]1.5917[/C][C]0.056069[/C][/ROW]
[ROW][C]42[/C][C]-0.104796[/C][C]-2.2329[/C][C]0.013021[/C][/ROW]
[ROW][C]43[/C][C]0.103689[/C][C]2.2093[/C][C]0.013825[/C][/ROW]
[ROW][C]44[/C][C]-0.107018[/C][C]-2.2803[/C][C]0.011527[/C][/ROW]
[ROW][C]45[/C][C]-0.022719[/C][C]-0.4841[/C][C]0.314282[/C][/ROW]
[ROW][C]46[/C][C]0.120042[/C][C]2.5578[/C][C]0.005429[/C][/ROW]
[ROW][C]47[/C][C]-0.22698[/C][C]-4.8363[/C][C]1e-06[/C][/ROW]
[ROW][C]48[/C][C]0.258711[/C][C]5.5124[/C][C]0[/C][/ROW]
[/TABLE]
Source: https://freestatistics.org/blog/index.php?pk=75309&T=1

Globally Unique Identifier (entire table): ba.freestatistics.org/blog/index.php?pk=75309&T=1

As an alternative you can also use a QR Code:  

The GUIDs for individual cells are displayed in the table below:

Autocorrelation Function
Time lag kACF(k)T-STATP-value
1-0.363162-7.7380
2-0.050413-1.07420.14166
30.0014920.03180.487327
4-0.019836-0.42260.336377
50.0594371.26640.103003
6-0.174167-3.7110.000116
70.0935761.99390.023383
8-0.075367-1.60590.0545
9-0.039641-0.84460.19938
100.1215812.59060.004945
11-0.20925-4.45855e-06
120.3398257.24070
13-0.153489-3.27040.000578
140.0658931.4040.0805
15-0.052778-1.12460.130686
16-0.025138-0.53560.29624
170.116732.48720.006617
18-0.146333-3.1180.000968
190.0616021.31260.094995
20-0.060663-1.29260.098411
210.0046540.09920.460523
220.1348972.87430.00212
23-0.284051-6.05240
240.3147986.70750
25-0.166075-3.53860.000222
260.0438990.93540.17505
27-0.044741-0.95330.170468
280.0399880.8520.197322
290.0693711.47810.070036
30-0.070145-1.49460.067856
310.0415530.88540.18821
32-0.089773-1.91280.0282
33-0.022411-0.47750.316615
340.1463843.1190.000965
35-0.227612-4.84981e-06
360.262475.59250
37-0.252455-5.37910
380.1559673.32320.000481
390.029910.63730.262127
40-0.06196-1.32020.093718
410.0747041.59170.056069
42-0.104796-2.23290.013021
430.1036892.20930.013825
44-0.107018-2.28030.011527
45-0.022719-0.48410.314282
460.1200422.55780.005429
47-0.22698-4.83631e-06
480.2587115.51240


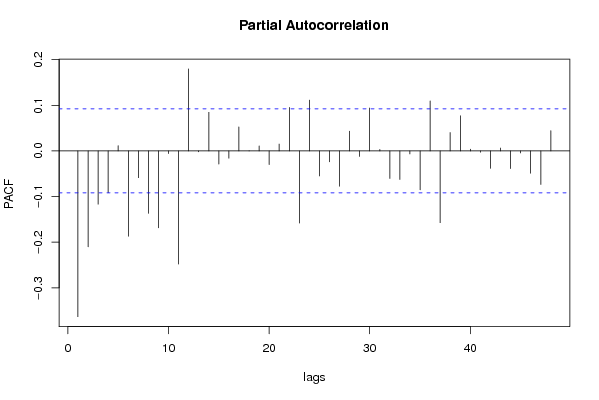
Partial Autocorrelation Function
Time lag kPACF(k)T-STATP-value
1-0.363162-7.7380
2-0.209995-4.47445e-06
3-0.116799-2.48870.00659
4-0.091305-1.94550.026168
50.0114150.24320.403971
6-0.186786-3.97994e-05
7-0.058624-1.24910.106135
8-0.136573-2.910.001896
9-0.168528-3.59090.000183
10-0.005613-0.11960.452427
11-0.247924-5.28260
120.1797063.8297.3e-05
13-0.001886-0.04020.483979
140.0845941.80250.036068
15-0.028833-0.61440.269644
16-0.016018-0.34130.366517
170.052751.1240.130814
180.0004050.00860.496559
190.0110370.23520.407094
20-0.029877-0.63660.262354
210.015160.3230.373416
220.095392.03250.021342
23-0.157985-3.36620.000413
240.1113812.37320.009025
25-0.054737-1.16630.122051
26-0.023789-0.50690.306246
27-0.077183-1.64460.050376
280.0432340.92120.178716
29-0.012069-0.25720.398589
300.0941222.00550.022752
310.0032840.070.47212
32-0.060132-1.28120.10038
33-0.062436-1.33030.092037
34-0.006681-0.14230.443436
35-0.085132-1.81390.035174
360.1095562.33430.010007
37-0.157286-3.35130.000436
380.0403550.85990.19516
390.076951.63960.050892
400.0038540.08210.467296
41-0.002817-0.060.476083
42-0.038179-0.81350.208181
430.0062340.13280.447193
44-0.038576-0.82190.205769
45-0.004327-0.09220.463291
46-0.048755-1.03880.149716
47-0.073519-1.56650.058965
480.0444020.94610.172302

\begin{tabular}{lllllllll}
\hline
Partial Autocorrelation Function \tabularnewline
Time lag k & PACF(k) & T-STAT & P-value \tabularnewline
1 & -0.363162 & -7.738 & 0 \tabularnewline
2 & -0.209995 & -4.4744 & 5e-06 \tabularnewline
3 & -0.116799 & -2.4887 & 0.00659 \tabularnewline
4 & -0.091305 & -1.9455 & 0.026168 \tabularnewline
5 & 0.011415 & 0.2432 & 0.403971 \tabularnewline
6 & -0.186786 & -3.9799 & 4e-05 \tabularnewline
7 & -0.058624 & -1.2491 & 0.106135 \tabularnewline
8 & -0.136573 & -2.91 & 0.001896 \tabularnewline
9 & -0.168528 & -3.5909 & 0.000183 \tabularnewline
10 & -0.005613 & -0.1196 & 0.452427 \tabularnewline
11 & -0.247924 & -5.2826 & 0 \tabularnewline
12 & 0.179706 & 3.829 & 7.3e-05 \tabularnewline
13 & -0.001886 & -0.0402 & 0.483979 \tabularnewline
14 & 0.084594 & 1.8025 & 0.036068 \tabularnewline
15 & -0.028833 & -0.6144 & 0.269644 \tabularnewline
16 & -0.016018 & -0.3413 & 0.366517 \tabularnewline
17 & 0.05275 & 1.124 & 0.130814 \tabularnewline
18 & 0.000405 & 0.0086 & 0.496559 \tabularnewline
19 & 0.011037 & 0.2352 & 0.407094 \tabularnewline
20 & -0.029877 & -0.6366 & 0.262354 \tabularnewline
21 & 0.01516 & 0.323 & 0.373416 \tabularnewline
22 & 0.09539 & 2.0325 & 0.021342 \tabularnewline
23 & -0.157985 & -3.3662 & 0.000413 \tabularnewline
24 & 0.111381 & 2.3732 & 0.009025 \tabularnewline
25 & -0.054737 & -1.1663 & 0.122051 \tabularnewline
26 & -0.023789 & -0.5069 & 0.306246 \tabularnewline
27 & -0.077183 & -1.6446 & 0.050376 \tabularnewline
28 & 0.043234 & 0.9212 & 0.178716 \tabularnewline
29 & -0.012069 & -0.2572 & 0.398589 \tabularnewline
30 & 0.094122 & 2.0055 & 0.022752 \tabularnewline
31 & 0.003284 & 0.07 & 0.47212 \tabularnewline
32 & -0.060132 & -1.2812 & 0.10038 \tabularnewline
33 & -0.062436 & -1.3303 & 0.092037 \tabularnewline
34 & -0.006681 & -0.1423 & 0.443436 \tabularnewline
35 & -0.085132 & -1.8139 & 0.035174 \tabularnewline
36 & 0.109556 & 2.3343 & 0.010007 \tabularnewline
37 & -0.157286 & -3.3513 & 0.000436 \tabularnewline
38 & 0.040355 & 0.8599 & 0.19516 \tabularnewline
39 & 0.07695 & 1.6396 & 0.050892 \tabularnewline
40 & 0.003854 & 0.0821 & 0.467296 \tabularnewline
41 & -0.002817 & -0.06 & 0.476083 \tabularnewline
42 & -0.038179 & -0.8135 & 0.208181 \tabularnewline
43 & 0.006234 & 0.1328 & 0.447193 \tabularnewline
44 & -0.038576 & -0.8219 & 0.205769 \tabularnewline
45 & -0.004327 & -0.0922 & 0.463291 \tabularnewline
46 & -0.048755 & -1.0388 & 0.149716 \tabularnewline
47 & -0.073519 & -1.5665 & 0.058965 \tabularnewline
48 & 0.044402 & 0.9461 & 0.172302 \tabularnewline
\hline
\end{tabular}
%Source: https://freestatistics.org/blog/index.php?pk=75309&T=2

[TABLE]
[ROW][C]Partial Autocorrelation Function[/C][/ROW]
[ROW][C]Time lag k[/C][C]PACF(k)[/C][C]T-STAT[/C][C]P-value[/C][/ROW]
[ROW][C]1[/C][C]-0.363162[/C][C]-7.738[/C][C]0[/C][/ROW]
[ROW][C]2[/C][C]-0.209995[/C][C]-4.4744[/C][C]5e-06[/C][/ROW]
[ROW][C]3[/C][C]-0.116799[/C][C]-2.4887[/C][C]0.00659[/C][/ROW]
[ROW][C]4[/C][C]-0.091305[/C][C]-1.9455[/C][C]0.026168[/C][/ROW]
[ROW][C]5[/C][C]0.011415[/C][C]0.2432[/C][C]0.403971[/C][/ROW]
[ROW][C]6[/C][C]-0.186786[/C][C]-3.9799[/C][C]4e-05[/C][/ROW]
[ROW][C]7[/C][C]-0.058624[/C][C]-1.2491[/C][C]0.106135[/C][/ROW]
[ROW][C]8[/C][C]-0.136573[/C][C]-2.91[/C][C]0.001896[/C][/ROW]
[ROW][C]9[/C][C]-0.168528[/C][C]-3.5909[/C][C]0.000183[/C][/ROW]
[ROW][C]10[/C][C]-0.005613[/C][C]-0.1196[/C][C]0.452427[/C][/ROW]
[ROW][C]11[/C][C]-0.247924[/C][C]-5.2826[/C][C]0[/C][/ROW]
[ROW][C]12[/C][C]0.179706[/C][C]3.829[/C][C]7.3e-05[/C][/ROW]
[ROW][C]13[/C][C]-0.001886[/C][C]-0.0402[/C][C]0.483979[/C][/ROW]
[ROW][C]14[/C][C]0.084594[/C][C]1.8025[/C][C]0.036068[/C][/ROW]
[ROW][C]15[/C][C]-0.028833[/C][C]-0.6144[/C][C]0.269644[/C][/ROW]
[ROW][C]16[/C][C]-0.016018[/C][C]-0.3413[/C][C]0.366517[/C][/ROW]
[ROW][C]17[/C][C]0.05275[/C][C]1.124[/C][C]0.130814[/C][/ROW]
[ROW][C]18[/C][C]0.000405[/C][C]0.0086[/C][C]0.496559[/C][/ROW]
[ROW][C]19[/C][C]0.011037[/C][C]0.2352[/C][C]0.407094[/C][/ROW]
[ROW][C]20[/C][C]-0.029877[/C][C]-0.6366[/C][C]0.262354[/C][/ROW]
[ROW][C]21[/C][C]0.01516[/C][C]0.323[/C][C]0.373416[/C][/ROW]
[ROW][C]22[/C][C]0.09539[/C][C]2.0325[/C][C]0.021342[/C][/ROW]
[ROW][C]23[/C][C]-0.157985[/C][C]-3.3662[/C][C]0.000413[/C][/ROW]
[ROW][C]24[/C][C]0.111381[/C][C]2.3732[/C][C]0.009025[/C][/ROW]
[ROW][C]25[/C][C]-0.054737[/C][C]-1.1663[/C][C]0.122051[/C][/ROW]
[ROW][C]26[/C][C]-0.023789[/C][C]-0.5069[/C][C]0.306246[/C][/ROW]
[ROW][C]27[/C][C]-0.077183[/C][C]-1.6446[/C][C]0.050376[/C][/ROW]
[ROW][C]28[/C][C]0.043234[/C][C]0.9212[/C][C]0.178716[/C][/ROW]
[ROW][C]29[/C][C]-0.012069[/C][C]-0.2572[/C][C]0.398589[/C][/ROW]
[ROW][C]30[/C][C]0.094122[/C][C]2.0055[/C][C]0.022752[/C][/ROW]
[ROW][C]31[/C][C]0.003284[/C][C]0.07[/C][C]0.47212[/C][/ROW]
[ROW][C]32[/C][C]-0.060132[/C][C]-1.2812[/C][C]0.10038[/C][/ROW]
[ROW][C]33[/C][C]-0.062436[/C][C]-1.3303[/C][C]0.092037[/C][/ROW]
[ROW][C]34[/C][C]-0.006681[/C][C]-0.1423[/C][C]0.443436[/C][/ROW]
[ROW][C]35[/C][C]-0.085132[/C][C]-1.8139[/C][C]0.035174[/C][/ROW]
[ROW][C]36[/C][C]0.109556[/C][C]2.3343[/C][C]0.010007[/C][/ROW]
[ROW][C]37[/C][C]-0.157286[/C][C]-3.3513[/C][C]0.000436[/C][/ROW]
[ROW][C]38[/C][C]0.040355[/C][C]0.8599[/C][C]0.19516[/C][/ROW]
[ROW][C]39[/C][C]0.07695[/C][C]1.6396[/C][C]0.050892[/C][/ROW]
[ROW][C]40[/C][C]0.003854[/C][C]0.0821[/C][C]0.467296[/C][/ROW]
[ROW][C]41[/C][C]-0.002817[/C][C]-0.06[/C][C]0.476083[/C][/ROW]
[ROW][C]42[/C][C]-0.038179[/C][C]-0.8135[/C][C]0.208181[/C][/ROW]
[ROW][C]43[/C][C]0.006234[/C][C]0.1328[/C][C]0.447193[/C][/ROW]
[ROW][C]44[/C][C]-0.038576[/C][C]-0.8219[/C][C]0.205769[/C][/ROW]
[ROW][C]45[/C][C]-0.004327[/C][C]-0.0922[/C][C]0.463291[/C][/ROW]
[ROW][C]46[/C][C]-0.048755[/C][C]-1.0388[/C][C]0.149716[/C][/ROW]
[ROW][C]47[/C][C]-0.073519[/C][C]-1.5665[/C][C]0.058965[/C][/ROW]
[ROW][C]48[/C][C]0.044402[/C][C]0.9461[/C][C]0.172302[/C][/ROW]
[/TABLE]
Source: https://freestatistics.org/blog/index.php?pk=75309&T=2

Globally Unique Identifier (entire table): ba.freestatistics.org/blog/index.php?pk=75309&T=2

As an alternative you can also use a QR Code:  

The GUIDs for individual cells are displayed in the table below:

Partial Autocorrelation Function
Time lag kPACF(k)T-STATP-value
1-0.363162-7.7380
2-0.209995-4.47445e-06
3-0.116799-2.48870.00659
4-0.091305-1.94550.026168
50.0114150.24320.403971
6-0.186786-3.97994e-05
7-0.058624-1.24910.106135
8-0.136573-2.910.001896
9-0.168528-3.59090.000183
10-0.005613-0.11960.452427
11-0.247924-5.28260
120.1797063.8297.3e-05
13-0.001886-0.04020.483979
140.0845941.80250.036068
15-0.028833-0.61440.269644
16-0.016018-0.34130.366517
170.052751.1240.130814
180.0004050.00860.496559
190.0110370.23520.407094
20-0.029877-0.63660.262354
210.015160.3230.373416
220.095392.03250.021342
23-0.157985-3.36620.000413
240.1113812.37320.009025
25-0.054737-1.16630.122051
26-0.023789-0.50690.306246
27-0.077183-1.64460.050376
280.0432340.92120.178716
29-0.012069-0.25720.398589
300.0941222.00550.022752
310.0032840.070.47212
32-0.060132-1.28120.10038
33-0.062436-1.33030.092037
34-0.006681-0.14230.443436
35-0.085132-1.81390.035174
360.1095562.33430.010007
37-0.157286-3.35130.000436
380.0403550.85990.19516
390.076951.63960.050892
400.0038540.08210.467296
41-0.002817-0.060.476083
42-0.038179-0.81350.208181
430.0062340.13280.447193
44-0.038576-0.82190.205769
45-0.004327-0.09220.463291
46-0.048755-1.03880.149716
47-0.073519-1.56650.058965
480.0444020.94610.172302


Parameters (Session):
par1 = 48 ; par2 = 1 ; par3 = 1 ; par4 = 0 ; par5 = 12 ; par6 = White Noise ; par7 = 0.95 ;
Parameters (R input):
par1 = 48 ; par2 = 1 ; par3 = 1 ; par4 = 0 ; par5 = 12 ; par6 = White Noise ; par7 = 0.95 ;
R code (references can be found in the software module):
if (par1 == 'Default') {
par1 = 10*log10(length(x))
} else {
par1 <- as.numeric(par1)
}
par2 <- as.numeric(par2)
par3 <- as.numeric(par3)
par4 <- as.numeric(par4)
par5 <- as.numeric(par5)
if (par6 == 'White Noise') par6 <- 'white' else par6 <- 'ma'
par7 <- as.numeric(par7)
if (par2 == 0) {
x <- log(x)
} else {
x <- (x ^ par2 - 1) / par2
}
if (par3 > 0) x <- diff(x,lag=1,difference=par3)
if (par4 > 0) x <- diff(x,lag=par5,difference=par4)
bitmap(file='pic1.png')
racf <- acf(x, par1, main='Autocorrelation', xlab='time lag', ylab='ACF', ci.type=par6, ci=par7, sub=paste('(lambda=',par2,', d=',par3,', D=',par4,', CI=', par7, ', CI type=',par6,')',sep=''))
dev.off()
bitmap(file='pic2.png')
rpacf <- pacf(x,par1,main='Partial Autocorrelation',xlab='lags',ylab='PACF')
dev.off()
(myacf <- c(racf$acf))
(mypacf <- c(rpacf$acf))
lengthx <- length(x)
sqrtn <- sqrt(lengthx)
load(file='createtable')
a<-table.start()
a<-table.row.start(a)
a<-table.element(a,'Autocorrelation Function',4,TRUE)
a<-table.row.end(a)
a<-table.row.start(a)
a<-table.element(a,'Time lag k',header=TRUE)
a<-table.element(a,hyperlink('basics.htm','ACF(k)','click here for more information about the Autocorrelation Function'),header=TRUE)
a<-table.element(a,'T-STAT',header=TRUE)
a<-table.element(a,'P-value',header=TRUE)
a<-table.row.end(a)
for (i in 2:(par1+1)) {
a<-table.row.start(a)
a<-table.element(a,i-1,header=TRUE)
a<-table.element(a,round(myacf[i],6))
mytstat <- myacf[i]*sqrtn
a<-table.element(a,round(mytstat,4))
a<-table.element(a,round(1-pt(abs(mytstat),lengthx),6))
a<-table.row.end(a)
}
a<-table.end(a)
table.save(a,file='mytable.tab')
a<-table.start()
a<-table.row.start(a)
a<-table.element(a,'Partial Autocorrelation Function',4,TRUE)
a<-table.row.end(a)
a<-table.row.start(a)
a<-table.element(a,'Time lag k',header=TRUE)
a<-table.element(a,hyperlink('basics.htm','PACF(k)','click here for more information about the Partial Autocorrelation Function'),header=TRUE)
a<-table.element(a,'T-STAT',header=TRUE)
a<-table.element(a,'P-value',header=TRUE)
a<-table.row.end(a)
for (i in 1:par1) {
a<-table.row.start(a)
a<-table.element(a,i,header=TRUE)
a<-table.element(a,round(mypacf[i],6))
mytstat <- mypacf[i]*sqrtn
a<-table.element(a,round(mytstat,4))
a<-table.element(a,round(1-pt(abs(mytstat),lengthx),6))
a<-table.row.end(a)
}
a<-table.end(a)
table.save(a,file='mytable1.tab')