Free Statistics

of Irreproducible Research!

Author's title

Author*Unverified author*
R Software Modulerwasp_autocorrelation.wasp
Title produced by software(Partial) Autocorrelation Function
Date of computationMon, 03 May 2010 15:54:18 +0000
Cite this page as followsStatistical Computations at FreeStatistics.org, Office for Research Development and Education, URL https://freestatistics.org/blog/index.php?v=date/2010/May/03/t1272902125zody3wpxbi8p1ut.htm/, Retrieved Thu, 25 Apr 2024 07:14:43 +0000
Statistical Computations at FreeStatistics.org, Office for Research Development and Education, URL https://freestatistics.org/blog/index.php?pk=75241, Retrieved Thu, 25 Apr 2024 07:14:43 +0000
QR Codes:

Original text written by user:
IsPrivate?No (this computation is public)
User-defined keywordsKDGP2W21
Estimated Impact158
Family? (F = Feedback message, R = changed R code, M = changed R Module, P = changed Parameters, D = changed Data)
-       [(Partial) Autocorrelation Function] [Autocorrelation F...] [2010-05-03 15:54:18] [5c964c3d7ddd2ed48ce2db94081575d2] [Current]
Feedback Forum

Post a new message
Dataseries X:
2550
2867
3458
2961
3163
2880
3331
3062
3534
3622
4464
5411
2564
2820
3508
3088
3299
2939
3320
3418
3604
3495
4163
4882
2211
3260
2992
2425
2707
3244
3965
3315
3333
3583
4021
4904
2252
2952
3573
3048
3059
2731
3563
3092
3478
3478
4308
5029
2075
3264
3308
3688
3136
2824
3644
4694
2914
3686
4358
5587
2265
3685
3754
3708
3210
3517
3905
3670
4221
4404
5086
5725
2367
3819
4067
4022
3937
4365
4290


Summary of computational transaction
Raw Inputview raw input (R code)
Raw Outputview raw output of R engine
Computing time1 seconds
R Server'RServer@AstonUniversity' @ vre.aston.ac.uk

\begin{tabular}{lllllllll}
\hline
Summary of computational transaction \tabularnewline
Raw Input & view raw input (R code)  \tabularnewline
Raw Output & view raw output of R engine  \tabularnewline
Computing time & 1 seconds \tabularnewline
R Server & 'RServer@AstonUniversity' @ vre.aston.ac.uk \tabularnewline
\hline
\end{tabular}
%Source: https://freestatistics.org/blog/index.php?pk=75241&T=0

[TABLE]
[ROW][C]Summary of computational transaction[/C][/ROW]
[ROW][C]Raw Input[/C][C]view raw input (R code) [/C][/ROW]
[ROW][C]Raw Output[/C][C]view raw output of R engine [/C][/ROW]
[ROW][C]Computing time[/C][C]1 seconds[/C][/ROW]
[ROW][C]R Server[/C][C]'RServer@AstonUniversity' @ vre.aston.ac.uk[/C][/ROW]
[/TABLE]
Source: https://freestatistics.org/blog/index.php?pk=75241&T=0

Globally Unique Identifier (entire table): ba.freestatistics.org/blog/index.php?pk=75241&T=0

As an alternative you can also use a QR Code:  

The GUIDs for individual cells are displayed in the table below:

Summary of computational transaction
Raw Inputview raw input (R code)
Raw Outputview raw output of R engine
Computing time1 seconds
R Server'RServer@AstonUniversity' @ vre.aston.ac.uk


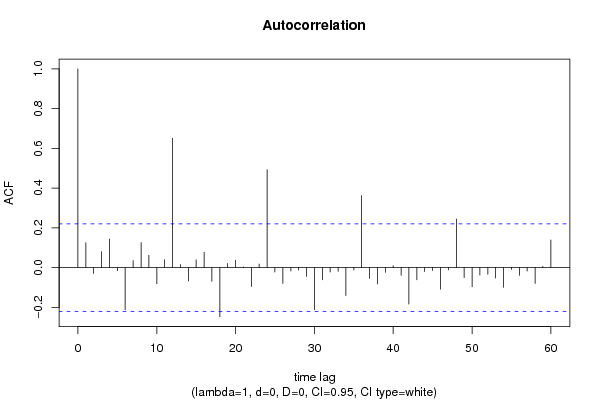
Autocorrelation Function
Time lag kACF(k)T-STATP-value
10.1251131.1120.13475
2-0.02936-0.2610.397403
30.0800180.71120.239523
40.1432771.27350.103293
5-0.015521-0.1380.445313
6-0.212344-1.88740.031393
70.0349450.31060.378463
80.1258021.11820.133446
90.0614160.54590.293344
10-0.08162-0.72550.235157
110.039750.35330.3624
120.6508025.78450
130.0159520.14180.443806
14-0.067335-0.59850.275614
150.0387830.34470.365613
160.0775810.68960.246249
17-0.068664-0.61030.271707
18-0.247184-2.1970.015475
190.0205610.18280.42773
200.0369120.32810.371858
210.0027860.02480.490155
22-0.095633-0.850.198945
230.0173970.15460.438753
240.4924024.37661.8e-05
25-0.022466-0.19970.421121
26-0.079866-0.70990.239939
27-0.017595-0.15640.438062
28-0.012594-0.11190.455579
29-0.045461-0.40410.343626
30-0.21207-1.88490.031559
31-0.061491-0.54650.293116
32-0.022494-0.19990.421022
33-0.018699-0.16620.434213
34-0.140398-1.24790.107879
35-0.012199-0.10840.456967
360.3632633.22880.000906
37-0.054744-0.48660.313953
38-0.08223-0.73090.233509
39-0.023328-0.20730.418137
400.0092990.08260.46717
41-0.038498-0.34220.366562
42-0.183681-1.63260.053267
43-0.06199-0.5510.291603
44-0.019978-0.17760.429758
45-0.014849-0.1320.447669
46-0.108878-0.96770.168066
47-0.011625-0.10330.458985
480.2444622.17280.016395
49-0.050001-0.44440.328977
50-0.09725-0.86440.194998
51-0.037994-0.33770.368242
52-0.033861-0.3010.382118
53-0.052605-0.46760.320691
54-0.099335-0.88290.189983
55-0.009249-0.08220.467345
56-0.039045-0.3470.364742
57-0.017303-0.15380.439084
58-0.079878-0.710.239907
590.0050580.0450.482126
600.1388921.23450.110339

\begin{tabular}{lllllllll}
\hline
Autocorrelation Function \tabularnewline
Time lag k & ACF(k) & T-STAT & P-value \tabularnewline
1 & 0.125113 & 1.112 & 0.13475 \tabularnewline
2 & -0.02936 & -0.261 & 0.397403 \tabularnewline
3 & 0.080018 & 0.7112 & 0.239523 \tabularnewline
4 & 0.143277 & 1.2735 & 0.103293 \tabularnewline
5 & -0.015521 & -0.138 & 0.445313 \tabularnewline
6 & -0.212344 & -1.8874 & 0.031393 \tabularnewline
7 & 0.034945 & 0.3106 & 0.378463 \tabularnewline
8 & 0.125802 & 1.1182 & 0.133446 \tabularnewline
9 & 0.061416 & 0.5459 & 0.293344 \tabularnewline
10 & -0.08162 & -0.7255 & 0.235157 \tabularnewline
11 & 0.03975 & 0.3533 & 0.3624 \tabularnewline
12 & 0.650802 & 5.7845 & 0 \tabularnewline
13 & 0.015952 & 0.1418 & 0.443806 \tabularnewline
14 & -0.067335 & -0.5985 & 0.275614 \tabularnewline
15 & 0.038783 & 0.3447 & 0.365613 \tabularnewline
16 & 0.077581 & 0.6896 & 0.246249 \tabularnewline
17 & -0.068664 & -0.6103 & 0.271707 \tabularnewline
18 & -0.247184 & -2.197 & 0.015475 \tabularnewline
19 & 0.020561 & 0.1828 & 0.42773 \tabularnewline
20 & 0.036912 & 0.3281 & 0.371858 \tabularnewline
21 & 0.002786 & 0.0248 & 0.490155 \tabularnewline
22 & -0.095633 & -0.85 & 0.198945 \tabularnewline
23 & 0.017397 & 0.1546 & 0.438753 \tabularnewline
24 & 0.492402 & 4.3766 & 1.8e-05 \tabularnewline
25 & -0.022466 & -0.1997 & 0.421121 \tabularnewline
26 & -0.079866 & -0.7099 & 0.239939 \tabularnewline
27 & -0.017595 & -0.1564 & 0.438062 \tabularnewline
28 & -0.012594 & -0.1119 & 0.455579 \tabularnewline
29 & -0.045461 & -0.4041 & 0.343626 \tabularnewline
30 & -0.21207 & -1.8849 & 0.031559 \tabularnewline
31 & -0.061491 & -0.5465 & 0.293116 \tabularnewline
32 & -0.022494 & -0.1999 & 0.421022 \tabularnewline
33 & -0.018699 & -0.1662 & 0.434213 \tabularnewline
34 & -0.140398 & -1.2479 & 0.107879 \tabularnewline
35 & -0.012199 & -0.1084 & 0.456967 \tabularnewline
36 & 0.363263 & 3.2288 & 0.000906 \tabularnewline
37 & -0.054744 & -0.4866 & 0.313953 \tabularnewline
38 & -0.08223 & -0.7309 & 0.233509 \tabularnewline
39 & -0.023328 & -0.2073 & 0.418137 \tabularnewline
40 & 0.009299 & 0.0826 & 0.46717 \tabularnewline
41 & -0.038498 & -0.3422 & 0.366562 \tabularnewline
42 & -0.183681 & -1.6326 & 0.053267 \tabularnewline
43 & -0.06199 & -0.551 & 0.291603 \tabularnewline
44 & -0.019978 & -0.1776 & 0.429758 \tabularnewline
45 & -0.014849 & -0.132 & 0.447669 \tabularnewline
46 & -0.108878 & -0.9677 & 0.168066 \tabularnewline
47 & -0.011625 & -0.1033 & 0.458985 \tabularnewline
48 & 0.244462 & 2.1728 & 0.016395 \tabularnewline
49 & -0.050001 & -0.4444 & 0.328977 \tabularnewline
50 & -0.09725 & -0.8644 & 0.194998 \tabularnewline
51 & -0.037994 & -0.3377 & 0.368242 \tabularnewline
52 & -0.033861 & -0.301 & 0.382118 \tabularnewline
53 & -0.052605 & -0.4676 & 0.320691 \tabularnewline
54 & -0.099335 & -0.8829 & 0.189983 \tabularnewline
55 & -0.009249 & -0.0822 & 0.467345 \tabularnewline
56 & -0.039045 & -0.347 & 0.364742 \tabularnewline
57 & -0.017303 & -0.1538 & 0.439084 \tabularnewline
58 & -0.079878 & -0.71 & 0.239907 \tabularnewline
59 & 0.005058 & 0.045 & 0.482126 \tabularnewline
60 & 0.138892 & 1.2345 & 0.110339 \tabularnewline
\hline
\end{tabular}
%Source: https://freestatistics.org/blog/index.php?pk=75241&T=1

[TABLE]
[ROW][C]Autocorrelation Function[/C][/ROW]
[ROW][C]Time lag k[/C][C]ACF(k)[/C][C]T-STAT[/C][C]P-value[/C][/ROW]
[ROW][C]1[/C][C]0.125113[/C][C]1.112[/C][C]0.13475[/C][/ROW]
[ROW][C]2[/C][C]-0.02936[/C][C]-0.261[/C][C]0.397403[/C][/ROW]
[ROW][C]3[/C][C]0.080018[/C][C]0.7112[/C][C]0.239523[/C][/ROW]
[ROW][C]4[/C][C]0.143277[/C][C]1.2735[/C][C]0.103293[/C][/ROW]
[ROW][C]5[/C][C]-0.015521[/C][C]-0.138[/C][C]0.445313[/C][/ROW]
[ROW][C]6[/C][C]-0.212344[/C][C]-1.8874[/C][C]0.031393[/C][/ROW]
[ROW][C]7[/C][C]0.034945[/C][C]0.3106[/C][C]0.378463[/C][/ROW]
[ROW][C]8[/C][C]0.125802[/C][C]1.1182[/C][C]0.133446[/C][/ROW]
[ROW][C]9[/C][C]0.061416[/C][C]0.5459[/C][C]0.293344[/C][/ROW]
[ROW][C]10[/C][C]-0.08162[/C][C]-0.7255[/C][C]0.235157[/C][/ROW]
[ROW][C]11[/C][C]0.03975[/C][C]0.3533[/C][C]0.3624[/C][/ROW]
[ROW][C]12[/C][C]0.650802[/C][C]5.7845[/C][C]0[/C][/ROW]
[ROW][C]13[/C][C]0.015952[/C][C]0.1418[/C][C]0.443806[/C][/ROW]
[ROW][C]14[/C][C]-0.067335[/C][C]-0.5985[/C][C]0.275614[/C][/ROW]
[ROW][C]15[/C][C]0.038783[/C][C]0.3447[/C][C]0.365613[/C][/ROW]
[ROW][C]16[/C][C]0.077581[/C][C]0.6896[/C][C]0.246249[/C][/ROW]
[ROW][C]17[/C][C]-0.068664[/C][C]-0.6103[/C][C]0.271707[/C][/ROW]
[ROW][C]18[/C][C]-0.247184[/C][C]-2.197[/C][C]0.015475[/C][/ROW]
[ROW][C]19[/C][C]0.020561[/C][C]0.1828[/C][C]0.42773[/C][/ROW]
[ROW][C]20[/C][C]0.036912[/C][C]0.3281[/C][C]0.371858[/C][/ROW]
[ROW][C]21[/C][C]0.002786[/C][C]0.0248[/C][C]0.490155[/C][/ROW]
[ROW][C]22[/C][C]-0.095633[/C][C]-0.85[/C][C]0.198945[/C][/ROW]
[ROW][C]23[/C][C]0.017397[/C][C]0.1546[/C][C]0.438753[/C][/ROW]
[ROW][C]24[/C][C]0.492402[/C][C]4.3766[/C][C]1.8e-05[/C][/ROW]
[ROW][C]25[/C][C]-0.022466[/C][C]-0.1997[/C][C]0.421121[/C][/ROW]
[ROW][C]26[/C][C]-0.079866[/C][C]-0.7099[/C][C]0.239939[/C][/ROW]
[ROW][C]27[/C][C]-0.017595[/C][C]-0.1564[/C][C]0.438062[/C][/ROW]
[ROW][C]28[/C][C]-0.012594[/C][C]-0.1119[/C][C]0.455579[/C][/ROW]
[ROW][C]29[/C][C]-0.045461[/C][C]-0.4041[/C][C]0.343626[/C][/ROW]
[ROW][C]30[/C][C]-0.21207[/C][C]-1.8849[/C][C]0.031559[/C][/ROW]
[ROW][C]31[/C][C]-0.061491[/C][C]-0.5465[/C][C]0.293116[/C][/ROW]
[ROW][C]32[/C][C]-0.022494[/C][C]-0.1999[/C][C]0.421022[/C][/ROW]
[ROW][C]33[/C][C]-0.018699[/C][C]-0.1662[/C][C]0.434213[/C][/ROW]
[ROW][C]34[/C][C]-0.140398[/C][C]-1.2479[/C][C]0.107879[/C][/ROW]
[ROW][C]35[/C][C]-0.012199[/C][C]-0.1084[/C][C]0.456967[/C][/ROW]
[ROW][C]36[/C][C]0.363263[/C][C]3.2288[/C][C]0.000906[/C][/ROW]
[ROW][C]37[/C][C]-0.054744[/C][C]-0.4866[/C][C]0.313953[/C][/ROW]
[ROW][C]38[/C][C]-0.08223[/C][C]-0.7309[/C][C]0.233509[/C][/ROW]
[ROW][C]39[/C][C]-0.023328[/C][C]-0.2073[/C][C]0.418137[/C][/ROW]
[ROW][C]40[/C][C]0.009299[/C][C]0.0826[/C][C]0.46717[/C][/ROW]
[ROW][C]41[/C][C]-0.038498[/C][C]-0.3422[/C][C]0.366562[/C][/ROW]
[ROW][C]42[/C][C]-0.183681[/C][C]-1.6326[/C][C]0.053267[/C][/ROW]
[ROW][C]43[/C][C]-0.06199[/C][C]-0.551[/C][C]0.291603[/C][/ROW]
[ROW][C]44[/C][C]-0.019978[/C][C]-0.1776[/C][C]0.429758[/C][/ROW]
[ROW][C]45[/C][C]-0.014849[/C][C]-0.132[/C][C]0.447669[/C][/ROW]
[ROW][C]46[/C][C]-0.108878[/C][C]-0.9677[/C][C]0.168066[/C][/ROW]
[ROW][C]47[/C][C]-0.011625[/C][C]-0.1033[/C][C]0.458985[/C][/ROW]
[ROW][C]48[/C][C]0.244462[/C][C]2.1728[/C][C]0.016395[/C][/ROW]
[ROW][C]49[/C][C]-0.050001[/C][C]-0.4444[/C][C]0.328977[/C][/ROW]
[ROW][C]50[/C][C]-0.09725[/C][C]-0.8644[/C][C]0.194998[/C][/ROW]
[ROW][C]51[/C][C]-0.037994[/C][C]-0.3377[/C][C]0.368242[/C][/ROW]
[ROW][C]52[/C][C]-0.033861[/C][C]-0.301[/C][C]0.382118[/C][/ROW]
[ROW][C]53[/C][C]-0.052605[/C][C]-0.4676[/C][C]0.320691[/C][/ROW]
[ROW][C]54[/C][C]-0.099335[/C][C]-0.8829[/C][C]0.189983[/C][/ROW]
[ROW][C]55[/C][C]-0.009249[/C][C]-0.0822[/C][C]0.467345[/C][/ROW]
[ROW][C]56[/C][C]-0.039045[/C][C]-0.347[/C][C]0.364742[/C][/ROW]
[ROW][C]57[/C][C]-0.017303[/C][C]-0.1538[/C][C]0.439084[/C][/ROW]
[ROW][C]58[/C][C]-0.079878[/C][C]-0.71[/C][C]0.239907[/C][/ROW]
[ROW][C]59[/C][C]0.005058[/C][C]0.045[/C][C]0.482126[/C][/ROW]
[ROW][C]60[/C][C]0.138892[/C][C]1.2345[/C][C]0.110339[/C][/ROW]
[/TABLE]
Source: https://freestatistics.org/blog/index.php?pk=75241&T=1

Globally Unique Identifier (entire table): ba.freestatistics.org/blog/index.php?pk=75241&T=1

As an alternative you can also use a QR Code:  

The GUIDs for individual cells are displayed in the table below:

Autocorrelation Function
Time lag kACF(k)T-STATP-value
10.1251131.1120.13475
2-0.02936-0.2610.397403
30.0800180.71120.239523
40.1432771.27350.103293
5-0.015521-0.1380.445313
6-0.212344-1.88740.031393
70.0349450.31060.378463
80.1258021.11820.133446
90.0614160.54590.293344
10-0.08162-0.72550.235157
110.039750.35330.3624
120.6508025.78450
130.0159520.14180.443806
14-0.067335-0.59850.275614
150.0387830.34470.365613
160.0775810.68960.246249
17-0.068664-0.61030.271707
18-0.247184-2.1970.015475
190.0205610.18280.42773
200.0369120.32810.371858
210.0027860.02480.490155
22-0.095633-0.850.198945
230.0173970.15460.438753
240.4924024.37661.8e-05
25-0.022466-0.19970.421121
26-0.079866-0.70990.239939
27-0.017595-0.15640.438062
28-0.012594-0.11190.455579
29-0.045461-0.40410.343626
30-0.21207-1.88490.031559
31-0.061491-0.54650.293116
32-0.022494-0.19990.421022
33-0.018699-0.16620.434213
34-0.140398-1.24790.107879
35-0.012199-0.10840.456967
360.3632633.22880.000906
37-0.054744-0.48660.313953
38-0.08223-0.73090.233509
39-0.023328-0.20730.418137
400.0092990.08260.46717
41-0.038498-0.34220.366562
42-0.183681-1.63260.053267
43-0.06199-0.5510.291603
44-0.019978-0.17760.429758
45-0.014849-0.1320.447669
46-0.108878-0.96770.168066
47-0.011625-0.10330.458985
480.2444622.17280.016395
49-0.050001-0.44440.328977
50-0.09725-0.86440.194998
51-0.037994-0.33770.368242
52-0.033861-0.3010.382118
53-0.052605-0.46760.320691
54-0.099335-0.88290.189983
55-0.009249-0.08220.467345
56-0.039045-0.3470.364742
57-0.017303-0.15380.439084
58-0.079878-0.710.239907
590.0050580.0450.482126
600.1388921.23450.110339


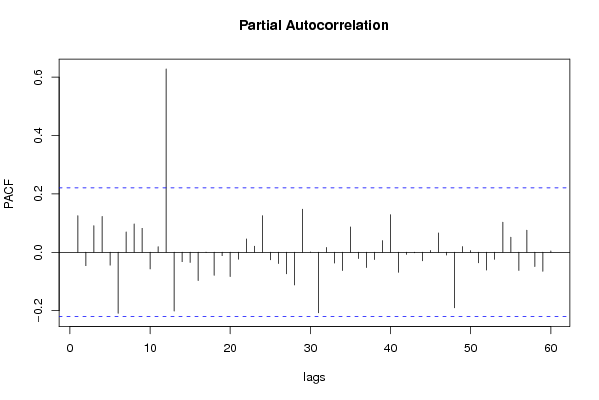
Partial Autocorrelation Function
Time lag kPACF(k)T-STATP-value
10.1251131.1120.13475
2-0.045729-0.40640.342757
30.0911960.81060.210026
40.1225431.08920.139692
5-0.044143-0.39230.347929
6-0.208929-1.8570.033519
70.0696110.61870.268943
80.0969260.86150.195786
90.0821190.72990.233808
10-0.056976-0.50640.306987
110.0193640.17210.431895
120.6282065.58360
13-0.201358-1.78970.038666
14-0.032095-0.28530.388093
15-0.034591-0.30750.379654
16-0.096955-0.86180.195716
17-0.000536-0.00480.498104
18-0.07897-0.70190.242402
19-0.011465-0.10190.459547
20-0.08312-0.73880.231112
21-0.023482-0.20870.417605
220.0457480.40660.342695
230.020570.18280.427701
240.1255381.11580.133944
25-0.025364-0.22540.41111
26-0.038267-0.34010.367334
27-0.073679-0.65490.257225
28-0.111806-0.99380.161688
290.147411.31020.096961
300.0011890.01060.495799
31-0.207224-1.84180.034625
320.0166490.1480.441368
33-0.03668-0.3260.372637
34-0.062248-0.55330.290819
350.0867840.77140.221398
36-0.021609-0.19210.424093
37-0.052121-0.46330.322225
38-0.024995-0.22220.412381
390.0400860.35630.361286
400.1288041.14480.127866
41-0.068546-0.60920.272055
42-0.007224-0.06420.474482
43-0.001705-0.01520.493974
44-0.028875-0.25670.399058
450.0059870.05320.478848
460.0664850.59090.278127
47-0.009192-0.08170.467545
48-0.189924-1.68810.04767
490.0194510.17290.431593
500.0059210.05260.479082
51-0.035927-0.31930.375162
52-0.060522-0.53790.296069
53-0.024226-0.21530.415033
540.1028940.91450.181608
550.0515240.4580.324122
56-0.06212-0.55210.291206
570.075510.67110.252042
58-0.04879-0.43370.332861
59-0.064786-0.57580.283182
600.0044350.03940.484328

\begin{tabular}{lllllllll}
\hline
Partial Autocorrelation Function \tabularnewline
Time lag k & PACF(k) & T-STAT & P-value \tabularnewline
1 & 0.125113 & 1.112 & 0.13475 \tabularnewline
2 & -0.045729 & -0.4064 & 0.342757 \tabularnewline
3 & 0.091196 & 0.8106 & 0.210026 \tabularnewline
4 & 0.122543 & 1.0892 & 0.139692 \tabularnewline
5 & -0.044143 & -0.3923 & 0.347929 \tabularnewline
6 & -0.208929 & -1.857 & 0.033519 \tabularnewline
7 & 0.069611 & 0.6187 & 0.268943 \tabularnewline
8 & 0.096926 & 0.8615 & 0.195786 \tabularnewline
9 & 0.082119 & 0.7299 & 0.233808 \tabularnewline
10 & -0.056976 & -0.5064 & 0.306987 \tabularnewline
11 & 0.019364 & 0.1721 & 0.431895 \tabularnewline
12 & 0.628206 & 5.5836 & 0 \tabularnewline
13 & -0.201358 & -1.7897 & 0.038666 \tabularnewline
14 & -0.032095 & -0.2853 & 0.388093 \tabularnewline
15 & -0.034591 & -0.3075 & 0.379654 \tabularnewline
16 & -0.096955 & -0.8618 & 0.195716 \tabularnewline
17 & -0.000536 & -0.0048 & 0.498104 \tabularnewline
18 & -0.07897 & -0.7019 & 0.242402 \tabularnewline
19 & -0.011465 & -0.1019 & 0.459547 \tabularnewline
20 & -0.08312 & -0.7388 & 0.231112 \tabularnewline
21 & -0.023482 & -0.2087 & 0.417605 \tabularnewline
22 & 0.045748 & 0.4066 & 0.342695 \tabularnewline
23 & 0.02057 & 0.1828 & 0.427701 \tabularnewline
24 & 0.125538 & 1.1158 & 0.133944 \tabularnewline
25 & -0.025364 & -0.2254 & 0.41111 \tabularnewline
26 & -0.038267 & -0.3401 & 0.367334 \tabularnewline
27 & -0.073679 & -0.6549 & 0.257225 \tabularnewline
28 & -0.111806 & -0.9938 & 0.161688 \tabularnewline
29 & 0.14741 & 1.3102 & 0.096961 \tabularnewline
30 & 0.001189 & 0.0106 & 0.495799 \tabularnewline
31 & -0.207224 & -1.8418 & 0.034625 \tabularnewline
32 & 0.016649 & 0.148 & 0.441368 \tabularnewline
33 & -0.03668 & -0.326 & 0.372637 \tabularnewline
34 & -0.062248 & -0.5533 & 0.290819 \tabularnewline
35 & 0.086784 & 0.7714 & 0.221398 \tabularnewline
36 & -0.021609 & -0.1921 & 0.424093 \tabularnewline
37 & -0.052121 & -0.4633 & 0.322225 \tabularnewline
38 & -0.024995 & -0.2222 & 0.412381 \tabularnewline
39 & 0.040086 & 0.3563 & 0.361286 \tabularnewline
40 & 0.128804 & 1.1448 & 0.127866 \tabularnewline
41 & -0.068546 & -0.6092 & 0.272055 \tabularnewline
42 & -0.007224 & -0.0642 & 0.474482 \tabularnewline
43 & -0.001705 & -0.0152 & 0.493974 \tabularnewline
44 & -0.028875 & -0.2567 & 0.399058 \tabularnewline
45 & 0.005987 & 0.0532 & 0.478848 \tabularnewline
46 & 0.066485 & 0.5909 & 0.278127 \tabularnewline
47 & -0.009192 & -0.0817 & 0.467545 \tabularnewline
48 & -0.189924 & -1.6881 & 0.04767 \tabularnewline
49 & 0.019451 & 0.1729 & 0.431593 \tabularnewline
50 & 0.005921 & 0.0526 & 0.479082 \tabularnewline
51 & -0.035927 & -0.3193 & 0.375162 \tabularnewline
52 & -0.060522 & -0.5379 & 0.296069 \tabularnewline
53 & -0.024226 & -0.2153 & 0.415033 \tabularnewline
54 & 0.102894 & 0.9145 & 0.181608 \tabularnewline
55 & 0.051524 & 0.458 & 0.324122 \tabularnewline
56 & -0.06212 & -0.5521 & 0.291206 \tabularnewline
57 & 0.07551 & 0.6711 & 0.252042 \tabularnewline
58 & -0.04879 & -0.4337 & 0.332861 \tabularnewline
59 & -0.064786 & -0.5758 & 0.283182 \tabularnewline
60 & 0.004435 & 0.0394 & 0.484328 \tabularnewline
\hline
\end{tabular}
%Source: https://freestatistics.org/blog/index.php?pk=75241&T=2

[TABLE]
[ROW][C]Partial Autocorrelation Function[/C][/ROW]
[ROW][C]Time lag k[/C][C]PACF(k)[/C][C]T-STAT[/C][C]P-value[/C][/ROW]
[ROW][C]1[/C][C]0.125113[/C][C]1.112[/C][C]0.13475[/C][/ROW]
[ROW][C]2[/C][C]-0.045729[/C][C]-0.4064[/C][C]0.342757[/C][/ROW]
[ROW][C]3[/C][C]0.091196[/C][C]0.8106[/C][C]0.210026[/C][/ROW]
[ROW][C]4[/C][C]0.122543[/C][C]1.0892[/C][C]0.139692[/C][/ROW]
[ROW][C]5[/C][C]-0.044143[/C][C]-0.3923[/C][C]0.347929[/C][/ROW]
[ROW][C]6[/C][C]-0.208929[/C][C]-1.857[/C][C]0.033519[/C][/ROW]
[ROW][C]7[/C][C]0.069611[/C][C]0.6187[/C][C]0.268943[/C][/ROW]
[ROW][C]8[/C][C]0.096926[/C][C]0.8615[/C][C]0.195786[/C][/ROW]
[ROW][C]9[/C][C]0.082119[/C][C]0.7299[/C][C]0.233808[/C][/ROW]
[ROW][C]10[/C][C]-0.056976[/C][C]-0.5064[/C][C]0.306987[/C][/ROW]
[ROW][C]11[/C][C]0.019364[/C][C]0.1721[/C][C]0.431895[/C][/ROW]
[ROW][C]12[/C][C]0.628206[/C][C]5.5836[/C][C]0[/C][/ROW]
[ROW][C]13[/C][C]-0.201358[/C][C]-1.7897[/C][C]0.038666[/C][/ROW]
[ROW][C]14[/C][C]-0.032095[/C][C]-0.2853[/C][C]0.388093[/C][/ROW]
[ROW][C]15[/C][C]-0.034591[/C][C]-0.3075[/C][C]0.379654[/C][/ROW]
[ROW][C]16[/C][C]-0.096955[/C][C]-0.8618[/C][C]0.195716[/C][/ROW]
[ROW][C]17[/C][C]-0.000536[/C][C]-0.0048[/C][C]0.498104[/C][/ROW]
[ROW][C]18[/C][C]-0.07897[/C][C]-0.7019[/C][C]0.242402[/C][/ROW]
[ROW][C]19[/C][C]-0.011465[/C][C]-0.1019[/C][C]0.459547[/C][/ROW]
[ROW][C]20[/C][C]-0.08312[/C][C]-0.7388[/C][C]0.231112[/C][/ROW]
[ROW][C]21[/C][C]-0.023482[/C][C]-0.2087[/C][C]0.417605[/C][/ROW]
[ROW][C]22[/C][C]0.045748[/C][C]0.4066[/C][C]0.342695[/C][/ROW]
[ROW][C]23[/C][C]0.02057[/C][C]0.1828[/C][C]0.427701[/C][/ROW]
[ROW][C]24[/C][C]0.125538[/C][C]1.1158[/C][C]0.133944[/C][/ROW]
[ROW][C]25[/C][C]-0.025364[/C][C]-0.2254[/C][C]0.41111[/C][/ROW]
[ROW][C]26[/C][C]-0.038267[/C][C]-0.3401[/C][C]0.367334[/C][/ROW]
[ROW][C]27[/C][C]-0.073679[/C][C]-0.6549[/C][C]0.257225[/C][/ROW]
[ROW][C]28[/C][C]-0.111806[/C][C]-0.9938[/C][C]0.161688[/C][/ROW]
[ROW][C]29[/C][C]0.14741[/C][C]1.3102[/C][C]0.096961[/C][/ROW]
[ROW][C]30[/C][C]0.001189[/C][C]0.0106[/C][C]0.495799[/C][/ROW]
[ROW][C]31[/C][C]-0.207224[/C][C]-1.8418[/C][C]0.034625[/C][/ROW]
[ROW][C]32[/C][C]0.016649[/C][C]0.148[/C][C]0.441368[/C][/ROW]
[ROW][C]33[/C][C]-0.03668[/C][C]-0.326[/C][C]0.372637[/C][/ROW]
[ROW][C]34[/C][C]-0.062248[/C][C]-0.5533[/C][C]0.290819[/C][/ROW]
[ROW][C]35[/C][C]0.086784[/C][C]0.7714[/C][C]0.221398[/C][/ROW]
[ROW][C]36[/C][C]-0.021609[/C][C]-0.1921[/C][C]0.424093[/C][/ROW]
[ROW][C]37[/C][C]-0.052121[/C][C]-0.4633[/C][C]0.322225[/C][/ROW]
[ROW][C]38[/C][C]-0.024995[/C][C]-0.2222[/C][C]0.412381[/C][/ROW]
[ROW][C]39[/C][C]0.040086[/C][C]0.3563[/C][C]0.361286[/C][/ROW]
[ROW][C]40[/C][C]0.128804[/C][C]1.1448[/C][C]0.127866[/C][/ROW]
[ROW][C]41[/C][C]-0.068546[/C][C]-0.6092[/C][C]0.272055[/C][/ROW]
[ROW][C]42[/C][C]-0.007224[/C][C]-0.0642[/C][C]0.474482[/C][/ROW]
[ROW][C]43[/C][C]-0.001705[/C][C]-0.0152[/C][C]0.493974[/C][/ROW]
[ROW][C]44[/C][C]-0.028875[/C][C]-0.2567[/C][C]0.399058[/C][/ROW]
[ROW][C]45[/C][C]0.005987[/C][C]0.0532[/C][C]0.478848[/C][/ROW]
[ROW][C]46[/C][C]0.066485[/C][C]0.5909[/C][C]0.278127[/C][/ROW]
[ROW][C]47[/C][C]-0.009192[/C][C]-0.0817[/C][C]0.467545[/C][/ROW]
[ROW][C]48[/C][C]-0.189924[/C][C]-1.6881[/C][C]0.04767[/C][/ROW]
[ROW][C]49[/C][C]0.019451[/C][C]0.1729[/C][C]0.431593[/C][/ROW]
[ROW][C]50[/C][C]0.005921[/C][C]0.0526[/C][C]0.479082[/C][/ROW]
[ROW][C]51[/C][C]-0.035927[/C][C]-0.3193[/C][C]0.375162[/C][/ROW]
[ROW][C]52[/C][C]-0.060522[/C][C]-0.5379[/C][C]0.296069[/C][/ROW]
[ROW][C]53[/C][C]-0.024226[/C][C]-0.2153[/C][C]0.415033[/C][/ROW]
[ROW][C]54[/C][C]0.102894[/C][C]0.9145[/C][C]0.181608[/C][/ROW]
[ROW][C]55[/C][C]0.051524[/C][C]0.458[/C][C]0.324122[/C][/ROW]
[ROW][C]56[/C][C]-0.06212[/C][C]-0.5521[/C][C]0.291206[/C][/ROW]
[ROW][C]57[/C][C]0.07551[/C][C]0.6711[/C][C]0.252042[/C][/ROW]
[ROW][C]58[/C][C]-0.04879[/C][C]-0.4337[/C][C]0.332861[/C][/ROW]
[ROW][C]59[/C][C]-0.064786[/C][C]-0.5758[/C][C]0.283182[/C][/ROW]
[ROW][C]60[/C][C]0.004435[/C][C]0.0394[/C][C]0.484328[/C][/ROW]
[/TABLE]
Source: https://freestatistics.org/blog/index.php?pk=75241&T=2

Globally Unique Identifier (entire table): ba.freestatistics.org/blog/index.php?pk=75241&T=2

As an alternative you can also use a QR Code:  

The GUIDs for individual cells are displayed in the table below:

Partial Autocorrelation Function
Time lag kPACF(k)T-STATP-value
10.1251131.1120.13475
2-0.045729-0.40640.342757
30.0911960.81060.210026
40.1225431.08920.139692
5-0.044143-0.39230.347929
6-0.208929-1.8570.033519
70.0696110.61870.268943
80.0969260.86150.195786
90.0821190.72990.233808
10-0.056976-0.50640.306987
110.0193640.17210.431895
120.6282065.58360
13-0.201358-1.78970.038666
14-0.032095-0.28530.388093
15-0.034591-0.30750.379654
16-0.096955-0.86180.195716
17-0.000536-0.00480.498104
18-0.07897-0.70190.242402
19-0.011465-0.10190.459547
20-0.08312-0.73880.231112
21-0.023482-0.20870.417605
220.0457480.40660.342695
230.020570.18280.427701
240.1255381.11580.133944
25-0.025364-0.22540.41111
26-0.038267-0.34010.367334
27-0.073679-0.65490.257225
28-0.111806-0.99380.161688
290.147411.31020.096961
300.0011890.01060.495799
31-0.207224-1.84180.034625
320.0166490.1480.441368
33-0.03668-0.3260.372637
34-0.062248-0.55330.290819
350.0867840.77140.221398
36-0.021609-0.19210.424093
37-0.052121-0.46330.322225
38-0.024995-0.22220.412381
390.0400860.35630.361286
400.1288041.14480.127866
41-0.068546-0.60920.272055
42-0.007224-0.06420.474482
43-0.001705-0.01520.493974
44-0.028875-0.25670.399058
450.0059870.05320.478848
460.0664850.59090.278127
47-0.009192-0.08170.467545
48-0.189924-1.68810.04767
490.0194510.17290.431593
500.0059210.05260.479082
51-0.035927-0.31930.375162
52-0.060522-0.53790.296069
53-0.024226-0.21530.415033
540.1028940.91450.181608
550.0515240.4580.324122
56-0.06212-0.55210.291206
570.075510.67110.252042
58-0.04879-0.43370.332861
59-0.064786-0.57580.283182
600.0044350.03940.484328


Parameters (Session):
par1 = 60 ; par2 = 1 ; par3 = 0 ; par4 = 0 ; par5 = 12 ; par6 = White Noise ; par7 = 0.95 ;
Parameters (R input):
par1 = 60 ; par2 = 1 ; par3 = 0 ; par4 = 0 ; par5 = 12 ; par6 = White Noise ; par7 = 0.95 ;
R code (references can be found in the software module):
if (par1 == 'Default') {
par1 = 10*log10(length(x))
} else {
par1 <- as.numeric(par1)
}
par2 <- as.numeric(par2)
par3 <- as.numeric(par3)
par4 <- as.numeric(par4)
par5 <- as.numeric(par5)
if (par6 == 'White Noise') par6 <- 'white' else par6 <- 'ma'
par7 <- as.numeric(par7)
if (par2 == 0) {
x <- log(x)
} else {
x <- (x ^ par2 - 1) / par2
}
if (par3 > 0) x <- diff(x,lag=1,difference=par3)
if (par4 > 0) x <- diff(x,lag=par5,difference=par4)
bitmap(file='pic1.png')
racf <- acf(x, par1, main='Autocorrelation', xlab='time lag', ylab='ACF', ci.type=par6, ci=par7, sub=paste('(lambda=',par2,', d=',par3,', D=',par4,', CI=', par7, ', CI type=',par6,')',sep=''))
dev.off()
bitmap(file='pic2.png')
rpacf <- pacf(x,par1,main='Partial Autocorrelation',xlab='lags',ylab='PACF')
dev.off()
(myacf <- c(racf$acf))
(mypacf <- c(rpacf$acf))
lengthx <- length(x)
sqrtn <- sqrt(lengthx)
load(file='createtable')
a<-table.start()
a<-table.row.start(a)
a<-table.element(a,'Autocorrelation Function',4,TRUE)
a<-table.row.end(a)
a<-table.row.start(a)
a<-table.element(a,'Time lag k',header=TRUE)
a<-table.element(a,hyperlink('basics.htm','ACF(k)','click here for more information about the Autocorrelation Function'),header=TRUE)
a<-table.element(a,'T-STAT',header=TRUE)
a<-table.element(a,'P-value',header=TRUE)
a<-table.row.end(a)
for (i in 2:(par1+1)) {
a<-table.row.start(a)
a<-table.element(a,i-1,header=TRUE)
a<-table.element(a,round(myacf[i],6))
mytstat <- myacf[i]*sqrtn
a<-table.element(a,round(mytstat,4))
a<-table.element(a,round(1-pt(abs(mytstat),lengthx),6))
a<-table.row.end(a)
}
a<-table.end(a)
table.save(a,file='mytable.tab')
a<-table.start()
a<-table.row.start(a)
a<-table.element(a,'Partial Autocorrelation Function',4,TRUE)
a<-table.row.end(a)
a<-table.row.start(a)
a<-table.element(a,'Time lag k',header=TRUE)
a<-table.element(a,hyperlink('basics.htm','PACF(k)','click here for more information about the Partial Autocorrelation Function'),header=TRUE)
a<-table.element(a,'T-STAT',header=TRUE)
a<-table.element(a,'P-value',header=TRUE)
a<-table.row.end(a)
for (i in 1:par1) {
a<-table.row.start(a)
a<-table.element(a,i,header=TRUE)
a<-table.element(a,round(mypacf[i],6))
mytstat <- mypacf[i]*sqrtn
a<-table.element(a,round(mytstat,4))
a<-table.element(a,round(1-pt(abs(mytstat),lengthx),6))
a<-table.row.end(a)
}
a<-table.end(a)
table.save(a,file='mytable1.tab')