Free Statistics

of Irreproducible Research!

Author's title

Author*Unverified author*
R Software Modulerwasp_autocorrelation.wasp
Title produced by software(Partial) Autocorrelation Function
Date of computationMon, 03 May 2010 13:02:56 +0000
Cite this page as followsStatistical Computations at FreeStatistics.org, Office for Research Development and Education, URL https://freestatistics.org/blog/index.php?v=date/2010/May/03/t1272891873ou2z3790212n8py.htm/, Retrieved Sat, 20 Apr 2024 08:46:18 +0000
Statistical Computations at FreeStatistics.org, Office for Research Development and Education, URL https://freestatistics.org/blog/index.php?pk=75199, Retrieved Sat, 20 Apr 2024 08:46:18 +0000
QR Codes:

Original text written by user:
IsPrivate?No (this computation is public)
User-defined keywordsKDGP2W21
Estimated Impact155
Family? (F = Feedback message, R = changed R code, M = changed R Module, P = changed Parameters, D = changed Data)
-       [(Partial) Autocorrelation Function] [Retail sales and ...] [2010-05-03 13:02:56] [35611de12c9fa8a4a915f3548e0dcd01] [Current]
Feedback Forum

Post a new message
Dataseries X:
357704
281463
282445
319107
315278
328499
321151
328025
326280
313444
319639
324067
386918
293009
294822
338844
335407
345080
350608
351285
355147
332791
335615
343202
404868
317902
313552
361505
351436
373350
366310
361669
375078
345547
348117
356089
416856
328087
322747
373626
358275
391287
376371
371848
387261
353159
367855
376822
425283
342191
344062
373587
370144
399979
380431
385909
384798
352554
352479
338788
387964
313593
304056
334149
336155
354668
351418
354316
359483
330411
344726
347175


Summary of computational transaction
Raw Inputview raw input (R code)
Raw Outputview raw output of R engine
Computing time1 seconds
R Server'Gwilym Jenkins' @ 72.249.127.135

\begin{tabular}{lllllllll}
\hline
Summary of computational transaction \tabularnewline
Raw Input & view raw input (R code)  \tabularnewline
Raw Output & view raw output of R engine  \tabularnewline
Computing time & 1 seconds \tabularnewline
R Server & 'Gwilym Jenkins' @ 72.249.127.135 \tabularnewline
\hline
\end{tabular}
%Source: https://freestatistics.org/blog/index.php?pk=75199&T=0

[TABLE]
[ROW][C]Summary of computational transaction[/C][/ROW]
[ROW][C]Raw Input[/C][C]view raw input (R code) [/C][/ROW]
[ROW][C]Raw Output[/C][C]view raw output of R engine [/C][/ROW]
[ROW][C]Computing time[/C][C]1 seconds[/C][/ROW]
[ROW][C]R Server[/C][C]'Gwilym Jenkins' @ 72.249.127.135[/C][/ROW]
[/TABLE]
Source: https://freestatistics.org/blog/index.php?pk=75199&T=0

Globally Unique Identifier (entire table): ba.freestatistics.org/blog/index.php?pk=75199&T=0

As an alternative you can also use a QR Code:  

The GUIDs for individual cells are displayed in the table below:

Summary of computational transaction
Raw Inputview raw input (R code)
Raw Outputview raw output of R engine
Computing time1 seconds
R Server'Gwilym Jenkins' @ 72.249.127.135


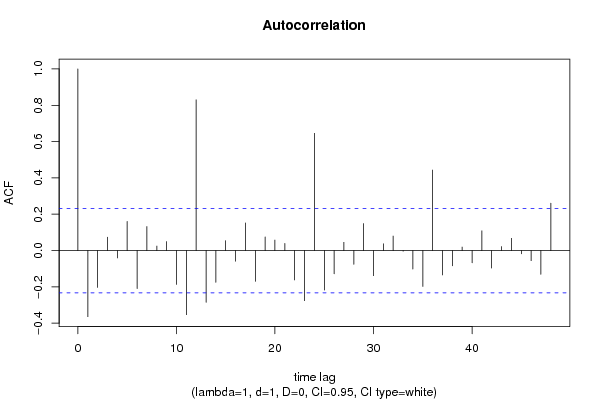
Autocorrelation Function
Time lag kACF(k)T-STATP-value
1-0.363898-3.06630.001533
2-0.203056-1.7110.045726
30.0736130.62030.26853
4-0.040865-0.34430.365805
50.1606821.35390.090026
6-0.209462-1.7650.040935
70.1319041.11140.135064
80.0248560.20940.417351
90.0497950.41960.33803
10-0.186759-1.57370.060006
11-0.353001-2.97440.002004
120.8298476.99240
13-0.285021-2.40160.009471
14-0.175119-1.47560.072239
150.0546580.46060.323261
16-0.05863-0.4940.311407
170.1522661.2830.101829
18-0.169397-1.42740.078929
190.0749230.63130.264932
200.0581420.48990.312852
210.0395460.33320.369975
22-0.161947-1.36460.088346
23-0.27605-2.3260.011438
240.6459435.44280
25-0.217549-1.83310.03549
26-0.128359-1.08160.141552
270.0451820.38070.352278
28-0.075597-0.6370.26309
290.1486811.25280.107194
30-0.138199-1.16450.124063
310.0369370.31120.378267
320.0796310.6710.252204
33-0.003204-0.0270.489268
34-0.101578-0.85590.197463
35-0.197595-1.6650.050163
360.443333.73560.000188
37-0.133961-1.12880.131397
38-0.083805-0.70620.241202
390.0191440.16130.436153
40-0.067532-0.5690.285564
410.1086060.91510.18161
42-0.096439-0.81260.20958
430.02220.18710.426072
440.0671860.56610.286548
45-0.017918-0.1510.440211
46-0.056058-0.47240.319062
47-0.130959-1.10350.136772
480.2607172.19680.015649

\begin{tabular}{lllllllll}
\hline
Autocorrelation Function \tabularnewline
Time lag k & ACF(k) & T-STAT & P-value \tabularnewline
1 & -0.363898 & -3.0663 & 0.001533 \tabularnewline
2 & -0.203056 & -1.711 & 0.045726 \tabularnewline
3 & 0.073613 & 0.6203 & 0.26853 \tabularnewline
4 & -0.040865 & -0.3443 & 0.365805 \tabularnewline
5 & 0.160682 & 1.3539 & 0.090026 \tabularnewline
6 & -0.209462 & -1.765 & 0.040935 \tabularnewline
7 & 0.131904 & 1.1114 & 0.135064 \tabularnewline
8 & 0.024856 & 0.2094 & 0.417351 \tabularnewline
9 & 0.049795 & 0.4196 & 0.33803 \tabularnewline
10 & -0.186759 & -1.5737 & 0.060006 \tabularnewline
11 & -0.353001 & -2.9744 & 0.002004 \tabularnewline
12 & 0.829847 & 6.9924 & 0 \tabularnewline
13 & -0.285021 & -2.4016 & 0.009471 \tabularnewline
14 & -0.175119 & -1.4756 & 0.072239 \tabularnewline
15 & 0.054658 & 0.4606 & 0.323261 \tabularnewline
16 & -0.05863 & -0.494 & 0.311407 \tabularnewline
17 & 0.152266 & 1.283 & 0.101829 \tabularnewline
18 & -0.169397 & -1.4274 & 0.078929 \tabularnewline
19 & 0.074923 & 0.6313 & 0.264932 \tabularnewline
20 & 0.058142 & 0.4899 & 0.312852 \tabularnewline
21 & 0.039546 & 0.3332 & 0.369975 \tabularnewline
22 & -0.161947 & -1.3646 & 0.088346 \tabularnewline
23 & -0.27605 & -2.326 & 0.011438 \tabularnewline
24 & 0.645943 & 5.4428 & 0 \tabularnewline
25 & -0.217549 & -1.8331 & 0.03549 \tabularnewline
26 & -0.128359 & -1.0816 & 0.141552 \tabularnewline
27 & 0.045182 & 0.3807 & 0.352278 \tabularnewline
28 & -0.075597 & -0.637 & 0.26309 \tabularnewline
29 & 0.148681 & 1.2528 & 0.107194 \tabularnewline
30 & -0.138199 & -1.1645 & 0.124063 \tabularnewline
31 & 0.036937 & 0.3112 & 0.378267 \tabularnewline
32 & 0.079631 & 0.671 & 0.252204 \tabularnewline
33 & -0.003204 & -0.027 & 0.489268 \tabularnewline
34 & -0.101578 & -0.8559 & 0.197463 \tabularnewline
35 & -0.197595 & -1.665 & 0.050163 \tabularnewline
36 & 0.44333 & 3.7356 & 0.000188 \tabularnewline
37 & -0.133961 & -1.1288 & 0.131397 \tabularnewline
38 & -0.083805 & -0.7062 & 0.241202 \tabularnewline
39 & 0.019144 & 0.1613 & 0.436153 \tabularnewline
40 & -0.067532 & -0.569 & 0.285564 \tabularnewline
41 & 0.108606 & 0.9151 & 0.18161 \tabularnewline
42 & -0.096439 & -0.8126 & 0.20958 \tabularnewline
43 & 0.0222 & 0.1871 & 0.426072 \tabularnewline
44 & 0.067186 & 0.5661 & 0.286548 \tabularnewline
45 & -0.017918 & -0.151 & 0.440211 \tabularnewline
46 & -0.056058 & -0.4724 & 0.319062 \tabularnewline
47 & -0.130959 & -1.1035 & 0.136772 \tabularnewline
48 & 0.260717 & 2.1968 & 0.015649 \tabularnewline
\hline
\end{tabular}
%Source: https://freestatistics.org/blog/index.php?pk=75199&T=1

[TABLE]
[ROW][C]Autocorrelation Function[/C][/ROW]
[ROW][C]Time lag k[/C][C]ACF(k)[/C][C]T-STAT[/C][C]P-value[/C][/ROW]
[ROW][C]1[/C][C]-0.363898[/C][C]-3.0663[/C][C]0.001533[/C][/ROW]
[ROW][C]2[/C][C]-0.203056[/C][C]-1.711[/C][C]0.045726[/C][/ROW]
[ROW][C]3[/C][C]0.073613[/C][C]0.6203[/C][C]0.26853[/C][/ROW]
[ROW][C]4[/C][C]-0.040865[/C][C]-0.3443[/C][C]0.365805[/C][/ROW]
[ROW][C]5[/C][C]0.160682[/C][C]1.3539[/C][C]0.090026[/C][/ROW]
[ROW][C]6[/C][C]-0.209462[/C][C]-1.765[/C][C]0.040935[/C][/ROW]
[ROW][C]7[/C][C]0.131904[/C][C]1.1114[/C][C]0.135064[/C][/ROW]
[ROW][C]8[/C][C]0.024856[/C][C]0.2094[/C][C]0.417351[/C][/ROW]
[ROW][C]9[/C][C]0.049795[/C][C]0.4196[/C][C]0.33803[/C][/ROW]
[ROW][C]10[/C][C]-0.186759[/C][C]-1.5737[/C][C]0.060006[/C][/ROW]
[ROW][C]11[/C][C]-0.353001[/C][C]-2.9744[/C][C]0.002004[/C][/ROW]
[ROW][C]12[/C][C]0.829847[/C][C]6.9924[/C][C]0[/C][/ROW]
[ROW][C]13[/C][C]-0.285021[/C][C]-2.4016[/C][C]0.009471[/C][/ROW]
[ROW][C]14[/C][C]-0.175119[/C][C]-1.4756[/C][C]0.072239[/C][/ROW]
[ROW][C]15[/C][C]0.054658[/C][C]0.4606[/C][C]0.323261[/C][/ROW]
[ROW][C]16[/C][C]-0.05863[/C][C]-0.494[/C][C]0.311407[/C][/ROW]
[ROW][C]17[/C][C]0.152266[/C][C]1.283[/C][C]0.101829[/C][/ROW]
[ROW][C]18[/C][C]-0.169397[/C][C]-1.4274[/C][C]0.078929[/C][/ROW]
[ROW][C]19[/C][C]0.074923[/C][C]0.6313[/C][C]0.264932[/C][/ROW]
[ROW][C]20[/C][C]0.058142[/C][C]0.4899[/C][C]0.312852[/C][/ROW]
[ROW][C]21[/C][C]0.039546[/C][C]0.3332[/C][C]0.369975[/C][/ROW]
[ROW][C]22[/C][C]-0.161947[/C][C]-1.3646[/C][C]0.088346[/C][/ROW]
[ROW][C]23[/C][C]-0.27605[/C][C]-2.326[/C][C]0.011438[/C][/ROW]
[ROW][C]24[/C][C]0.645943[/C][C]5.4428[/C][C]0[/C][/ROW]
[ROW][C]25[/C][C]-0.217549[/C][C]-1.8331[/C][C]0.03549[/C][/ROW]
[ROW][C]26[/C][C]-0.128359[/C][C]-1.0816[/C][C]0.141552[/C][/ROW]
[ROW][C]27[/C][C]0.045182[/C][C]0.3807[/C][C]0.352278[/C][/ROW]
[ROW][C]28[/C][C]-0.075597[/C][C]-0.637[/C][C]0.26309[/C][/ROW]
[ROW][C]29[/C][C]0.148681[/C][C]1.2528[/C][C]0.107194[/C][/ROW]
[ROW][C]30[/C][C]-0.138199[/C][C]-1.1645[/C][C]0.124063[/C][/ROW]
[ROW][C]31[/C][C]0.036937[/C][C]0.3112[/C][C]0.378267[/C][/ROW]
[ROW][C]32[/C][C]0.079631[/C][C]0.671[/C][C]0.252204[/C][/ROW]
[ROW][C]33[/C][C]-0.003204[/C][C]-0.027[/C][C]0.489268[/C][/ROW]
[ROW][C]34[/C][C]-0.101578[/C][C]-0.8559[/C][C]0.197463[/C][/ROW]
[ROW][C]35[/C][C]-0.197595[/C][C]-1.665[/C][C]0.050163[/C][/ROW]
[ROW][C]36[/C][C]0.44333[/C][C]3.7356[/C][C]0.000188[/C][/ROW]
[ROW][C]37[/C][C]-0.133961[/C][C]-1.1288[/C][C]0.131397[/C][/ROW]
[ROW][C]38[/C][C]-0.083805[/C][C]-0.7062[/C][C]0.241202[/C][/ROW]
[ROW][C]39[/C][C]0.019144[/C][C]0.1613[/C][C]0.436153[/C][/ROW]
[ROW][C]40[/C][C]-0.067532[/C][C]-0.569[/C][C]0.285564[/C][/ROW]
[ROW][C]41[/C][C]0.108606[/C][C]0.9151[/C][C]0.18161[/C][/ROW]
[ROW][C]42[/C][C]-0.096439[/C][C]-0.8126[/C][C]0.20958[/C][/ROW]
[ROW][C]43[/C][C]0.0222[/C][C]0.1871[/C][C]0.426072[/C][/ROW]
[ROW][C]44[/C][C]0.067186[/C][C]0.5661[/C][C]0.286548[/C][/ROW]
[ROW][C]45[/C][C]-0.017918[/C][C]-0.151[/C][C]0.440211[/C][/ROW]
[ROW][C]46[/C][C]-0.056058[/C][C]-0.4724[/C][C]0.319062[/C][/ROW]
[ROW][C]47[/C][C]-0.130959[/C][C]-1.1035[/C][C]0.136772[/C][/ROW]
[ROW][C]48[/C][C]0.260717[/C][C]2.1968[/C][C]0.015649[/C][/ROW]
[/TABLE]
Source: https://freestatistics.org/blog/index.php?pk=75199&T=1

Globally Unique Identifier (entire table): ba.freestatistics.org/blog/index.php?pk=75199&T=1

As an alternative you can also use a QR Code:  

The GUIDs for individual cells are displayed in the table below:

Autocorrelation Function
Time lag kACF(k)T-STATP-value
1-0.363898-3.06630.001533
2-0.203056-1.7110.045726
30.0736130.62030.26853
4-0.040865-0.34430.365805
50.1606821.35390.090026
6-0.209462-1.7650.040935
70.1319041.11140.135064
80.0248560.20940.417351
90.0497950.41960.33803
10-0.186759-1.57370.060006
11-0.353001-2.97440.002004
120.8298476.99240
13-0.285021-2.40160.009471
14-0.175119-1.47560.072239
150.0546580.46060.323261
16-0.05863-0.4940.311407
170.1522661.2830.101829
18-0.169397-1.42740.078929
190.0749230.63130.264932
200.0581420.48990.312852
210.0395460.33320.369975
22-0.161947-1.36460.088346
23-0.27605-2.3260.011438
240.6459435.44280
25-0.217549-1.83310.03549
26-0.128359-1.08160.141552
270.0451820.38070.352278
28-0.075597-0.6370.26309
290.1486811.25280.107194
30-0.138199-1.16450.124063
310.0369370.31120.378267
320.0796310.6710.252204
33-0.003204-0.0270.489268
34-0.101578-0.85590.197463
35-0.197595-1.6650.050163
360.443333.73560.000188
37-0.133961-1.12880.131397
38-0.083805-0.70620.241202
390.0191440.16130.436153
40-0.067532-0.5690.285564
410.1086060.91510.18161
42-0.096439-0.81260.20958
430.02220.18710.426072
440.0671860.56610.286548
45-0.017918-0.1510.440211
46-0.056058-0.47240.319062
47-0.130959-1.10350.136772
480.2607172.19680.015649


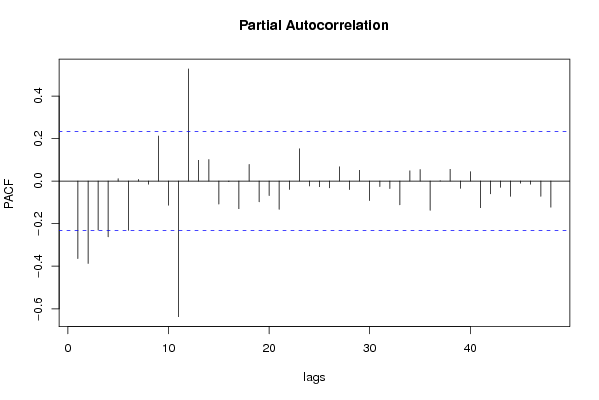
Partial Autocorrelation Function
Time lag kPACF(k)T-STATP-value
1-0.363898-3.06630.001533
2-0.386683-3.25820.000861
3-0.229807-1.93640.028401
4-0.261657-2.20480.015356
50.0111260.09380.462786
6-0.231082-1.94710.027737
70.007890.06650.473589
8-0.014602-0.1230.451213
90.2116111.78310.039425
10-0.112967-0.95190.172194
11-0.637019-5.36760
120.5271124.44151.6e-05
130.0979950.82570.205864
140.1011370.85220.198486
15-0.107741-0.90780.183517
16-0.00235-0.01980.492129
17-0.129822-1.09390.138848
180.0783480.66020.25564
19-0.097422-0.82090.207229
20-0.067892-0.57210.28454
21-0.132576-1.11710.133857
22-0.038996-0.32860.371717
230.1517751.27890.102553
24-0.022484-0.18950.425138
25-0.02628-0.22140.412694
26-0.031747-0.26750.394927
270.067010.56460.287052
28-0.039572-0.33340.369892
290.0508810.42870.334708
30-0.091703-0.77270.22113
31-0.02562-0.21590.41485
32-0.035244-0.2970.383679
33-0.1112-0.9370.17597
340.0486180.40970.341642
350.0540880.45580.32498
36-0.137266-1.15660.125652
370.001790.01510.494006
380.0553170.46610.321282
39-0.034112-0.28740.38731
400.0443860.3740.354759
41-0.124714-1.05090.148444
42-0.05948-0.50120.308893
43-0.029402-0.24770.402524
44-0.071318-0.60090.274899
45-0.00958-0.08070.467945
46-0.014288-0.12040.452256
47-0.07158-0.60310.274167
48-0.122448-1.03180.152843

\begin{tabular}{lllllllll}
\hline
Partial Autocorrelation Function \tabularnewline
Time lag k & PACF(k) & T-STAT & P-value \tabularnewline
1 & -0.363898 & -3.0663 & 0.001533 \tabularnewline
2 & -0.386683 & -3.2582 & 0.000861 \tabularnewline
3 & -0.229807 & -1.9364 & 0.028401 \tabularnewline
4 & -0.261657 & -2.2048 & 0.015356 \tabularnewline
5 & 0.011126 & 0.0938 & 0.462786 \tabularnewline
6 & -0.231082 & -1.9471 & 0.027737 \tabularnewline
7 & 0.00789 & 0.0665 & 0.473589 \tabularnewline
8 & -0.014602 & -0.123 & 0.451213 \tabularnewline
9 & 0.211611 & 1.7831 & 0.039425 \tabularnewline
10 & -0.112967 & -0.9519 & 0.172194 \tabularnewline
11 & -0.637019 & -5.3676 & 0 \tabularnewline
12 & 0.527112 & 4.4415 & 1.6e-05 \tabularnewline
13 & 0.097995 & 0.8257 & 0.205864 \tabularnewline
14 & 0.101137 & 0.8522 & 0.198486 \tabularnewline
15 & -0.107741 & -0.9078 & 0.183517 \tabularnewline
16 & -0.00235 & -0.0198 & 0.492129 \tabularnewline
17 & -0.129822 & -1.0939 & 0.138848 \tabularnewline
18 & 0.078348 & 0.6602 & 0.25564 \tabularnewline
19 & -0.097422 & -0.8209 & 0.207229 \tabularnewline
20 & -0.067892 & -0.5721 & 0.28454 \tabularnewline
21 & -0.132576 & -1.1171 & 0.133857 \tabularnewline
22 & -0.038996 & -0.3286 & 0.371717 \tabularnewline
23 & 0.151775 & 1.2789 & 0.102553 \tabularnewline
24 & -0.022484 & -0.1895 & 0.425138 \tabularnewline
25 & -0.02628 & -0.2214 & 0.412694 \tabularnewline
26 & -0.031747 & -0.2675 & 0.394927 \tabularnewline
27 & 0.06701 & 0.5646 & 0.287052 \tabularnewline
28 & -0.039572 & -0.3334 & 0.369892 \tabularnewline
29 & 0.050881 & 0.4287 & 0.334708 \tabularnewline
30 & -0.091703 & -0.7727 & 0.22113 \tabularnewline
31 & -0.02562 & -0.2159 & 0.41485 \tabularnewline
32 & -0.035244 & -0.297 & 0.383679 \tabularnewline
33 & -0.1112 & -0.937 & 0.17597 \tabularnewline
34 & 0.048618 & 0.4097 & 0.341642 \tabularnewline
35 & 0.054088 & 0.4558 & 0.32498 \tabularnewline
36 & -0.137266 & -1.1566 & 0.125652 \tabularnewline
37 & 0.00179 & 0.0151 & 0.494006 \tabularnewline
38 & 0.055317 & 0.4661 & 0.321282 \tabularnewline
39 & -0.034112 & -0.2874 & 0.38731 \tabularnewline
40 & 0.044386 & 0.374 & 0.354759 \tabularnewline
41 & -0.124714 & -1.0509 & 0.148444 \tabularnewline
42 & -0.05948 & -0.5012 & 0.308893 \tabularnewline
43 & -0.029402 & -0.2477 & 0.402524 \tabularnewline
44 & -0.071318 & -0.6009 & 0.274899 \tabularnewline
45 & -0.00958 & -0.0807 & 0.467945 \tabularnewline
46 & -0.014288 & -0.1204 & 0.452256 \tabularnewline
47 & -0.07158 & -0.6031 & 0.274167 \tabularnewline
48 & -0.122448 & -1.0318 & 0.152843 \tabularnewline
\hline
\end{tabular}
%Source: https://freestatistics.org/blog/index.php?pk=75199&T=2

[TABLE]
[ROW][C]Partial Autocorrelation Function[/C][/ROW]
[ROW][C]Time lag k[/C][C]PACF(k)[/C][C]T-STAT[/C][C]P-value[/C][/ROW]
[ROW][C]1[/C][C]-0.363898[/C][C]-3.0663[/C][C]0.001533[/C][/ROW]
[ROW][C]2[/C][C]-0.386683[/C][C]-3.2582[/C][C]0.000861[/C][/ROW]
[ROW][C]3[/C][C]-0.229807[/C][C]-1.9364[/C][C]0.028401[/C][/ROW]
[ROW][C]4[/C][C]-0.261657[/C][C]-2.2048[/C][C]0.015356[/C][/ROW]
[ROW][C]5[/C][C]0.011126[/C][C]0.0938[/C][C]0.462786[/C][/ROW]
[ROW][C]6[/C][C]-0.231082[/C][C]-1.9471[/C][C]0.027737[/C][/ROW]
[ROW][C]7[/C][C]0.00789[/C][C]0.0665[/C][C]0.473589[/C][/ROW]
[ROW][C]8[/C][C]-0.014602[/C][C]-0.123[/C][C]0.451213[/C][/ROW]
[ROW][C]9[/C][C]0.211611[/C][C]1.7831[/C][C]0.039425[/C][/ROW]
[ROW][C]10[/C][C]-0.112967[/C][C]-0.9519[/C][C]0.172194[/C][/ROW]
[ROW][C]11[/C][C]-0.637019[/C][C]-5.3676[/C][C]0[/C][/ROW]
[ROW][C]12[/C][C]0.527112[/C][C]4.4415[/C][C]1.6e-05[/C][/ROW]
[ROW][C]13[/C][C]0.097995[/C][C]0.8257[/C][C]0.205864[/C][/ROW]
[ROW][C]14[/C][C]0.101137[/C][C]0.8522[/C][C]0.198486[/C][/ROW]
[ROW][C]15[/C][C]-0.107741[/C][C]-0.9078[/C][C]0.183517[/C][/ROW]
[ROW][C]16[/C][C]-0.00235[/C][C]-0.0198[/C][C]0.492129[/C][/ROW]
[ROW][C]17[/C][C]-0.129822[/C][C]-1.0939[/C][C]0.138848[/C][/ROW]
[ROW][C]18[/C][C]0.078348[/C][C]0.6602[/C][C]0.25564[/C][/ROW]
[ROW][C]19[/C][C]-0.097422[/C][C]-0.8209[/C][C]0.207229[/C][/ROW]
[ROW][C]20[/C][C]-0.067892[/C][C]-0.5721[/C][C]0.28454[/C][/ROW]
[ROW][C]21[/C][C]-0.132576[/C][C]-1.1171[/C][C]0.133857[/C][/ROW]
[ROW][C]22[/C][C]-0.038996[/C][C]-0.3286[/C][C]0.371717[/C][/ROW]
[ROW][C]23[/C][C]0.151775[/C][C]1.2789[/C][C]0.102553[/C][/ROW]
[ROW][C]24[/C][C]-0.022484[/C][C]-0.1895[/C][C]0.425138[/C][/ROW]
[ROW][C]25[/C][C]-0.02628[/C][C]-0.2214[/C][C]0.412694[/C][/ROW]
[ROW][C]26[/C][C]-0.031747[/C][C]-0.2675[/C][C]0.394927[/C][/ROW]
[ROW][C]27[/C][C]0.06701[/C][C]0.5646[/C][C]0.287052[/C][/ROW]
[ROW][C]28[/C][C]-0.039572[/C][C]-0.3334[/C][C]0.369892[/C][/ROW]
[ROW][C]29[/C][C]0.050881[/C][C]0.4287[/C][C]0.334708[/C][/ROW]
[ROW][C]30[/C][C]-0.091703[/C][C]-0.7727[/C][C]0.22113[/C][/ROW]
[ROW][C]31[/C][C]-0.02562[/C][C]-0.2159[/C][C]0.41485[/C][/ROW]
[ROW][C]32[/C][C]-0.035244[/C][C]-0.297[/C][C]0.383679[/C][/ROW]
[ROW][C]33[/C][C]-0.1112[/C][C]-0.937[/C][C]0.17597[/C][/ROW]
[ROW][C]34[/C][C]0.048618[/C][C]0.4097[/C][C]0.341642[/C][/ROW]
[ROW][C]35[/C][C]0.054088[/C][C]0.4558[/C][C]0.32498[/C][/ROW]
[ROW][C]36[/C][C]-0.137266[/C][C]-1.1566[/C][C]0.125652[/C][/ROW]
[ROW][C]37[/C][C]0.00179[/C][C]0.0151[/C][C]0.494006[/C][/ROW]
[ROW][C]38[/C][C]0.055317[/C][C]0.4661[/C][C]0.321282[/C][/ROW]
[ROW][C]39[/C][C]-0.034112[/C][C]-0.2874[/C][C]0.38731[/C][/ROW]
[ROW][C]40[/C][C]0.044386[/C][C]0.374[/C][C]0.354759[/C][/ROW]
[ROW][C]41[/C][C]-0.124714[/C][C]-1.0509[/C][C]0.148444[/C][/ROW]
[ROW][C]42[/C][C]-0.05948[/C][C]-0.5012[/C][C]0.308893[/C][/ROW]
[ROW][C]43[/C][C]-0.029402[/C][C]-0.2477[/C][C]0.402524[/C][/ROW]
[ROW][C]44[/C][C]-0.071318[/C][C]-0.6009[/C][C]0.274899[/C][/ROW]
[ROW][C]45[/C][C]-0.00958[/C][C]-0.0807[/C][C]0.467945[/C][/ROW]
[ROW][C]46[/C][C]-0.014288[/C][C]-0.1204[/C][C]0.452256[/C][/ROW]
[ROW][C]47[/C][C]-0.07158[/C][C]-0.6031[/C][C]0.274167[/C][/ROW]
[ROW][C]48[/C][C]-0.122448[/C][C]-1.0318[/C][C]0.152843[/C][/ROW]
[/TABLE]
Source: https://freestatistics.org/blog/index.php?pk=75199&T=2

Globally Unique Identifier (entire table): ba.freestatistics.org/blog/index.php?pk=75199&T=2

As an alternative you can also use a QR Code:  

The GUIDs for individual cells are displayed in the table below:

Partial Autocorrelation Function
Time lag kPACF(k)T-STATP-value
1-0.363898-3.06630.001533
2-0.386683-3.25820.000861
3-0.229807-1.93640.028401
4-0.261657-2.20480.015356
50.0111260.09380.462786
6-0.231082-1.94710.027737
70.007890.06650.473589
8-0.014602-0.1230.451213
90.2116111.78310.039425
10-0.112967-0.95190.172194
11-0.637019-5.36760
120.5271124.44151.6e-05
130.0979950.82570.205864
140.1011370.85220.198486
15-0.107741-0.90780.183517
16-0.00235-0.01980.492129
17-0.129822-1.09390.138848
180.0783480.66020.25564
19-0.097422-0.82090.207229
20-0.067892-0.57210.28454
21-0.132576-1.11710.133857
22-0.038996-0.32860.371717
230.1517751.27890.102553
24-0.022484-0.18950.425138
25-0.02628-0.22140.412694
26-0.031747-0.26750.394927
270.067010.56460.287052
28-0.039572-0.33340.369892
290.0508810.42870.334708
30-0.091703-0.77270.22113
31-0.02562-0.21590.41485
32-0.035244-0.2970.383679
33-0.1112-0.9370.17597
340.0486180.40970.341642
350.0540880.45580.32498
36-0.137266-1.15660.125652
370.001790.01510.494006
380.0553170.46610.321282
39-0.034112-0.28740.38731
400.0443860.3740.354759
41-0.124714-1.05090.148444
42-0.05948-0.50120.308893
43-0.029402-0.24770.402524
44-0.071318-0.60090.274899
45-0.00958-0.08070.467945
46-0.014288-0.12040.452256
47-0.07158-0.60310.274167
48-0.122448-1.03180.152843


Parameters (Session):
par1 = 48 ; par2 = 1 ; par3 = 1 ; par4 = 0 ; par5 = 12 ; par6 = White Noise ; par7 = 0.95 ;
Parameters (R input):
par1 = 48 ; par2 = 1 ; par3 = 1 ; par4 = 0 ; par5 = 12 ; par6 = White Noise ; par7 = 0.95 ;
R code (references can be found in the software module):
if (par1 == 'Default') {
par1 = 10*log10(length(x))
} else {
par1 <- as.numeric(par1)
}
par2 <- as.numeric(par2)
par3 <- as.numeric(par3)
par4 <- as.numeric(par4)
par5 <- as.numeric(par5)
if (par6 == 'White Noise') par6 <- 'white' else par6 <- 'ma'
par7 <- as.numeric(par7)
if (par2 == 0) {
x <- log(x)
} else {
x <- (x ^ par2 - 1) / par2
}
if (par3 > 0) x <- diff(x,lag=1,difference=par3)
if (par4 > 0) x <- diff(x,lag=par5,difference=par4)
bitmap(file='pic1.png')
racf <- acf(x, par1, main='Autocorrelation', xlab='time lag', ylab='ACF', ci.type=par6, ci=par7, sub=paste('(lambda=',par2,', d=',par3,', D=',par4,', CI=', par7, ', CI type=',par6,')',sep=''))
dev.off()
bitmap(file='pic2.png')
rpacf <- pacf(x,par1,main='Partial Autocorrelation',xlab='lags',ylab='PACF')
dev.off()
(myacf <- c(racf$acf))
(mypacf <- c(rpacf$acf))
lengthx <- length(x)
sqrtn <- sqrt(lengthx)
load(file='createtable')
a<-table.start()
a<-table.row.start(a)
a<-table.element(a,'Autocorrelation Function',4,TRUE)
a<-table.row.end(a)
a<-table.row.start(a)
a<-table.element(a,'Time lag k',header=TRUE)
a<-table.element(a,hyperlink('basics.htm','ACF(k)','click here for more information about the Autocorrelation Function'),header=TRUE)
a<-table.element(a,'T-STAT',header=TRUE)
a<-table.element(a,'P-value',header=TRUE)
a<-table.row.end(a)
for (i in 2:(par1+1)) {
a<-table.row.start(a)
a<-table.element(a,i-1,header=TRUE)
a<-table.element(a,round(myacf[i],6))
mytstat <- myacf[i]*sqrtn
a<-table.element(a,round(mytstat,4))
a<-table.element(a,round(1-pt(abs(mytstat),lengthx),6))
a<-table.row.end(a)
}
a<-table.end(a)
table.save(a,file='mytable.tab')
a<-table.start()
a<-table.row.start(a)
a<-table.element(a,'Partial Autocorrelation Function',4,TRUE)
a<-table.row.end(a)
a<-table.row.start(a)
a<-table.element(a,'Time lag k',header=TRUE)
a<-table.element(a,hyperlink('basics.htm','PACF(k)','click here for more information about the Partial Autocorrelation Function'),header=TRUE)
a<-table.element(a,'T-STAT',header=TRUE)
a<-table.element(a,'P-value',header=TRUE)
a<-table.row.end(a)
for (i in 1:par1) {
a<-table.row.start(a)
a<-table.element(a,i,header=TRUE)
a<-table.element(a,round(mypacf[i],6))
mytstat <- mypacf[i]*sqrtn
a<-table.element(a,round(mytstat,4))
a<-table.element(a,round(1-pt(abs(mytstat),lengthx),6))
a<-table.row.end(a)
}
a<-table.end(a)
table.save(a,file='mytable1.tab')