Free Statistics

of Irreproducible Research!

Author's title

Author*Unverified author*
R Software Modulerwasp_autocorrelation.wasp
Title produced by software(Partial) Autocorrelation Function
Date of computationSun, 02 May 2010 09:30:44 +0000
Cite this page as followsStatistical Computations at FreeStatistics.org, Office for Research Development and Education, URL https://freestatistics.org/blog/index.php?v=date/2010/May/02/t1272792711h372za3ssz4pxus.htm/, Retrieved Wed, 01 May 2024 09:21:49 +0000
Statistical Computations at FreeStatistics.org, Office for Research Development and Education, URL https://freestatistics.org/blog/index.php?pk=75171, Retrieved Wed, 01 May 2024 09:21:49 +0000
QR Codes:

Original text written by user:
IsPrivate?No (this computation is public)
User-defined keywordsKDGP2W21
Estimated Impact202
Family? (F = Feedback message, R = changed R code, M = changed R Module, P = changed Parameters, D = changed Data)
-     [Univariate Data Series] [Uitvoer van België] [2010-02-04 08:24:53] [2ee36997fb1be82ef07372b18c1a823d]
- RMPD    [(Partial) Autocorrelation Function] [invoer en uitvoer...] [2010-05-02 09:30:44] [ea4db07d8da34007b79212461ea6aa7b] [Current]
Feedback Forum

Post a new message
Dataseries X:
18288.3
16049
16764.5
17880.2
16555.9
16087.1
16373.5
17842.2
22321.5
22786.7
18274.1
22392.9
23899.3
21343.5
22952.3
21374.4
21164.1
20906.5
17877.4
20664.3
22160
19813.6
17735.4
19640.2
20844.4
19823.1
18594.6
21350.6
18574.1
18924.2
17343.4
19961.2
19932.1
19464.6
16165.4
17574.9
19795.4
19439.5
17170
21072.4
17751.8
17515.5
18040.3
19090.1
17746.5
19202.1
15141.6
16258.1
18586.5
17209.4
17838.7
19123.5
16583.6
15991.2
16704.5
17422
17872
17823.2
13866.5
15912.8
17870.5
15420.3
16379.4
17903.9
15305.8
14583.3
14861
14968.9
16726.5
16283.6
11703.7
15101.8
15469.7
14956.9
15370.6
15998.1
14725.1
14768.9
13659.6
15070.3
16942.6
15761.3
12083
15023.6
15106.5


Summary of computational transaction
Raw Inputview raw input (R code)
Raw Outputview raw output of R engine
Computing time1 seconds
R Server'Gwilym Jenkins' @ 72.249.127.135

\begin{tabular}{lllllllll}
\hline
Summary of computational transaction \tabularnewline
Raw Input & view raw input (R code)  \tabularnewline
Raw Output & view raw output of R engine  \tabularnewline
Computing time & 1 seconds \tabularnewline
R Server & 'Gwilym Jenkins' @ 72.249.127.135 \tabularnewline
\hline
\end{tabular}
%Source: https://freestatistics.org/blog/index.php?pk=75171&T=0

[TABLE]
[ROW][C]Summary of computational transaction[/C][/ROW]
[ROW][C]Raw Input[/C][C]view raw input (R code) [/C][/ROW]
[ROW][C]Raw Output[/C][C]view raw output of R engine [/C][/ROW]
[ROW][C]Computing time[/C][C]1 seconds[/C][/ROW]
[ROW][C]R Server[/C][C]'Gwilym Jenkins' @ 72.249.127.135[/C][/ROW]
[/TABLE]
Source: https://freestatistics.org/blog/index.php?pk=75171&T=0

Globally Unique Identifier (entire table): ba.freestatistics.org/blog/index.php?pk=75171&T=0

As an alternative you can also use a QR Code:  

The GUIDs for individual cells are displayed in the table below:

Summary of computational transaction
Raw Inputview raw input (R code)
Raw Outputview raw output of R engine
Computing time1 seconds
R Server'Gwilym Jenkins' @ 72.249.127.135


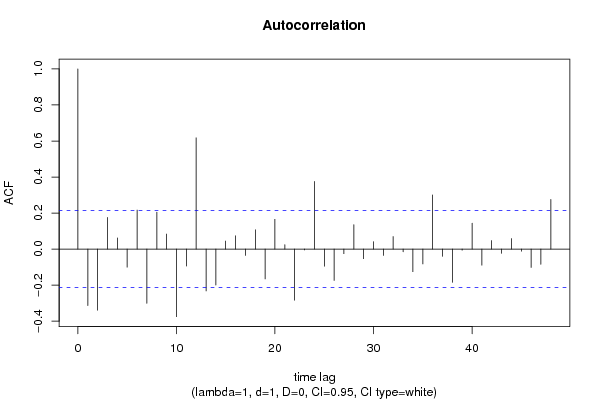
Autocorrelation Function
Time lag kACF(k)T-STATP-value
1-0.313218-2.87070.002591
2-0.33902-3.10720.001289
30.1761391.61430.055102
40.0619740.5680.285774
5-0.10019-0.91830.180557
60.2164261.98360.025285
7-0.300732-2.75630.003585
80.2048891.87780.031936
90.0839180.76910.22199
10-0.374852-3.43560.000461
11-0.094398-0.86520.194704
120.6179975.6640
13-0.231808-2.12460.018281
14-0.19925-1.82620.03569
150.0445040.40790.342198
160.0740340.67850.249648
17-0.035001-0.32080.374582
180.1071380.98190.164475
19-0.165292-1.51490.066773
200.1650781.5130.067021
210.0245940.22540.411106
22-0.283351-2.5970.005551
23-0.004766-0.04370.482631
240.3759513.44570.000446
25-0.094601-0.8670.194198
26-0.174036-1.59510.057226
27-0.02507-0.22980.409416
280.1355891.24270.108719
29-0.053097-0.48660.313889
300.0412590.37810.353138
31-0.034873-0.31960.375025
320.0695480.63740.262793
33-0.014894-0.13650.445873
34-0.125394-1.14930.126857
35-0.082034-0.75190.22712
360.3009682.75840.003563
37-0.04014-0.36790.356941
38-0.184015-1.68650.047703
39-0.005688-0.05210.479275
400.1441611.32130.095001
41-0.089259-0.81810.207815
420.0471780.43240.33328
43-0.023542-0.21580.414845
440.0585560.53670.296457
45-0.011477-0.10520.45824
46-0.101683-0.93190.177019
47-0.084397-0.77350.220696
480.2754922.52490.006726

\begin{tabular}{lllllllll}
\hline
Autocorrelation Function \tabularnewline
Time lag k & ACF(k) & T-STAT & P-value \tabularnewline
1 & -0.313218 & -2.8707 & 0.002591 \tabularnewline
2 & -0.33902 & -3.1072 & 0.001289 \tabularnewline
3 & 0.176139 & 1.6143 & 0.055102 \tabularnewline
4 & 0.061974 & 0.568 & 0.285774 \tabularnewline
5 & -0.10019 & -0.9183 & 0.180557 \tabularnewline
6 & 0.216426 & 1.9836 & 0.025285 \tabularnewline
7 & -0.300732 & -2.7563 & 0.003585 \tabularnewline
8 & 0.204889 & 1.8778 & 0.031936 \tabularnewline
9 & 0.083918 & 0.7691 & 0.22199 \tabularnewline
10 & -0.374852 & -3.4356 & 0.000461 \tabularnewline
11 & -0.094398 & -0.8652 & 0.194704 \tabularnewline
12 & 0.617997 & 5.664 & 0 \tabularnewline
13 & -0.231808 & -2.1246 & 0.018281 \tabularnewline
14 & -0.19925 & -1.8262 & 0.03569 \tabularnewline
15 & 0.044504 & 0.4079 & 0.342198 \tabularnewline
16 & 0.074034 & 0.6785 & 0.249648 \tabularnewline
17 & -0.035001 & -0.3208 & 0.374582 \tabularnewline
18 & 0.107138 & 0.9819 & 0.164475 \tabularnewline
19 & -0.165292 & -1.5149 & 0.066773 \tabularnewline
20 & 0.165078 & 1.513 & 0.067021 \tabularnewline
21 & 0.024594 & 0.2254 & 0.411106 \tabularnewline
22 & -0.283351 & -2.597 & 0.005551 \tabularnewline
23 & -0.004766 & -0.0437 & 0.482631 \tabularnewline
24 & 0.375951 & 3.4457 & 0.000446 \tabularnewline
25 & -0.094601 & -0.867 & 0.194198 \tabularnewline
26 & -0.174036 & -1.5951 & 0.057226 \tabularnewline
27 & -0.02507 & -0.2298 & 0.409416 \tabularnewline
28 & 0.135589 & 1.2427 & 0.108719 \tabularnewline
29 & -0.053097 & -0.4866 & 0.313889 \tabularnewline
30 & 0.041259 & 0.3781 & 0.353138 \tabularnewline
31 & -0.034873 & -0.3196 & 0.375025 \tabularnewline
32 & 0.069548 & 0.6374 & 0.262793 \tabularnewline
33 & -0.014894 & -0.1365 & 0.445873 \tabularnewline
34 & -0.125394 & -1.1493 & 0.126857 \tabularnewline
35 & -0.082034 & -0.7519 & 0.22712 \tabularnewline
36 & 0.300968 & 2.7584 & 0.003563 \tabularnewline
37 & -0.04014 & -0.3679 & 0.356941 \tabularnewline
38 & -0.184015 & -1.6865 & 0.047703 \tabularnewline
39 & -0.005688 & -0.0521 & 0.479275 \tabularnewline
40 & 0.144161 & 1.3213 & 0.095001 \tabularnewline
41 & -0.089259 & -0.8181 & 0.207815 \tabularnewline
42 & 0.047178 & 0.4324 & 0.33328 \tabularnewline
43 & -0.023542 & -0.2158 & 0.414845 \tabularnewline
44 & 0.058556 & 0.5367 & 0.296457 \tabularnewline
45 & -0.011477 & -0.1052 & 0.45824 \tabularnewline
46 & -0.101683 & -0.9319 & 0.177019 \tabularnewline
47 & -0.084397 & -0.7735 & 0.220696 \tabularnewline
48 & 0.275492 & 2.5249 & 0.006726 \tabularnewline
\hline
\end{tabular}
%Source: https://freestatistics.org/blog/index.php?pk=75171&T=1

[TABLE]
[ROW][C]Autocorrelation Function[/C][/ROW]
[ROW][C]Time lag k[/C][C]ACF(k)[/C][C]T-STAT[/C][C]P-value[/C][/ROW]
[ROW][C]1[/C][C]-0.313218[/C][C]-2.8707[/C][C]0.002591[/C][/ROW]
[ROW][C]2[/C][C]-0.33902[/C][C]-3.1072[/C][C]0.001289[/C][/ROW]
[ROW][C]3[/C][C]0.176139[/C][C]1.6143[/C][C]0.055102[/C][/ROW]
[ROW][C]4[/C][C]0.061974[/C][C]0.568[/C][C]0.285774[/C][/ROW]
[ROW][C]5[/C][C]-0.10019[/C][C]-0.9183[/C][C]0.180557[/C][/ROW]
[ROW][C]6[/C][C]0.216426[/C][C]1.9836[/C][C]0.025285[/C][/ROW]
[ROW][C]7[/C][C]-0.300732[/C][C]-2.7563[/C][C]0.003585[/C][/ROW]
[ROW][C]8[/C][C]0.204889[/C][C]1.8778[/C][C]0.031936[/C][/ROW]
[ROW][C]9[/C][C]0.083918[/C][C]0.7691[/C][C]0.22199[/C][/ROW]
[ROW][C]10[/C][C]-0.374852[/C][C]-3.4356[/C][C]0.000461[/C][/ROW]
[ROW][C]11[/C][C]-0.094398[/C][C]-0.8652[/C][C]0.194704[/C][/ROW]
[ROW][C]12[/C][C]0.617997[/C][C]5.664[/C][C]0[/C][/ROW]
[ROW][C]13[/C][C]-0.231808[/C][C]-2.1246[/C][C]0.018281[/C][/ROW]
[ROW][C]14[/C][C]-0.19925[/C][C]-1.8262[/C][C]0.03569[/C][/ROW]
[ROW][C]15[/C][C]0.044504[/C][C]0.4079[/C][C]0.342198[/C][/ROW]
[ROW][C]16[/C][C]0.074034[/C][C]0.6785[/C][C]0.249648[/C][/ROW]
[ROW][C]17[/C][C]-0.035001[/C][C]-0.3208[/C][C]0.374582[/C][/ROW]
[ROW][C]18[/C][C]0.107138[/C][C]0.9819[/C][C]0.164475[/C][/ROW]
[ROW][C]19[/C][C]-0.165292[/C][C]-1.5149[/C][C]0.066773[/C][/ROW]
[ROW][C]20[/C][C]0.165078[/C][C]1.513[/C][C]0.067021[/C][/ROW]
[ROW][C]21[/C][C]0.024594[/C][C]0.2254[/C][C]0.411106[/C][/ROW]
[ROW][C]22[/C][C]-0.283351[/C][C]-2.597[/C][C]0.005551[/C][/ROW]
[ROW][C]23[/C][C]-0.004766[/C][C]-0.0437[/C][C]0.482631[/C][/ROW]
[ROW][C]24[/C][C]0.375951[/C][C]3.4457[/C][C]0.000446[/C][/ROW]
[ROW][C]25[/C][C]-0.094601[/C][C]-0.867[/C][C]0.194198[/C][/ROW]
[ROW][C]26[/C][C]-0.174036[/C][C]-1.5951[/C][C]0.057226[/C][/ROW]
[ROW][C]27[/C][C]-0.02507[/C][C]-0.2298[/C][C]0.409416[/C][/ROW]
[ROW][C]28[/C][C]0.135589[/C][C]1.2427[/C][C]0.108719[/C][/ROW]
[ROW][C]29[/C][C]-0.053097[/C][C]-0.4866[/C][C]0.313889[/C][/ROW]
[ROW][C]30[/C][C]0.041259[/C][C]0.3781[/C][C]0.353138[/C][/ROW]
[ROW][C]31[/C][C]-0.034873[/C][C]-0.3196[/C][C]0.375025[/C][/ROW]
[ROW][C]32[/C][C]0.069548[/C][C]0.6374[/C][C]0.262793[/C][/ROW]
[ROW][C]33[/C][C]-0.014894[/C][C]-0.1365[/C][C]0.445873[/C][/ROW]
[ROW][C]34[/C][C]-0.125394[/C][C]-1.1493[/C][C]0.126857[/C][/ROW]
[ROW][C]35[/C][C]-0.082034[/C][C]-0.7519[/C][C]0.22712[/C][/ROW]
[ROW][C]36[/C][C]0.300968[/C][C]2.7584[/C][C]0.003563[/C][/ROW]
[ROW][C]37[/C][C]-0.04014[/C][C]-0.3679[/C][C]0.356941[/C][/ROW]
[ROW][C]38[/C][C]-0.184015[/C][C]-1.6865[/C][C]0.047703[/C][/ROW]
[ROW][C]39[/C][C]-0.005688[/C][C]-0.0521[/C][C]0.479275[/C][/ROW]
[ROW][C]40[/C][C]0.144161[/C][C]1.3213[/C][C]0.095001[/C][/ROW]
[ROW][C]41[/C][C]-0.089259[/C][C]-0.8181[/C][C]0.207815[/C][/ROW]
[ROW][C]42[/C][C]0.047178[/C][C]0.4324[/C][C]0.33328[/C][/ROW]
[ROW][C]43[/C][C]-0.023542[/C][C]-0.2158[/C][C]0.414845[/C][/ROW]
[ROW][C]44[/C][C]0.058556[/C][C]0.5367[/C][C]0.296457[/C][/ROW]
[ROW][C]45[/C][C]-0.011477[/C][C]-0.1052[/C][C]0.45824[/C][/ROW]
[ROW][C]46[/C][C]-0.101683[/C][C]-0.9319[/C][C]0.177019[/C][/ROW]
[ROW][C]47[/C][C]-0.084397[/C][C]-0.7735[/C][C]0.220696[/C][/ROW]
[ROW][C]48[/C][C]0.275492[/C][C]2.5249[/C][C]0.006726[/C][/ROW]
[/TABLE]
Source: https://freestatistics.org/blog/index.php?pk=75171&T=1

Globally Unique Identifier (entire table): ba.freestatistics.org/blog/index.php?pk=75171&T=1

As an alternative you can also use a QR Code:  

The GUIDs for individual cells are displayed in the table below:

Autocorrelation Function
Time lag kACF(k)T-STATP-value
1-0.313218-2.87070.002591
2-0.33902-3.10720.001289
30.1761391.61430.055102
40.0619740.5680.285774
5-0.10019-0.91830.180557
60.2164261.98360.025285
7-0.300732-2.75630.003585
80.2048891.87780.031936
90.0839180.76910.22199
10-0.374852-3.43560.000461
11-0.094398-0.86520.194704
120.6179975.6640
13-0.231808-2.12460.018281
14-0.19925-1.82620.03569
150.0445040.40790.342198
160.0740340.67850.249648
17-0.035001-0.32080.374582
180.1071380.98190.164475
19-0.165292-1.51490.066773
200.1650781.5130.067021
210.0245940.22540.411106
22-0.283351-2.5970.005551
23-0.004766-0.04370.482631
240.3759513.44570.000446
25-0.094601-0.8670.194198
26-0.174036-1.59510.057226
27-0.02507-0.22980.409416
280.1355891.24270.108719
29-0.053097-0.48660.313889
300.0412590.37810.353138
31-0.034873-0.31960.375025
320.0695480.63740.262793
33-0.014894-0.13650.445873
34-0.125394-1.14930.126857
35-0.082034-0.75190.22712
360.3009682.75840.003563
37-0.04014-0.36790.356941
38-0.184015-1.68650.047703
39-0.005688-0.05210.479275
400.1441611.32130.095001
41-0.089259-0.81810.207815
420.0471780.43240.33328
43-0.023542-0.21580.414845
440.0585560.53670.296457
45-0.011477-0.10520.45824
46-0.101683-0.93190.177019
47-0.084397-0.77350.220696
480.2754922.52490.006726


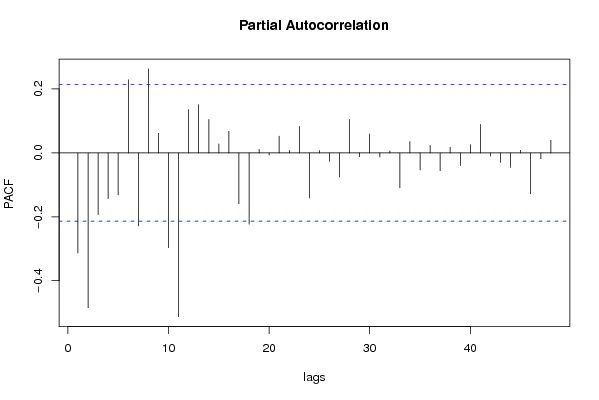
Partial Autocorrelation Function
Time lag kPACF(k)T-STATP-value
1-0.313218-2.87070.002591
2-0.484675-4.44211.3e-05
3-0.193214-1.77080.040108
4-0.142886-1.30960.096955
5-0.131427-1.20450.11588
60.2287632.09660.019516
7-0.228704-2.09610.019541
80.2627282.40790.009116
90.0611120.56010.28845
10-0.296885-2.7210.003955
11-0.512674-4.69875e-06
120.1357121.24380.108513
130.1508441.38250.08524
140.1043320.95620.170852
150.0280850.25740.39875
160.067510.61870.268882
17-0.158888-1.45620.074528
18-0.223069-2.04450.02202
190.0109930.10070.459995
20-0.006373-0.05840.476781
210.0522270.47870.31671
220.0078260.07170.471494
230.08270.7580.225298
24-0.141253-1.29460.099502
250.0073620.06750.473183
26-0.026555-0.24340.404153
27-0.075383-0.69090.245767
280.1045840.95850.170275
29-0.012337-0.11310.455121
300.059380.54420.293863
31-0.01258-0.11530.454241
320.0061040.05590.47776
33-0.109359-1.00230.159542
340.035450.32490.37303
35-0.053573-0.4910.312351
360.0234670.21510.415113
37-0.055728-0.51080.30543
380.0179030.16410.435029
39-0.039592-0.36290.358809
400.0255230.23390.407807
410.0891570.81710.208082
42-0.01013-0.09280.463125
43-0.030054-0.27550.391823
44-0.045698-0.41880.338207
450.007970.0730.470972
46-0.128074-1.17380.121893
47-0.018237-0.16710.433829
480.0394680.36170.35923

\begin{tabular}{lllllllll}
\hline
Partial Autocorrelation Function \tabularnewline
Time lag k & PACF(k) & T-STAT & P-value \tabularnewline
1 & -0.313218 & -2.8707 & 0.002591 \tabularnewline
2 & -0.484675 & -4.4421 & 1.3e-05 \tabularnewline
3 & -0.193214 & -1.7708 & 0.040108 \tabularnewline
4 & -0.142886 & -1.3096 & 0.096955 \tabularnewline
5 & -0.131427 & -1.2045 & 0.11588 \tabularnewline
6 & 0.228763 & 2.0966 & 0.019516 \tabularnewline
7 & -0.228704 & -2.0961 & 0.019541 \tabularnewline
8 & 0.262728 & 2.4079 & 0.009116 \tabularnewline
9 & 0.061112 & 0.5601 & 0.28845 \tabularnewline
10 & -0.296885 & -2.721 & 0.003955 \tabularnewline
11 & -0.512674 & -4.6987 & 5e-06 \tabularnewline
12 & 0.135712 & 1.2438 & 0.108513 \tabularnewline
13 & 0.150844 & 1.3825 & 0.08524 \tabularnewline
14 & 0.104332 & 0.9562 & 0.170852 \tabularnewline
15 & 0.028085 & 0.2574 & 0.39875 \tabularnewline
16 & 0.06751 & 0.6187 & 0.268882 \tabularnewline
17 & -0.158888 & -1.4562 & 0.074528 \tabularnewline
18 & -0.223069 & -2.0445 & 0.02202 \tabularnewline
19 & 0.010993 & 0.1007 & 0.459995 \tabularnewline
20 & -0.006373 & -0.0584 & 0.476781 \tabularnewline
21 & 0.052227 & 0.4787 & 0.31671 \tabularnewline
22 & 0.007826 & 0.0717 & 0.471494 \tabularnewline
23 & 0.0827 & 0.758 & 0.225298 \tabularnewline
24 & -0.141253 & -1.2946 & 0.099502 \tabularnewline
25 & 0.007362 & 0.0675 & 0.473183 \tabularnewline
26 & -0.026555 & -0.2434 & 0.404153 \tabularnewline
27 & -0.075383 & -0.6909 & 0.245767 \tabularnewline
28 & 0.104584 & 0.9585 & 0.170275 \tabularnewline
29 & -0.012337 & -0.1131 & 0.455121 \tabularnewline
30 & 0.05938 & 0.5442 & 0.293863 \tabularnewline
31 & -0.01258 & -0.1153 & 0.454241 \tabularnewline
32 & 0.006104 & 0.0559 & 0.47776 \tabularnewline
33 & -0.109359 & -1.0023 & 0.159542 \tabularnewline
34 & 0.03545 & 0.3249 & 0.37303 \tabularnewline
35 & -0.053573 & -0.491 & 0.312351 \tabularnewline
36 & 0.023467 & 0.2151 & 0.415113 \tabularnewline
37 & -0.055728 & -0.5108 & 0.30543 \tabularnewline
38 & 0.017903 & 0.1641 & 0.435029 \tabularnewline
39 & -0.039592 & -0.3629 & 0.358809 \tabularnewline
40 & 0.025523 & 0.2339 & 0.407807 \tabularnewline
41 & 0.089157 & 0.8171 & 0.208082 \tabularnewline
42 & -0.01013 & -0.0928 & 0.463125 \tabularnewline
43 & -0.030054 & -0.2755 & 0.391823 \tabularnewline
44 & -0.045698 & -0.4188 & 0.338207 \tabularnewline
45 & 0.00797 & 0.073 & 0.470972 \tabularnewline
46 & -0.128074 & -1.1738 & 0.121893 \tabularnewline
47 & -0.018237 & -0.1671 & 0.433829 \tabularnewline
48 & 0.039468 & 0.3617 & 0.35923 \tabularnewline
\hline
\end{tabular}
%Source: https://freestatistics.org/blog/index.php?pk=75171&T=2

[TABLE]
[ROW][C]Partial Autocorrelation Function[/C][/ROW]
[ROW][C]Time lag k[/C][C]PACF(k)[/C][C]T-STAT[/C][C]P-value[/C][/ROW]
[ROW][C]1[/C][C]-0.313218[/C][C]-2.8707[/C][C]0.002591[/C][/ROW]
[ROW][C]2[/C][C]-0.484675[/C][C]-4.4421[/C][C]1.3e-05[/C][/ROW]
[ROW][C]3[/C][C]-0.193214[/C][C]-1.7708[/C][C]0.040108[/C][/ROW]
[ROW][C]4[/C][C]-0.142886[/C][C]-1.3096[/C][C]0.096955[/C][/ROW]
[ROW][C]5[/C][C]-0.131427[/C][C]-1.2045[/C][C]0.11588[/C][/ROW]
[ROW][C]6[/C][C]0.228763[/C][C]2.0966[/C][C]0.019516[/C][/ROW]
[ROW][C]7[/C][C]-0.228704[/C][C]-2.0961[/C][C]0.019541[/C][/ROW]
[ROW][C]8[/C][C]0.262728[/C][C]2.4079[/C][C]0.009116[/C][/ROW]
[ROW][C]9[/C][C]0.061112[/C][C]0.5601[/C][C]0.28845[/C][/ROW]
[ROW][C]10[/C][C]-0.296885[/C][C]-2.721[/C][C]0.003955[/C][/ROW]
[ROW][C]11[/C][C]-0.512674[/C][C]-4.6987[/C][C]5e-06[/C][/ROW]
[ROW][C]12[/C][C]0.135712[/C][C]1.2438[/C][C]0.108513[/C][/ROW]
[ROW][C]13[/C][C]0.150844[/C][C]1.3825[/C][C]0.08524[/C][/ROW]
[ROW][C]14[/C][C]0.104332[/C][C]0.9562[/C][C]0.170852[/C][/ROW]
[ROW][C]15[/C][C]0.028085[/C][C]0.2574[/C][C]0.39875[/C][/ROW]
[ROW][C]16[/C][C]0.06751[/C][C]0.6187[/C][C]0.268882[/C][/ROW]
[ROW][C]17[/C][C]-0.158888[/C][C]-1.4562[/C][C]0.074528[/C][/ROW]
[ROW][C]18[/C][C]-0.223069[/C][C]-2.0445[/C][C]0.02202[/C][/ROW]
[ROW][C]19[/C][C]0.010993[/C][C]0.1007[/C][C]0.459995[/C][/ROW]
[ROW][C]20[/C][C]-0.006373[/C][C]-0.0584[/C][C]0.476781[/C][/ROW]
[ROW][C]21[/C][C]0.052227[/C][C]0.4787[/C][C]0.31671[/C][/ROW]
[ROW][C]22[/C][C]0.007826[/C][C]0.0717[/C][C]0.471494[/C][/ROW]
[ROW][C]23[/C][C]0.0827[/C][C]0.758[/C][C]0.225298[/C][/ROW]
[ROW][C]24[/C][C]-0.141253[/C][C]-1.2946[/C][C]0.099502[/C][/ROW]
[ROW][C]25[/C][C]0.007362[/C][C]0.0675[/C][C]0.473183[/C][/ROW]
[ROW][C]26[/C][C]-0.026555[/C][C]-0.2434[/C][C]0.404153[/C][/ROW]
[ROW][C]27[/C][C]-0.075383[/C][C]-0.6909[/C][C]0.245767[/C][/ROW]
[ROW][C]28[/C][C]0.104584[/C][C]0.9585[/C][C]0.170275[/C][/ROW]
[ROW][C]29[/C][C]-0.012337[/C][C]-0.1131[/C][C]0.455121[/C][/ROW]
[ROW][C]30[/C][C]0.05938[/C][C]0.5442[/C][C]0.293863[/C][/ROW]
[ROW][C]31[/C][C]-0.01258[/C][C]-0.1153[/C][C]0.454241[/C][/ROW]
[ROW][C]32[/C][C]0.006104[/C][C]0.0559[/C][C]0.47776[/C][/ROW]
[ROW][C]33[/C][C]-0.109359[/C][C]-1.0023[/C][C]0.159542[/C][/ROW]
[ROW][C]34[/C][C]0.03545[/C][C]0.3249[/C][C]0.37303[/C][/ROW]
[ROW][C]35[/C][C]-0.053573[/C][C]-0.491[/C][C]0.312351[/C][/ROW]
[ROW][C]36[/C][C]0.023467[/C][C]0.2151[/C][C]0.415113[/C][/ROW]
[ROW][C]37[/C][C]-0.055728[/C][C]-0.5108[/C][C]0.30543[/C][/ROW]
[ROW][C]38[/C][C]0.017903[/C][C]0.1641[/C][C]0.435029[/C][/ROW]
[ROW][C]39[/C][C]-0.039592[/C][C]-0.3629[/C][C]0.358809[/C][/ROW]
[ROW][C]40[/C][C]0.025523[/C][C]0.2339[/C][C]0.407807[/C][/ROW]
[ROW][C]41[/C][C]0.089157[/C][C]0.8171[/C][C]0.208082[/C][/ROW]
[ROW][C]42[/C][C]-0.01013[/C][C]-0.0928[/C][C]0.463125[/C][/ROW]
[ROW][C]43[/C][C]-0.030054[/C][C]-0.2755[/C][C]0.391823[/C][/ROW]
[ROW][C]44[/C][C]-0.045698[/C][C]-0.4188[/C][C]0.338207[/C][/ROW]
[ROW][C]45[/C][C]0.00797[/C][C]0.073[/C][C]0.470972[/C][/ROW]
[ROW][C]46[/C][C]-0.128074[/C][C]-1.1738[/C][C]0.121893[/C][/ROW]
[ROW][C]47[/C][C]-0.018237[/C][C]-0.1671[/C][C]0.433829[/C][/ROW]
[ROW][C]48[/C][C]0.039468[/C][C]0.3617[/C][C]0.35923[/C][/ROW]
[/TABLE]
Source: https://freestatistics.org/blog/index.php?pk=75171&T=2

Globally Unique Identifier (entire table): ba.freestatistics.org/blog/index.php?pk=75171&T=2

As an alternative you can also use a QR Code:  

The GUIDs for individual cells are displayed in the table below:

Partial Autocorrelation Function
Time lag kPACF(k)T-STATP-value
1-0.313218-2.87070.002591
2-0.484675-4.44211.3e-05
3-0.193214-1.77080.040108
4-0.142886-1.30960.096955
5-0.131427-1.20450.11588
60.2287632.09660.019516
7-0.228704-2.09610.019541
80.2627282.40790.009116
90.0611120.56010.28845
10-0.296885-2.7210.003955
11-0.512674-4.69875e-06
120.1357121.24380.108513
130.1508441.38250.08524
140.1043320.95620.170852
150.0280850.25740.39875
160.067510.61870.268882
17-0.158888-1.45620.074528
18-0.223069-2.04450.02202
190.0109930.10070.459995
20-0.006373-0.05840.476781
210.0522270.47870.31671
220.0078260.07170.471494
230.08270.7580.225298
24-0.141253-1.29460.099502
250.0073620.06750.473183
26-0.026555-0.24340.404153
27-0.075383-0.69090.245767
280.1045840.95850.170275
29-0.012337-0.11310.455121
300.059380.54420.293863
31-0.01258-0.11530.454241
320.0061040.05590.47776
33-0.109359-1.00230.159542
340.035450.32490.37303
35-0.053573-0.4910.312351
360.0234670.21510.415113
37-0.055728-0.51080.30543
380.0179030.16410.435029
39-0.039592-0.36290.358809
400.0255230.23390.407807
410.0891570.81710.208082
42-0.01013-0.09280.463125
43-0.030054-0.27550.391823
44-0.045698-0.41880.338207
450.007970.0730.470972
46-0.128074-1.17380.121893
47-0.018237-0.16710.433829
480.0394680.36170.35923


Parameters (Session):
par1 = 48 ; par2 = 1 ; par3 = 1 ; par4 = 0 ; par5 = 12 ; par6 = White Noise ; par7 = 0.95 ;
Parameters (R input):
par1 = 48 ; par2 = 1 ; par3 = 1 ; par4 = 0 ; par5 = 12 ; par6 = White Noise ; par7 = 0.95 ;
R code (references can be found in the software module):
if (par1 == 'Default') {
par1 = 10*log10(length(x))
} else {
par1 <- as.numeric(par1)
}
par2 <- as.numeric(par2)
par3 <- as.numeric(par3)
par4 <- as.numeric(par4)
par5 <- as.numeric(par5)
if (par6 == 'White Noise') par6 <- 'white' else par6 <- 'ma'
par7 <- as.numeric(par7)
if (par2 == 0) {
x <- log(x)
} else {
x <- (x ^ par2 - 1) / par2
}
if (par3 > 0) x <- diff(x,lag=1,difference=par3)
if (par4 > 0) x <- diff(x,lag=par5,difference=par4)
bitmap(file='pic1.png')
racf <- acf(x, par1, main='Autocorrelation', xlab='time lag', ylab='ACF', ci.type=par6, ci=par7, sub=paste('(lambda=',par2,', d=',par3,', D=',par4,', CI=', par7, ', CI type=',par6,')',sep=''))
dev.off()
bitmap(file='pic2.png')
rpacf <- pacf(x,par1,main='Partial Autocorrelation',xlab='lags',ylab='PACF')
dev.off()
(myacf <- c(racf$acf))
(mypacf <- c(rpacf$acf))
lengthx <- length(x)
sqrtn <- sqrt(lengthx)
load(file='createtable')
a<-table.start()
a<-table.row.start(a)
a<-table.element(a,'Autocorrelation Function',4,TRUE)
a<-table.row.end(a)
a<-table.row.start(a)
a<-table.element(a,'Time lag k',header=TRUE)
a<-table.element(a,hyperlink('basics.htm','ACF(k)','click here for more information about the Autocorrelation Function'),header=TRUE)
a<-table.element(a,'T-STAT',header=TRUE)
a<-table.element(a,'P-value',header=TRUE)
a<-table.row.end(a)
for (i in 2:(par1+1)) {
a<-table.row.start(a)
a<-table.element(a,i-1,header=TRUE)
a<-table.element(a,round(myacf[i],6))
mytstat <- myacf[i]*sqrtn
a<-table.element(a,round(mytstat,4))
a<-table.element(a,round(1-pt(abs(mytstat),lengthx),6))
a<-table.row.end(a)
}
a<-table.end(a)
table.save(a,file='mytable.tab')
a<-table.start()
a<-table.row.start(a)
a<-table.element(a,'Partial Autocorrelation Function',4,TRUE)
a<-table.row.end(a)
a<-table.row.start(a)
a<-table.element(a,'Time lag k',header=TRUE)
a<-table.element(a,hyperlink('basics.htm','PACF(k)','click here for more information about the Partial Autocorrelation Function'),header=TRUE)
a<-table.element(a,'T-STAT',header=TRUE)
a<-table.element(a,'P-value',header=TRUE)
a<-table.row.end(a)
for (i in 1:par1) {
a<-table.row.start(a)
a<-table.element(a,i,header=TRUE)
a<-table.element(a,round(mypacf[i],6))
mytstat <- mypacf[i]*sqrtn
a<-table.element(a,round(mytstat,4))
a<-table.element(a,round(1-pt(abs(mytstat),lengthx),6))
a<-table.row.end(a)
}
a<-table.end(a)
table.save(a,file='mytable1.tab')