Free Statistics

of Irreproducible Research!

Author's title

Author*Unverified author*
R Software Modulerwasp_autocorrelation.wasp
Title produced by software(Partial) Autocorrelation Function
Date of computationSat, 01 May 2010 19:05:51 +0000
Cite this page as followsStatistical Computations at FreeStatistics.org, Office for Research Development and Education, URL https://freestatistics.org/blog/index.php?v=date/2010/May/01/t1272740803acawrwmw2nqj6ui.htm/, Retrieved Sun, 28 Apr 2024 14:23:02 +0000
Statistical Computations at FreeStatistics.org, Office for Research Development and Education, URL https://freestatistics.org/blog/index.php?pk=75160, Retrieved Sun, 28 Apr 2024 14:23:02 +0000
QR Codes:

Original text written by user:
IsPrivate?No (this computation is public)
User-defined keywordsKDGP2W21
Estimated Impact108
Family? (F = Feedback message, R = changed R code, M = changed R Module, P = changed Parameters, D = changed Data)
-       [(Partial) Autocorrelation Function] [] [2010-05-01 19:05:51] [d41d8cd98f00b204e9800998ecf8427e] [Current]
Feedback Forum

Post a new message
Dataseries X:
6550
8728
12026
14395
14587
13791
9498
8251
7049
9545
9364
8456
7237
9374
11837
13784
15926
13821
11143
7975
7610
10015
12759
8816
10677
10947
15200
17010
20900
16205
12143
8997
5568
11474
12256
10583
10862
10965
14405
20379
20128
17816
12268
8642
7962
13932
15936
12628
12267
12470
18944
21259
22015
18581
15175
10306
10792
14752
13754
11738
12181
12965
19990
23125
23541
21247
15189
14767
10895
17130
17697
16611
12674
12760
20249
22135
20677
19933
15388
15113
13401
16135
17562
14720
12225
11608
20985
19692
24081
22114
14220
13434
13598
17187
16119
13713
13210
14251
20139
21725
26099
21084
18024
16722
14385
21342
17180
14577


Summary of computational transaction
Raw Inputview raw input (R code)
Raw Outputview raw output of R engine
Computing time4 seconds
R Server'George Udny Yule' @ 72.249.76.132

\begin{tabular}{lllllllll}
\hline
Summary of computational transaction \tabularnewline
Raw Input & view raw input (R code)  \tabularnewline
Raw Output & view raw output of R engine  \tabularnewline
Computing time & 4 seconds \tabularnewline
R Server & 'George Udny Yule' @ 72.249.76.132 \tabularnewline
\hline
\end{tabular}
%Source: https://freestatistics.org/blog/index.php?pk=75160&T=0

[TABLE]
[ROW][C]Summary of computational transaction[/C][/ROW]
[ROW][C]Raw Input[/C][C]view raw input (R code) [/C][/ROW]
[ROW][C]Raw Output[/C][C]view raw output of R engine [/C][/ROW]
[ROW][C]Computing time[/C][C]4 seconds[/C][/ROW]
[ROW][C]R Server[/C][C]'George Udny Yule' @ 72.249.76.132[/C][/ROW]
[/TABLE]
Source: https://freestatistics.org/blog/index.php?pk=75160&T=0

Globally Unique Identifier (entire table): ba.freestatistics.org/blog/index.php?pk=75160&T=0

As an alternative you can also use a QR Code:  

The GUIDs for individual cells are displayed in the table below:

Summary of computational transaction
Raw Inputview raw input (R code)
Raw Outputview raw output of R engine
Computing time4 seconds
R Server'George Udny Yule' @ 72.249.76.132


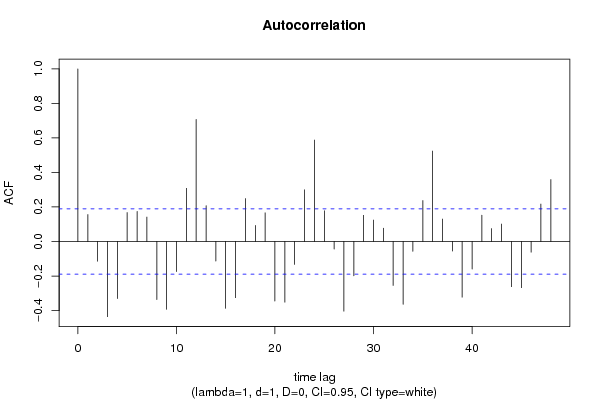
Autocorrelation Function
Time lag kACF(k)T-STATP-value
10.156041.61410.054727
2-0.11403-1.17950.120401
3-0.435596-4.50588e-06
4-0.330764-3.42140.000442
50.1679391.73720.042617
60.1743371.80340.037073
70.1419131.4680.072525
8-0.33629-3.47860.000365
9-0.393299-4.06834.5e-05
10-0.174195-1.80190.037189
110.3083273.18940.000935
120.707137.31460
130.2075772.14720.017018
14-0.113583-1.17490.121319
15-0.387129-4.00455.7e-05
16-0.325896-3.37110.000521
170.2489182.57480.005698
180.0933070.96520.168316
190.1663281.72050.044116
20-0.345214-3.57090.000267
21-0.351857-3.63960.000211
22-0.133099-1.37680.085727
230.2992213.09520.001255
240.5881226.08360
250.1779721.8410.034199
26-0.044046-0.45560.324795
27-0.403897-4.17793e-05
28-0.198939-2.05780.021018
290.1518071.57030.059648
300.1239481.28210.101285
310.0772930.79950.212878
32-0.254638-2.6340.004845
33-0.363818-3.76340.000137
34-0.057128-0.59090.277904
350.2369252.45080.007938
360.5244455.42490
370.1298521.34320.091025
38-0.055783-0.5770.282569
39-0.322908-3.34020.000577
40-0.159573-1.65060.050873
410.1525211.57770.058794
420.0746060.77170.220989
430.1013091.04790.148512
44-0.261667-2.70670.003956
45-0.267758-2.76970.003308
46-0.061859-0.63990.261811
470.216652.2410.013544
480.3587673.71110.000165

\begin{tabular}{lllllllll}
\hline
Autocorrelation Function \tabularnewline
Time lag k & ACF(k) & T-STAT & P-value \tabularnewline
1 & 0.15604 & 1.6141 & 0.054727 \tabularnewline
2 & -0.11403 & -1.1795 & 0.120401 \tabularnewline
3 & -0.435596 & -4.5058 & 8e-06 \tabularnewline
4 & -0.330764 & -3.4214 & 0.000442 \tabularnewline
5 & 0.167939 & 1.7372 & 0.042617 \tabularnewline
6 & 0.174337 & 1.8034 & 0.037073 \tabularnewline
7 & 0.141913 & 1.468 & 0.072525 \tabularnewline
8 & -0.33629 & -3.4786 & 0.000365 \tabularnewline
9 & -0.393299 & -4.0683 & 4.5e-05 \tabularnewline
10 & -0.174195 & -1.8019 & 0.037189 \tabularnewline
11 & 0.308327 & 3.1894 & 0.000935 \tabularnewline
12 & 0.70713 & 7.3146 & 0 \tabularnewline
13 & 0.207577 & 2.1472 & 0.017018 \tabularnewline
14 & -0.113583 & -1.1749 & 0.121319 \tabularnewline
15 & -0.387129 & -4.0045 & 5.7e-05 \tabularnewline
16 & -0.325896 & -3.3711 & 0.000521 \tabularnewline
17 & 0.248918 & 2.5748 & 0.005698 \tabularnewline
18 & 0.093307 & 0.9652 & 0.168316 \tabularnewline
19 & 0.166328 & 1.7205 & 0.044116 \tabularnewline
20 & -0.345214 & -3.5709 & 0.000267 \tabularnewline
21 & -0.351857 & -3.6396 & 0.000211 \tabularnewline
22 & -0.133099 & -1.3768 & 0.085727 \tabularnewline
23 & 0.299221 & 3.0952 & 0.001255 \tabularnewline
24 & 0.588122 & 6.0836 & 0 \tabularnewline
25 & 0.177972 & 1.841 & 0.034199 \tabularnewline
26 & -0.044046 & -0.4556 & 0.324795 \tabularnewline
27 & -0.403897 & -4.1779 & 3e-05 \tabularnewline
28 & -0.198939 & -2.0578 & 0.021018 \tabularnewline
29 & 0.151807 & 1.5703 & 0.059648 \tabularnewline
30 & 0.123948 & 1.2821 & 0.101285 \tabularnewline
31 & 0.077293 & 0.7995 & 0.212878 \tabularnewline
32 & -0.254638 & -2.634 & 0.004845 \tabularnewline
33 & -0.363818 & -3.7634 & 0.000137 \tabularnewline
34 & -0.057128 & -0.5909 & 0.277904 \tabularnewline
35 & 0.236925 & 2.4508 & 0.007938 \tabularnewline
36 & 0.524445 & 5.4249 & 0 \tabularnewline
37 & 0.129852 & 1.3432 & 0.091025 \tabularnewline
38 & -0.055783 & -0.577 & 0.282569 \tabularnewline
39 & -0.322908 & -3.3402 & 0.000577 \tabularnewline
40 & -0.159573 & -1.6506 & 0.050873 \tabularnewline
41 & 0.152521 & 1.5777 & 0.058794 \tabularnewline
42 & 0.074606 & 0.7717 & 0.220989 \tabularnewline
43 & 0.101309 & 1.0479 & 0.148512 \tabularnewline
44 & -0.261667 & -2.7067 & 0.003956 \tabularnewline
45 & -0.267758 & -2.7697 & 0.003308 \tabularnewline
46 & -0.061859 & -0.6399 & 0.261811 \tabularnewline
47 & 0.21665 & 2.241 & 0.013544 \tabularnewline
48 & 0.358767 & 3.7111 & 0.000165 \tabularnewline
\hline
\end{tabular}
%Source: https://freestatistics.org/blog/index.php?pk=75160&T=1

[TABLE]
[ROW][C]Autocorrelation Function[/C][/ROW]
[ROW][C]Time lag k[/C][C]ACF(k)[/C][C]T-STAT[/C][C]P-value[/C][/ROW]
[ROW][C]1[/C][C]0.15604[/C][C]1.6141[/C][C]0.054727[/C][/ROW]
[ROW][C]2[/C][C]-0.11403[/C][C]-1.1795[/C][C]0.120401[/C][/ROW]
[ROW][C]3[/C][C]-0.435596[/C][C]-4.5058[/C][C]8e-06[/C][/ROW]
[ROW][C]4[/C][C]-0.330764[/C][C]-3.4214[/C][C]0.000442[/C][/ROW]
[ROW][C]5[/C][C]0.167939[/C][C]1.7372[/C][C]0.042617[/C][/ROW]
[ROW][C]6[/C][C]0.174337[/C][C]1.8034[/C][C]0.037073[/C][/ROW]
[ROW][C]7[/C][C]0.141913[/C][C]1.468[/C][C]0.072525[/C][/ROW]
[ROW][C]8[/C][C]-0.33629[/C][C]-3.4786[/C][C]0.000365[/C][/ROW]
[ROW][C]9[/C][C]-0.393299[/C][C]-4.0683[/C][C]4.5e-05[/C][/ROW]
[ROW][C]10[/C][C]-0.174195[/C][C]-1.8019[/C][C]0.037189[/C][/ROW]
[ROW][C]11[/C][C]0.308327[/C][C]3.1894[/C][C]0.000935[/C][/ROW]
[ROW][C]12[/C][C]0.70713[/C][C]7.3146[/C][C]0[/C][/ROW]
[ROW][C]13[/C][C]0.207577[/C][C]2.1472[/C][C]0.017018[/C][/ROW]
[ROW][C]14[/C][C]-0.113583[/C][C]-1.1749[/C][C]0.121319[/C][/ROW]
[ROW][C]15[/C][C]-0.387129[/C][C]-4.0045[/C][C]5.7e-05[/C][/ROW]
[ROW][C]16[/C][C]-0.325896[/C][C]-3.3711[/C][C]0.000521[/C][/ROW]
[ROW][C]17[/C][C]0.248918[/C][C]2.5748[/C][C]0.005698[/C][/ROW]
[ROW][C]18[/C][C]0.093307[/C][C]0.9652[/C][C]0.168316[/C][/ROW]
[ROW][C]19[/C][C]0.166328[/C][C]1.7205[/C][C]0.044116[/C][/ROW]
[ROW][C]20[/C][C]-0.345214[/C][C]-3.5709[/C][C]0.000267[/C][/ROW]
[ROW][C]21[/C][C]-0.351857[/C][C]-3.6396[/C][C]0.000211[/C][/ROW]
[ROW][C]22[/C][C]-0.133099[/C][C]-1.3768[/C][C]0.085727[/C][/ROW]
[ROW][C]23[/C][C]0.299221[/C][C]3.0952[/C][C]0.001255[/C][/ROW]
[ROW][C]24[/C][C]0.588122[/C][C]6.0836[/C][C]0[/C][/ROW]
[ROW][C]25[/C][C]0.177972[/C][C]1.841[/C][C]0.034199[/C][/ROW]
[ROW][C]26[/C][C]-0.044046[/C][C]-0.4556[/C][C]0.324795[/C][/ROW]
[ROW][C]27[/C][C]-0.403897[/C][C]-4.1779[/C][C]3e-05[/C][/ROW]
[ROW][C]28[/C][C]-0.198939[/C][C]-2.0578[/C][C]0.021018[/C][/ROW]
[ROW][C]29[/C][C]0.151807[/C][C]1.5703[/C][C]0.059648[/C][/ROW]
[ROW][C]30[/C][C]0.123948[/C][C]1.2821[/C][C]0.101285[/C][/ROW]
[ROW][C]31[/C][C]0.077293[/C][C]0.7995[/C][C]0.212878[/C][/ROW]
[ROW][C]32[/C][C]-0.254638[/C][C]-2.634[/C][C]0.004845[/C][/ROW]
[ROW][C]33[/C][C]-0.363818[/C][C]-3.7634[/C][C]0.000137[/C][/ROW]
[ROW][C]34[/C][C]-0.057128[/C][C]-0.5909[/C][C]0.277904[/C][/ROW]
[ROW][C]35[/C][C]0.236925[/C][C]2.4508[/C][C]0.007938[/C][/ROW]
[ROW][C]36[/C][C]0.524445[/C][C]5.4249[/C][C]0[/C][/ROW]
[ROW][C]37[/C][C]0.129852[/C][C]1.3432[/C][C]0.091025[/C][/ROW]
[ROW][C]38[/C][C]-0.055783[/C][C]-0.577[/C][C]0.282569[/C][/ROW]
[ROW][C]39[/C][C]-0.322908[/C][C]-3.3402[/C][C]0.000577[/C][/ROW]
[ROW][C]40[/C][C]-0.159573[/C][C]-1.6506[/C][C]0.050873[/C][/ROW]
[ROW][C]41[/C][C]0.152521[/C][C]1.5777[/C][C]0.058794[/C][/ROW]
[ROW][C]42[/C][C]0.074606[/C][C]0.7717[/C][C]0.220989[/C][/ROW]
[ROW][C]43[/C][C]0.101309[/C][C]1.0479[/C][C]0.148512[/C][/ROW]
[ROW][C]44[/C][C]-0.261667[/C][C]-2.7067[/C][C]0.003956[/C][/ROW]
[ROW][C]45[/C][C]-0.267758[/C][C]-2.7697[/C][C]0.003308[/C][/ROW]
[ROW][C]46[/C][C]-0.061859[/C][C]-0.6399[/C][C]0.261811[/C][/ROW]
[ROW][C]47[/C][C]0.21665[/C][C]2.241[/C][C]0.013544[/C][/ROW]
[ROW][C]48[/C][C]0.358767[/C][C]3.7111[/C][C]0.000165[/C][/ROW]
[/TABLE]
Source: https://freestatistics.org/blog/index.php?pk=75160&T=1

Globally Unique Identifier (entire table): ba.freestatistics.org/blog/index.php?pk=75160&T=1

As an alternative you can also use a QR Code:  

The GUIDs for individual cells are displayed in the table below:

Autocorrelation Function
Time lag kACF(k)T-STATP-value
10.156041.61410.054727
2-0.11403-1.17950.120401
3-0.435596-4.50588e-06
4-0.330764-3.42140.000442
50.1679391.73720.042617
60.1743371.80340.037073
70.1419131.4680.072525
8-0.33629-3.47860.000365
9-0.393299-4.06834.5e-05
10-0.174195-1.80190.037189
110.3083273.18940.000935
120.707137.31460
130.2075772.14720.017018
14-0.113583-1.17490.121319
15-0.387129-4.00455.7e-05
16-0.325896-3.37110.000521
170.2489182.57480.005698
180.0933070.96520.168316
190.1663281.72050.044116
20-0.345214-3.57090.000267
21-0.351857-3.63960.000211
22-0.133099-1.37680.085727
230.2992213.09520.001255
240.5881226.08360
250.1779721.8410.034199
26-0.044046-0.45560.324795
27-0.403897-4.17793e-05
28-0.198939-2.05780.021018
290.1518071.57030.059648
300.1239481.28210.101285
310.0772930.79950.212878
32-0.254638-2.6340.004845
33-0.363818-3.76340.000137
34-0.057128-0.59090.277904
350.2369252.45080.007938
360.5244455.42490
370.1298521.34320.091025
38-0.055783-0.5770.282569
39-0.322908-3.34020.000577
40-0.159573-1.65060.050873
410.1525211.57770.058794
420.0746060.77170.220989
430.1013091.04790.148512
44-0.261667-2.70670.003956
45-0.267758-2.76970.003308
46-0.061859-0.63990.261811
470.216652.2410.013544
480.3587673.71110.000165


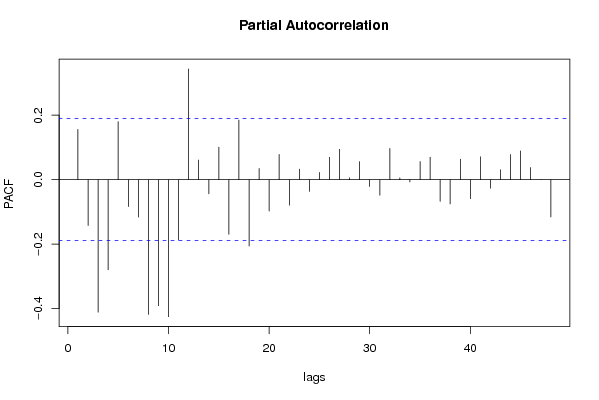
Partial Autocorrelation Function
Time lag kPACF(k)T-STATP-value
10.156041.61410.054727
2-0.141832-1.46710.072638
3-0.411231-4.25382.3e-05
4-0.279737-2.89360.002308
50.1801311.86330.032582
6-0.083562-0.86440.19466
7-0.116044-1.20040.116324
8-0.418363-4.32761.7e-05
9-0.391029-4.04485e-05
10-0.425051-4.39681.3e-05
11-0.187513-1.93960.027528
120.343623.55440.000283
130.0607340.62820.265593
14-0.043736-0.45240.325946
150.1007011.04170.149958
16-0.169624-1.75460.041095
170.1850481.91410.029136
18-0.205855-2.12940.017758
190.0346290.35820.360447
20-0.097326-1.00670.158164
210.0782850.80980.209929
22-0.079172-0.8190.207314
230.0327740.3390.367632
24-0.036488-0.37740.353298
250.0226110.23390.40776
260.0692910.71670.237545
270.0943940.97640.165531
280.0056810.05880.476626
290.0563830.58320.280481
30-0.021186-0.21920.413475
31-0.048028-0.49680.310172
320.0969511.00290.159094
330.0056280.05820.476842
34-0.006953-0.07190.471397
350.0560670.580.28158
360.0699710.72380.235388
37-0.067288-0.6960.24396
38-0.075437-0.78030.218461
390.063690.65880.255716
40-0.058831-0.60860.272055
410.0711490.7360.231679
42-0.026257-0.27160.393224
430.0305050.31550.376481
440.0780960.80780.210491
450.089380.92460.17864
460.0377410.39040.34851
47-8.6e-05-9e-040.499644
48-0.115518-1.19490.117378

\begin{tabular}{lllllllll}
\hline
Partial Autocorrelation Function \tabularnewline
Time lag k & PACF(k) & T-STAT & P-value \tabularnewline
1 & 0.15604 & 1.6141 & 0.054727 \tabularnewline
2 & -0.141832 & -1.4671 & 0.072638 \tabularnewline
3 & -0.411231 & -4.2538 & 2.3e-05 \tabularnewline
4 & -0.279737 & -2.8936 & 0.002308 \tabularnewline
5 & 0.180131 & 1.8633 & 0.032582 \tabularnewline
6 & -0.083562 & -0.8644 & 0.19466 \tabularnewline
7 & -0.116044 & -1.2004 & 0.116324 \tabularnewline
8 & -0.418363 & -4.3276 & 1.7e-05 \tabularnewline
9 & -0.391029 & -4.0448 & 5e-05 \tabularnewline
10 & -0.425051 & -4.3968 & 1.3e-05 \tabularnewline
11 & -0.187513 & -1.9396 & 0.027528 \tabularnewline
12 & 0.34362 & 3.5544 & 0.000283 \tabularnewline
13 & 0.060734 & 0.6282 & 0.265593 \tabularnewline
14 & -0.043736 & -0.4524 & 0.325946 \tabularnewline
15 & 0.100701 & 1.0417 & 0.149958 \tabularnewline
16 & -0.169624 & -1.7546 & 0.041095 \tabularnewline
17 & 0.185048 & 1.9141 & 0.029136 \tabularnewline
18 & -0.205855 & -2.1294 & 0.017758 \tabularnewline
19 & 0.034629 & 0.3582 & 0.360447 \tabularnewline
20 & -0.097326 & -1.0067 & 0.158164 \tabularnewline
21 & 0.078285 & 0.8098 & 0.209929 \tabularnewline
22 & -0.079172 & -0.819 & 0.207314 \tabularnewline
23 & 0.032774 & 0.339 & 0.367632 \tabularnewline
24 & -0.036488 & -0.3774 & 0.353298 \tabularnewline
25 & 0.022611 & 0.2339 & 0.40776 \tabularnewline
26 & 0.069291 & 0.7167 & 0.237545 \tabularnewline
27 & 0.094394 & 0.9764 & 0.165531 \tabularnewline
28 & 0.005681 & 0.0588 & 0.476626 \tabularnewline
29 & 0.056383 & 0.5832 & 0.280481 \tabularnewline
30 & -0.021186 & -0.2192 & 0.413475 \tabularnewline
31 & -0.048028 & -0.4968 & 0.310172 \tabularnewline
32 & 0.096951 & 1.0029 & 0.159094 \tabularnewline
33 & 0.005628 & 0.0582 & 0.476842 \tabularnewline
34 & -0.006953 & -0.0719 & 0.471397 \tabularnewline
35 & 0.056067 & 0.58 & 0.28158 \tabularnewline
36 & 0.069971 & 0.7238 & 0.235388 \tabularnewline
37 & -0.067288 & -0.696 & 0.24396 \tabularnewline
38 & -0.075437 & -0.7803 & 0.218461 \tabularnewline
39 & 0.06369 & 0.6588 & 0.255716 \tabularnewline
40 & -0.058831 & -0.6086 & 0.272055 \tabularnewline
41 & 0.071149 & 0.736 & 0.231679 \tabularnewline
42 & -0.026257 & -0.2716 & 0.393224 \tabularnewline
43 & 0.030505 & 0.3155 & 0.376481 \tabularnewline
44 & 0.078096 & 0.8078 & 0.210491 \tabularnewline
45 & 0.08938 & 0.9246 & 0.17864 \tabularnewline
46 & 0.037741 & 0.3904 & 0.34851 \tabularnewline
47 & -8.6e-05 & -9e-04 & 0.499644 \tabularnewline
48 & -0.115518 & -1.1949 & 0.117378 \tabularnewline
\hline
\end{tabular}
%Source: https://freestatistics.org/blog/index.php?pk=75160&T=2

[TABLE]
[ROW][C]Partial Autocorrelation Function[/C][/ROW]
[ROW][C]Time lag k[/C][C]PACF(k)[/C][C]T-STAT[/C][C]P-value[/C][/ROW]
[ROW][C]1[/C][C]0.15604[/C][C]1.6141[/C][C]0.054727[/C][/ROW]
[ROW][C]2[/C][C]-0.141832[/C][C]-1.4671[/C][C]0.072638[/C][/ROW]
[ROW][C]3[/C][C]-0.411231[/C][C]-4.2538[/C][C]2.3e-05[/C][/ROW]
[ROW][C]4[/C][C]-0.279737[/C][C]-2.8936[/C][C]0.002308[/C][/ROW]
[ROW][C]5[/C][C]0.180131[/C][C]1.8633[/C][C]0.032582[/C][/ROW]
[ROW][C]6[/C][C]-0.083562[/C][C]-0.8644[/C][C]0.19466[/C][/ROW]
[ROW][C]7[/C][C]-0.116044[/C][C]-1.2004[/C][C]0.116324[/C][/ROW]
[ROW][C]8[/C][C]-0.418363[/C][C]-4.3276[/C][C]1.7e-05[/C][/ROW]
[ROW][C]9[/C][C]-0.391029[/C][C]-4.0448[/C][C]5e-05[/C][/ROW]
[ROW][C]10[/C][C]-0.425051[/C][C]-4.3968[/C][C]1.3e-05[/C][/ROW]
[ROW][C]11[/C][C]-0.187513[/C][C]-1.9396[/C][C]0.027528[/C][/ROW]
[ROW][C]12[/C][C]0.34362[/C][C]3.5544[/C][C]0.000283[/C][/ROW]
[ROW][C]13[/C][C]0.060734[/C][C]0.6282[/C][C]0.265593[/C][/ROW]
[ROW][C]14[/C][C]-0.043736[/C][C]-0.4524[/C][C]0.325946[/C][/ROW]
[ROW][C]15[/C][C]0.100701[/C][C]1.0417[/C][C]0.149958[/C][/ROW]
[ROW][C]16[/C][C]-0.169624[/C][C]-1.7546[/C][C]0.041095[/C][/ROW]
[ROW][C]17[/C][C]0.185048[/C][C]1.9141[/C][C]0.029136[/C][/ROW]
[ROW][C]18[/C][C]-0.205855[/C][C]-2.1294[/C][C]0.017758[/C][/ROW]
[ROW][C]19[/C][C]0.034629[/C][C]0.3582[/C][C]0.360447[/C][/ROW]
[ROW][C]20[/C][C]-0.097326[/C][C]-1.0067[/C][C]0.158164[/C][/ROW]
[ROW][C]21[/C][C]0.078285[/C][C]0.8098[/C][C]0.209929[/C][/ROW]
[ROW][C]22[/C][C]-0.079172[/C][C]-0.819[/C][C]0.207314[/C][/ROW]
[ROW][C]23[/C][C]0.032774[/C][C]0.339[/C][C]0.367632[/C][/ROW]
[ROW][C]24[/C][C]-0.036488[/C][C]-0.3774[/C][C]0.353298[/C][/ROW]
[ROW][C]25[/C][C]0.022611[/C][C]0.2339[/C][C]0.40776[/C][/ROW]
[ROW][C]26[/C][C]0.069291[/C][C]0.7167[/C][C]0.237545[/C][/ROW]
[ROW][C]27[/C][C]0.094394[/C][C]0.9764[/C][C]0.165531[/C][/ROW]
[ROW][C]28[/C][C]0.005681[/C][C]0.0588[/C][C]0.476626[/C][/ROW]
[ROW][C]29[/C][C]0.056383[/C][C]0.5832[/C][C]0.280481[/C][/ROW]
[ROW][C]30[/C][C]-0.021186[/C][C]-0.2192[/C][C]0.413475[/C][/ROW]
[ROW][C]31[/C][C]-0.048028[/C][C]-0.4968[/C][C]0.310172[/C][/ROW]
[ROW][C]32[/C][C]0.096951[/C][C]1.0029[/C][C]0.159094[/C][/ROW]
[ROW][C]33[/C][C]0.005628[/C][C]0.0582[/C][C]0.476842[/C][/ROW]
[ROW][C]34[/C][C]-0.006953[/C][C]-0.0719[/C][C]0.471397[/C][/ROW]
[ROW][C]35[/C][C]0.056067[/C][C]0.58[/C][C]0.28158[/C][/ROW]
[ROW][C]36[/C][C]0.069971[/C][C]0.7238[/C][C]0.235388[/C][/ROW]
[ROW][C]37[/C][C]-0.067288[/C][C]-0.696[/C][C]0.24396[/C][/ROW]
[ROW][C]38[/C][C]-0.075437[/C][C]-0.7803[/C][C]0.218461[/C][/ROW]
[ROW][C]39[/C][C]0.06369[/C][C]0.6588[/C][C]0.255716[/C][/ROW]
[ROW][C]40[/C][C]-0.058831[/C][C]-0.6086[/C][C]0.272055[/C][/ROW]
[ROW][C]41[/C][C]0.071149[/C][C]0.736[/C][C]0.231679[/C][/ROW]
[ROW][C]42[/C][C]-0.026257[/C][C]-0.2716[/C][C]0.393224[/C][/ROW]
[ROW][C]43[/C][C]0.030505[/C][C]0.3155[/C][C]0.376481[/C][/ROW]
[ROW][C]44[/C][C]0.078096[/C][C]0.8078[/C][C]0.210491[/C][/ROW]
[ROW][C]45[/C][C]0.08938[/C][C]0.9246[/C][C]0.17864[/C][/ROW]
[ROW][C]46[/C][C]0.037741[/C][C]0.3904[/C][C]0.34851[/C][/ROW]
[ROW][C]47[/C][C]-8.6e-05[/C][C]-9e-04[/C][C]0.499644[/C][/ROW]
[ROW][C]48[/C][C]-0.115518[/C][C]-1.1949[/C][C]0.117378[/C][/ROW]
[/TABLE]
Source: https://freestatistics.org/blog/index.php?pk=75160&T=2

Globally Unique Identifier (entire table): ba.freestatistics.org/blog/index.php?pk=75160&T=2

As an alternative you can also use a QR Code:  

The GUIDs for individual cells are displayed in the table below:

Partial Autocorrelation Function
Time lag kPACF(k)T-STATP-value
10.156041.61410.054727
2-0.141832-1.46710.072638
3-0.411231-4.25382.3e-05
4-0.279737-2.89360.002308
50.1801311.86330.032582
6-0.083562-0.86440.19466
7-0.116044-1.20040.116324
8-0.418363-4.32761.7e-05
9-0.391029-4.04485e-05
10-0.425051-4.39681.3e-05
11-0.187513-1.93960.027528
120.343623.55440.000283
130.0607340.62820.265593
14-0.043736-0.45240.325946
150.1007011.04170.149958
16-0.169624-1.75460.041095
170.1850481.91410.029136
18-0.205855-2.12940.017758
190.0346290.35820.360447
20-0.097326-1.00670.158164
210.0782850.80980.209929
22-0.079172-0.8190.207314
230.0327740.3390.367632
24-0.036488-0.37740.353298
250.0226110.23390.40776
260.0692910.71670.237545
270.0943940.97640.165531
280.0056810.05880.476626
290.0563830.58320.280481
30-0.021186-0.21920.413475
31-0.048028-0.49680.310172
320.0969511.00290.159094
330.0056280.05820.476842
34-0.006953-0.07190.471397
350.0560670.580.28158
360.0699710.72380.235388
37-0.067288-0.6960.24396
38-0.075437-0.78030.218461
390.063690.65880.255716
40-0.058831-0.60860.272055
410.0711490.7360.231679
42-0.026257-0.27160.393224
430.0305050.31550.376481
440.0780960.80780.210491
450.089380.92460.17864
460.0377410.39040.34851
47-8.6e-05-9e-040.499644
48-0.115518-1.19490.117378


Parameters (Session):
par1 = 48 ; par2 = 1 ; par3 = 1 ; par4 = 0 ; par5 = 12 ; par6 = White Noise ; par7 = 0.95 ;
Parameters (R input):
par1 = 48 ; par2 = 1 ; par3 = 1 ; par4 = 0 ; par5 = 12 ; par6 = White Noise ; par7 = 0.95 ;
R code (references can be found in the software module):
if (par1 == 'Default') {
par1 = 10*log10(length(x))
} else {
par1 <- as.numeric(par1)
}
par2 <- as.numeric(par2)
par3 <- as.numeric(par3)
par4 <- as.numeric(par4)
par5 <- as.numeric(par5)
if (par6 == 'White Noise') par6 <- 'white' else par6 <- 'ma'
par7 <- as.numeric(par7)
if (par2 == 0) {
x <- log(x)
} else {
x <- (x ^ par2 - 1) / par2
}
if (par3 > 0) x <- diff(x,lag=1,difference=par3)
if (par4 > 0) x <- diff(x,lag=par5,difference=par4)
bitmap(file='pic1.png')
racf <- acf(x, par1, main='Autocorrelation', xlab='time lag', ylab='ACF', ci.type=par6, ci=par7, sub=paste('(lambda=',par2,', d=',par3,', D=',par4,', CI=', par7, ', CI type=',par6,')',sep=''))
dev.off()
bitmap(file='pic2.png')
rpacf <- pacf(x,par1,main='Partial Autocorrelation',xlab='lags',ylab='PACF')
dev.off()
(myacf <- c(racf$acf))
(mypacf <- c(rpacf$acf))
lengthx <- length(x)
sqrtn <- sqrt(lengthx)
load(file='createtable')
a<-table.start()
a<-table.row.start(a)
a<-table.element(a,'Autocorrelation Function',4,TRUE)
a<-table.row.end(a)
a<-table.row.start(a)
a<-table.element(a,'Time lag k',header=TRUE)
a<-table.element(a,hyperlink('basics.htm','ACF(k)','click here for more information about the Autocorrelation Function'),header=TRUE)
a<-table.element(a,'T-STAT',header=TRUE)
a<-table.element(a,'P-value',header=TRUE)
a<-table.row.end(a)
for (i in 2:(par1+1)) {
a<-table.row.start(a)
a<-table.element(a,i-1,header=TRUE)
a<-table.element(a,round(myacf[i],6))
mytstat <- myacf[i]*sqrtn
a<-table.element(a,round(mytstat,4))
a<-table.element(a,round(1-pt(abs(mytstat),lengthx),6))
a<-table.row.end(a)
}
a<-table.end(a)
table.save(a,file='mytable.tab')
a<-table.start()
a<-table.row.start(a)
a<-table.element(a,'Partial Autocorrelation Function',4,TRUE)
a<-table.row.end(a)
a<-table.row.start(a)
a<-table.element(a,'Time lag k',header=TRUE)
a<-table.element(a,hyperlink('basics.htm','PACF(k)','click here for more information about the Partial Autocorrelation Function'),header=TRUE)
a<-table.element(a,'T-STAT',header=TRUE)
a<-table.element(a,'P-value',header=TRUE)
a<-table.row.end(a)
for (i in 1:par1) {
a<-table.row.start(a)
a<-table.element(a,i,header=TRUE)
a<-table.element(a,round(mypacf[i],6))
mytstat <- mypacf[i]*sqrtn
a<-table.element(a,round(mytstat,4))
a<-table.element(a,round(1-pt(abs(mytstat),lengthx),6))
a<-table.row.end(a)
}
a<-table.end(a)
table.save(a,file='mytable1.tab')