Free Statistics

of Irreproducible Research!

Author's title

Author*Unverified author*
R Software Modulerwasp_autocorrelation.wasp
Title produced by software(Partial) Autocorrelation Function
Date of computationSat, 01 May 2010 12:19:02 +0000
Cite this page as followsStatistical Computations at FreeStatistics.org, Office for Research Development and Education, URL https://freestatistics.org/blog/index.php?v=date/2010/May/01/t1272716368kixl4frg6amq73y.htm/, Retrieved Sun, 28 Apr 2024 15:45:00 +0000
Statistical Computations at FreeStatistics.org, Office for Research Development and Education, URL https://freestatistics.org/blog/index.php?pk=75125, Retrieved Sun, 28 Apr 2024 15:45:00 +0000
QR Codes:

Original text written by user:
IsPrivate?No (this computation is public)
User-defined keywordsKDGP2W21
Estimated Impact141
Family? (F = Feedback message, R = changed R code, M = changed R Module, P = changed Parameters, D = changed Data)
-       [(Partial) Autocorrelation Function] [] [2010-05-01 12:19:02] [d41d8cd98f00b204e9800998ecf8427e] [Current]
Feedback Forum

Post a new message
Dataseries X:
7089
77102
35123
23109
11115
48105
7896
79102
2494
76101
9484
8183
9092
49109
27127
31116
77120
80115
67117
18110
3099
3105
5786
7387
5089
288
65108
44100
68102
8798
8183
288
3680
9374
2271
4671
3466
8068
2780
9883
6479
3373
6468
460
5553
6157
2345
3744
6144
9948
2049
9549
6049
745
9643
9938
5535
6932
1827
9726
7624
9529
7631
6132
7534
2137
8738
8836
3230
633
9126
123


Summary of computational transaction
Raw Inputview raw input (R code)
Raw Outputview raw output of R engine
Computing time2 seconds
R Server'Sir Ronald Aylmer Fisher' @ 193.190.124.24

\begin{tabular}{lllllllll}
\hline
Summary of computational transaction \tabularnewline
Raw Input & view raw input (R code)  \tabularnewline
Raw Output & view raw output of R engine  \tabularnewline
Computing time & 2 seconds \tabularnewline
R Server & 'Sir Ronald Aylmer Fisher' @ 193.190.124.24 \tabularnewline
\hline
\end{tabular}
%Source: https://freestatistics.org/blog/index.php?pk=75125&T=0

[TABLE]
[ROW][C]Summary of computational transaction[/C][/ROW]
[ROW][C]Raw Input[/C][C]view raw input (R code) [/C][/ROW]
[ROW][C]Raw Output[/C][C]view raw output of R engine [/C][/ROW]
[ROW][C]Computing time[/C][C]2 seconds[/C][/ROW]
[ROW][C]R Server[/C][C]'Sir Ronald Aylmer Fisher' @ 193.190.124.24[/C][/ROW]
[/TABLE]
Source: https://freestatistics.org/blog/index.php?pk=75125&T=0

Globally Unique Identifier (entire table): ba.freestatistics.org/blog/index.php?pk=75125&T=0

As an alternative you can also use a QR Code:  

The GUIDs for individual cells are displayed in the table below:

Summary of computational transaction
Raw Inputview raw input (R code)
Raw Outputview raw output of R engine
Computing time2 seconds
R Server'Sir Ronald Aylmer Fisher' @ 193.190.124.24


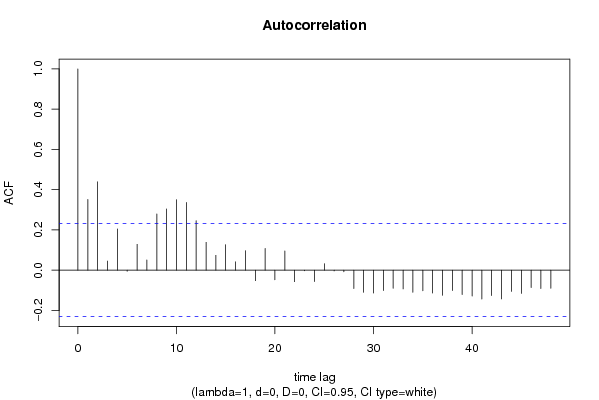
Autocorrelation Function
Time lag kACF(k)T-STATP-value
10.3516252.98360.001944
20.4388073.72340.000194
30.0451810.38340.351285
40.2046711.73670.04336
5-0.005291-0.04490.482158
60.1282731.08840.140017
70.0505030.42850.334772
80.2796242.37270.010166
90.304392.58280.005916
100.3497612.96780.002035
110.3363142.85370.002819
120.2454232.08250.020426
130.1382021.17270.122395
140.0735720.62430.267208
150.1266151.07440.143124
160.0413640.3510.363311
170.0969720.82280.206659
18-0.05201-0.44130.330152
190.1082360.91840.180736
20-0.047394-0.40220.344382
210.0953560.80910.210556
22-0.056964-0.48340.315155
23-0.003174-0.02690.489294
24-0.056779-0.48180.315709
250.0318920.27060.393731
26-0.003788-0.03210.487225
27-0.008146-0.06910.472542
28-0.091359-0.77520.220379
29-0.10948-0.9290.178005
30-0.11372-0.96490.168901
31-0.101457-0.86090.196078
32-0.089989-0.76360.223806
33-0.093089-0.78990.216093
34-0.109885-0.93240.177122
35-0.102048-0.86590.194708
36-0.113674-0.96460.168997
37-0.124863-1.05950.146457
38-0.101027-0.85720.197077
39-0.120812-1.02510.154369
40-0.128527-1.09060.139546
41-0.143504-1.21770.113662
42-0.125907-1.06840.144465
43-0.14268-1.21070.114988
44-0.105509-0.89530.186812
45-0.115546-0.98040.165076
46-0.08648-0.73380.232725
47-0.091082-0.77290.221068
48-0.089915-0.7630.223991

\begin{tabular}{lllllllll}
\hline
Autocorrelation Function \tabularnewline
Time lag k & ACF(k) & T-STAT & P-value \tabularnewline
1 & 0.351625 & 2.9836 & 0.001944 \tabularnewline
2 & 0.438807 & 3.7234 & 0.000194 \tabularnewline
3 & 0.045181 & 0.3834 & 0.351285 \tabularnewline
4 & 0.204671 & 1.7367 & 0.04336 \tabularnewline
5 & -0.005291 & -0.0449 & 0.482158 \tabularnewline
6 & 0.128273 & 1.0884 & 0.140017 \tabularnewline
7 & 0.050503 & 0.4285 & 0.334772 \tabularnewline
8 & 0.279624 & 2.3727 & 0.010166 \tabularnewline
9 & 0.30439 & 2.5828 & 0.005916 \tabularnewline
10 & 0.349761 & 2.9678 & 0.002035 \tabularnewline
11 & 0.336314 & 2.8537 & 0.002819 \tabularnewline
12 & 0.245423 & 2.0825 & 0.020426 \tabularnewline
13 & 0.138202 & 1.1727 & 0.122395 \tabularnewline
14 & 0.073572 & 0.6243 & 0.267208 \tabularnewline
15 & 0.126615 & 1.0744 & 0.143124 \tabularnewline
16 & 0.041364 & 0.351 & 0.363311 \tabularnewline
17 & 0.096972 & 0.8228 & 0.206659 \tabularnewline
18 & -0.05201 & -0.4413 & 0.330152 \tabularnewline
19 & 0.108236 & 0.9184 & 0.180736 \tabularnewline
20 & -0.047394 & -0.4022 & 0.344382 \tabularnewline
21 & 0.095356 & 0.8091 & 0.210556 \tabularnewline
22 & -0.056964 & -0.4834 & 0.315155 \tabularnewline
23 & -0.003174 & -0.0269 & 0.489294 \tabularnewline
24 & -0.056779 & -0.4818 & 0.315709 \tabularnewline
25 & 0.031892 & 0.2706 & 0.393731 \tabularnewline
26 & -0.003788 & -0.0321 & 0.487225 \tabularnewline
27 & -0.008146 & -0.0691 & 0.472542 \tabularnewline
28 & -0.091359 & -0.7752 & 0.220379 \tabularnewline
29 & -0.10948 & -0.929 & 0.178005 \tabularnewline
30 & -0.11372 & -0.9649 & 0.168901 \tabularnewline
31 & -0.101457 & -0.8609 & 0.196078 \tabularnewline
32 & -0.089989 & -0.7636 & 0.223806 \tabularnewline
33 & -0.093089 & -0.7899 & 0.216093 \tabularnewline
34 & -0.109885 & -0.9324 & 0.177122 \tabularnewline
35 & -0.102048 & -0.8659 & 0.194708 \tabularnewline
36 & -0.113674 & -0.9646 & 0.168997 \tabularnewline
37 & -0.124863 & -1.0595 & 0.146457 \tabularnewline
38 & -0.101027 & -0.8572 & 0.197077 \tabularnewline
39 & -0.120812 & -1.0251 & 0.154369 \tabularnewline
40 & -0.128527 & -1.0906 & 0.139546 \tabularnewline
41 & -0.143504 & -1.2177 & 0.113662 \tabularnewline
42 & -0.125907 & -1.0684 & 0.144465 \tabularnewline
43 & -0.14268 & -1.2107 & 0.114988 \tabularnewline
44 & -0.105509 & -0.8953 & 0.186812 \tabularnewline
45 & -0.115546 & -0.9804 & 0.165076 \tabularnewline
46 & -0.08648 & -0.7338 & 0.232725 \tabularnewline
47 & -0.091082 & -0.7729 & 0.221068 \tabularnewline
48 & -0.089915 & -0.763 & 0.223991 \tabularnewline
\hline
\end{tabular}
%Source: https://freestatistics.org/blog/index.php?pk=75125&T=1

[TABLE]
[ROW][C]Autocorrelation Function[/C][/ROW]
[ROW][C]Time lag k[/C][C]ACF(k)[/C][C]T-STAT[/C][C]P-value[/C][/ROW]
[ROW][C]1[/C][C]0.351625[/C][C]2.9836[/C][C]0.001944[/C][/ROW]
[ROW][C]2[/C][C]0.438807[/C][C]3.7234[/C][C]0.000194[/C][/ROW]
[ROW][C]3[/C][C]0.045181[/C][C]0.3834[/C][C]0.351285[/C][/ROW]
[ROW][C]4[/C][C]0.204671[/C][C]1.7367[/C][C]0.04336[/C][/ROW]
[ROW][C]5[/C][C]-0.005291[/C][C]-0.0449[/C][C]0.482158[/C][/ROW]
[ROW][C]6[/C][C]0.128273[/C][C]1.0884[/C][C]0.140017[/C][/ROW]
[ROW][C]7[/C][C]0.050503[/C][C]0.4285[/C][C]0.334772[/C][/ROW]
[ROW][C]8[/C][C]0.279624[/C][C]2.3727[/C][C]0.010166[/C][/ROW]
[ROW][C]9[/C][C]0.30439[/C][C]2.5828[/C][C]0.005916[/C][/ROW]
[ROW][C]10[/C][C]0.349761[/C][C]2.9678[/C][C]0.002035[/C][/ROW]
[ROW][C]11[/C][C]0.336314[/C][C]2.8537[/C][C]0.002819[/C][/ROW]
[ROW][C]12[/C][C]0.245423[/C][C]2.0825[/C][C]0.020426[/C][/ROW]
[ROW][C]13[/C][C]0.138202[/C][C]1.1727[/C][C]0.122395[/C][/ROW]
[ROW][C]14[/C][C]0.073572[/C][C]0.6243[/C][C]0.267208[/C][/ROW]
[ROW][C]15[/C][C]0.126615[/C][C]1.0744[/C][C]0.143124[/C][/ROW]
[ROW][C]16[/C][C]0.041364[/C][C]0.351[/C][C]0.363311[/C][/ROW]
[ROW][C]17[/C][C]0.096972[/C][C]0.8228[/C][C]0.206659[/C][/ROW]
[ROW][C]18[/C][C]-0.05201[/C][C]-0.4413[/C][C]0.330152[/C][/ROW]
[ROW][C]19[/C][C]0.108236[/C][C]0.9184[/C][C]0.180736[/C][/ROW]
[ROW][C]20[/C][C]-0.047394[/C][C]-0.4022[/C][C]0.344382[/C][/ROW]
[ROW][C]21[/C][C]0.095356[/C][C]0.8091[/C][C]0.210556[/C][/ROW]
[ROW][C]22[/C][C]-0.056964[/C][C]-0.4834[/C][C]0.315155[/C][/ROW]
[ROW][C]23[/C][C]-0.003174[/C][C]-0.0269[/C][C]0.489294[/C][/ROW]
[ROW][C]24[/C][C]-0.056779[/C][C]-0.4818[/C][C]0.315709[/C][/ROW]
[ROW][C]25[/C][C]0.031892[/C][C]0.2706[/C][C]0.393731[/C][/ROW]
[ROW][C]26[/C][C]-0.003788[/C][C]-0.0321[/C][C]0.487225[/C][/ROW]
[ROW][C]27[/C][C]-0.008146[/C][C]-0.0691[/C][C]0.472542[/C][/ROW]
[ROW][C]28[/C][C]-0.091359[/C][C]-0.7752[/C][C]0.220379[/C][/ROW]
[ROW][C]29[/C][C]-0.10948[/C][C]-0.929[/C][C]0.178005[/C][/ROW]
[ROW][C]30[/C][C]-0.11372[/C][C]-0.9649[/C][C]0.168901[/C][/ROW]
[ROW][C]31[/C][C]-0.101457[/C][C]-0.8609[/C][C]0.196078[/C][/ROW]
[ROW][C]32[/C][C]-0.089989[/C][C]-0.7636[/C][C]0.223806[/C][/ROW]
[ROW][C]33[/C][C]-0.093089[/C][C]-0.7899[/C][C]0.216093[/C][/ROW]
[ROW][C]34[/C][C]-0.109885[/C][C]-0.9324[/C][C]0.177122[/C][/ROW]
[ROW][C]35[/C][C]-0.102048[/C][C]-0.8659[/C][C]0.194708[/C][/ROW]
[ROW][C]36[/C][C]-0.113674[/C][C]-0.9646[/C][C]0.168997[/C][/ROW]
[ROW][C]37[/C][C]-0.124863[/C][C]-1.0595[/C][C]0.146457[/C][/ROW]
[ROW][C]38[/C][C]-0.101027[/C][C]-0.8572[/C][C]0.197077[/C][/ROW]
[ROW][C]39[/C][C]-0.120812[/C][C]-1.0251[/C][C]0.154369[/C][/ROW]
[ROW][C]40[/C][C]-0.128527[/C][C]-1.0906[/C][C]0.139546[/C][/ROW]
[ROW][C]41[/C][C]-0.143504[/C][C]-1.2177[/C][C]0.113662[/C][/ROW]
[ROW][C]42[/C][C]-0.125907[/C][C]-1.0684[/C][C]0.144465[/C][/ROW]
[ROW][C]43[/C][C]-0.14268[/C][C]-1.2107[/C][C]0.114988[/C][/ROW]
[ROW][C]44[/C][C]-0.105509[/C][C]-0.8953[/C][C]0.186812[/C][/ROW]
[ROW][C]45[/C][C]-0.115546[/C][C]-0.9804[/C][C]0.165076[/C][/ROW]
[ROW][C]46[/C][C]-0.08648[/C][C]-0.7338[/C][C]0.232725[/C][/ROW]
[ROW][C]47[/C][C]-0.091082[/C][C]-0.7729[/C][C]0.221068[/C][/ROW]
[ROW][C]48[/C][C]-0.089915[/C][C]-0.763[/C][C]0.223991[/C][/ROW]
[/TABLE]
Source: https://freestatistics.org/blog/index.php?pk=75125&T=1

Globally Unique Identifier (entire table): ba.freestatistics.org/blog/index.php?pk=75125&T=1

As an alternative you can also use a QR Code:  

The GUIDs for individual cells are displayed in the table below:

Autocorrelation Function
Time lag kACF(k)T-STATP-value
10.3516252.98360.001944
20.4388073.72340.000194
30.0451810.38340.351285
40.2046711.73670.04336
5-0.005291-0.04490.482158
60.1282731.08840.140017
70.0505030.42850.334772
80.2796242.37270.010166
90.304392.58280.005916
100.3497612.96780.002035
110.3363142.85370.002819
120.2454232.08250.020426
130.1382021.17270.122395
140.0735720.62430.267208
150.1266151.07440.143124
160.0413640.3510.363311
170.0969720.82280.206659
18-0.05201-0.44130.330152
190.1082360.91840.180736
20-0.047394-0.40220.344382
210.0953560.80910.210556
22-0.056964-0.48340.315155
23-0.003174-0.02690.489294
24-0.056779-0.48180.315709
250.0318920.27060.393731
26-0.003788-0.03210.487225
27-0.008146-0.06910.472542
28-0.091359-0.77520.220379
29-0.10948-0.9290.178005
30-0.11372-0.96490.168901
31-0.101457-0.86090.196078
32-0.089989-0.76360.223806
33-0.093089-0.78990.216093
34-0.109885-0.93240.177122
35-0.102048-0.86590.194708
36-0.113674-0.96460.168997
37-0.124863-1.05950.146457
38-0.101027-0.85720.197077
39-0.120812-1.02510.154369
40-0.128527-1.09060.139546
41-0.143504-1.21770.113662
42-0.125907-1.06840.144465
43-0.14268-1.21070.114988
44-0.105509-0.89530.186812
45-0.115546-0.98040.165076
46-0.08648-0.73380.232725
47-0.091082-0.77290.221068
48-0.089915-0.7630.223991


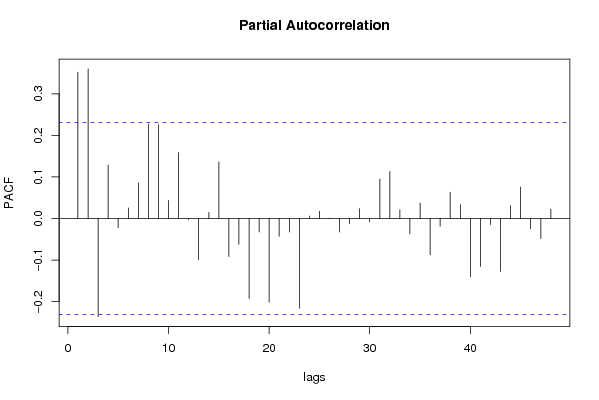
Partial Autocorrelation Function
Time lag kPACF(k)T-STATP-value
10.3516252.98360.001944
20.3596323.05160.001593
3-0.236011-2.00260.024492
40.128411.08960.139763
5-0.021625-0.18350.427462
60.0251480.21340.415812
70.0854050.72470.235496
80.2272081.92790.028905
90.225631.91450.029763
100.0434970.36910.356574
110.1585461.34530.091374
12-0.002536-0.02150.491445
13-0.099102-0.84090.201591
140.0145540.12350.45103
150.1359861.15390.126183
16-0.091478-0.77620.220081
17-0.062207-0.52780.299615
18-0.192223-1.63110.053622
19-0.032177-0.2730.392805
20-0.201292-1.7080.04597
21-0.04271-0.36240.359055
22-0.032186-0.27310.392777
23-0.215806-1.83120.035606
240.0057410.04870.480642
250.017690.15010.44055
260.0008090.00690.497273
27-0.032481-0.27560.39182
28-0.012604-0.10690.457564
290.023320.19790.421848
30-0.008244-0.070.472212
310.0947270.80380.212083
320.1130670.95940.170283
330.0207920.17640.430229
34-0.03737-0.31710.376044
350.0369950.31390.377248
36-0.087278-0.74060.230679
37-0.018416-0.15630.43813
380.0631230.53560.296938
390.0330270.28020.390047
40-0.140438-1.19170.118655
41-0.115286-0.97820.165618
42-0.014419-0.12240.45148
43-0.127318-1.08030.1418
440.0310070.26310.396612
450.0755070.64070.261877
46-0.024562-0.20840.417745
47-0.047945-0.40680.342672
480.0221650.18810.425673

\begin{tabular}{lllllllll}
\hline
Partial Autocorrelation Function \tabularnewline
Time lag k & PACF(k) & T-STAT & P-value \tabularnewline
1 & 0.351625 & 2.9836 & 0.001944 \tabularnewline
2 & 0.359632 & 3.0516 & 0.001593 \tabularnewline
3 & -0.236011 & -2.0026 & 0.024492 \tabularnewline
4 & 0.12841 & 1.0896 & 0.139763 \tabularnewline
5 & -0.021625 & -0.1835 & 0.427462 \tabularnewline
6 & 0.025148 & 0.2134 & 0.415812 \tabularnewline
7 & 0.085405 & 0.7247 & 0.235496 \tabularnewline
8 & 0.227208 & 1.9279 & 0.028905 \tabularnewline
9 & 0.22563 & 1.9145 & 0.029763 \tabularnewline
10 & 0.043497 & 0.3691 & 0.356574 \tabularnewline
11 & 0.158546 & 1.3453 & 0.091374 \tabularnewline
12 & -0.002536 & -0.0215 & 0.491445 \tabularnewline
13 & -0.099102 & -0.8409 & 0.201591 \tabularnewline
14 & 0.014554 & 0.1235 & 0.45103 \tabularnewline
15 & 0.135986 & 1.1539 & 0.126183 \tabularnewline
16 & -0.091478 & -0.7762 & 0.220081 \tabularnewline
17 & -0.062207 & -0.5278 & 0.299615 \tabularnewline
18 & -0.192223 & -1.6311 & 0.053622 \tabularnewline
19 & -0.032177 & -0.273 & 0.392805 \tabularnewline
20 & -0.201292 & -1.708 & 0.04597 \tabularnewline
21 & -0.04271 & -0.3624 & 0.359055 \tabularnewline
22 & -0.032186 & -0.2731 & 0.392777 \tabularnewline
23 & -0.215806 & -1.8312 & 0.035606 \tabularnewline
24 & 0.005741 & 0.0487 & 0.480642 \tabularnewline
25 & 0.01769 & 0.1501 & 0.44055 \tabularnewline
26 & 0.000809 & 0.0069 & 0.497273 \tabularnewline
27 & -0.032481 & -0.2756 & 0.39182 \tabularnewline
28 & -0.012604 & -0.1069 & 0.457564 \tabularnewline
29 & 0.02332 & 0.1979 & 0.421848 \tabularnewline
30 & -0.008244 & -0.07 & 0.472212 \tabularnewline
31 & 0.094727 & 0.8038 & 0.212083 \tabularnewline
32 & 0.113067 & 0.9594 & 0.170283 \tabularnewline
33 & 0.020792 & 0.1764 & 0.430229 \tabularnewline
34 & -0.03737 & -0.3171 & 0.376044 \tabularnewline
35 & 0.036995 & 0.3139 & 0.377248 \tabularnewline
36 & -0.087278 & -0.7406 & 0.230679 \tabularnewline
37 & -0.018416 & -0.1563 & 0.43813 \tabularnewline
38 & 0.063123 & 0.5356 & 0.296938 \tabularnewline
39 & 0.033027 & 0.2802 & 0.390047 \tabularnewline
40 & -0.140438 & -1.1917 & 0.118655 \tabularnewline
41 & -0.115286 & -0.9782 & 0.165618 \tabularnewline
42 & -0.014419 & -0.1224 & 0.45148 \tabularnewline
43 & -0.127318 & -1.0803 & 0.1418 \tabularnewline
44 & 0.031007 & 0.2631 & 0.396612 \tabularnewline
45 & 0.075507 & 0.6407 & 0.261877 \tabularnewline
46 & -0.024562 & -0.2084 & 0.417745 \tabularnewline
47 & -0.047945 & -0.4068 & 0.342672 \tabularnewline
48 & 0.022165 & 0.1881 & 0.425673 \tabularnewline
\hline
\end{tabular}
%Source: https://freestatistics.org/blog/index.php?pk=75125&T=2

[TABLE]
[ROW][C]Partial Autocorrelation Function[/C][/ROW]
[ROW][C]Time lag k[/C][C]PACF(k)[/C][C]T-STAT[/C][C]P-value[/C][/ROW]
[ROW][C]1[/C][C]0.351625[/C][C]2.9836[/C][C]0.001944[/C][/ROW]
[ROW][C]2[/C][C]0.359632[/C][C]3.0516[/C][C]0.001593[/C][/ROW]
[ROW][C]3[/C][C]-0.236011[/C][C]-2.0026[/C][C]0.024492[/C][/ROW]
[ROW][C]4[/C][C]0.12841[/C][C]1.0896[/C][C]0.139763[/C][/ROW]
[ROW][C]5[/C][C]-0.021625[/C][C]-0.1835[/C][C]0.427462[/C][/ROW]
[ROW][C]6[/C][C]0.025148[/C][C]0.2134[/C][C]0.415812[/C][/ROW]
[ROW][C]7[/C][C]0.085405[/C][C]0.7247[/C][C]0.235496[/C][/ROW]
[ROW][C]8[/C][C]0.227208[/C][C]1.9279[/C][C]0.028905[/C][/ROW]
[ROW][C]9[/C][C]0.22563[/C][C]1.9145[/C][C]0.029763[/C][/ROW]
[ROW][C]10[/C][C]0.043497[/C][C]0.3691[/C][C]0.356574[/C][/ROW]
[ROW][C]11[/C][C]0.158546[/C][C]1.3453[/C][C]0.091374[/C][/ROW]
[ROW][C]12[/C][C]-0.002536[/C][C]-0.0215[/C][C]0.491445[/C][/ROW]
[ROW][C]13[/C][C]-0.099102[/C][C]-0.8409[/C][C]0.201591[/C][/ROW]
[ROW][C]14[/C][C]0.014554[/C][C]0.1235[/C][C]0.45103[/C][/ROW]
[ROW][C]15[/C][C]0.135986[/C][C]1.1539[/C][C]0.126183[/C][/ROW]
[ROW][C]16[/C][C]-0.091478[/C][C]-0.7762[/C][C]0.220081[/C][/ROW]
[ROW][C]17[/C][C]-0.062207[/C][C]-0.5278[/C][C]0.299615[/C][/ROW]
[ROW][C]18[/C][C]-0.192223[/C][C]-1.6311[/C][C]0.053622[/C][/ROW]
[ROW][C]19[/C][C]-0.032177[/C][C]-0.273[/C][C]0.392805[/C][/ROW]
[ROW][C]20[/C][C]-0.201292[/C][C]-1.708[/C][C]0.04597[/C][/ROW]
[ROW][C]21[/C][C]-0.04271[/C][C]-0.3624[/C][C]0.359055[/C][/ROW]
[ROW][C]22[/C][C]-0.032186[/C][C]-0.2731[/C][C]0.392777[/C][/ROW]
[ROW][C]23[/C][C]-0.215806[/C][C]-1.8312[/C][C]0.035606[/C][/ROW]
[ROW][C]24[/C][C]0.005741[/C][C]0.0487[/C][C]0.480642[/C][/ROW]
[ROW][C]25[/C][C]0.01769[/C][C]0.1501[/C][C]0.44055[/C][/ROW]
[ROW][C]26[/C][C]0.000809[/C][C]0.0069[/C][C]0.497273[/C][/ROW]
[ROW][C]27[/C][C]-0.032481[/C][C]-0.2756[/C][C]0.39182[/C][/ROW]
[ROW][C]28[/C][C]-0.012604[/C][C]-0.1069[/C][C]0.457564[/C][/ROW]
[ROW][C]29[/C][C]0.02332[/C][C]0.1979[/C][C]0.421848[/C][/ROW]
[ROW][C]30[/C][C]-0.008244[/C][C]-0.07[/C][C]0.472212[/C][/ROW]
[ROW][C]31[/C][C]0.094727[/C][C]0.8038[/C][C]0.212083[/C][/ROW]
[ROW][C]32[/C][C]0.113067[/C][C]0.9594[/C][C]0.170283[/C][/ROW]
[ROW][C]33[/C][C]0.020792[/C][C]0.1764[/C][C]0.430229[/C][/ROW]
[ROW][C]34[/C][C]-0.03737[/C][C]-0.3171[/C][C]0.376044[/C][/ROW]
[ROW][C]35[/C][C]0.036995[/C][C]0.3139[/C][C]0.377248[/C][/ROW]
[ROW][C]36[/C][C]-0.087278[/C][C]-0.7406[/C][C]0.230679[/C][/ROW]
[ROW][C]37[/C][C]-0.018416[/C][C]-0.1563[/C][C]0.43813[/C][/ROW]
[ROW][C]38[/C][C]0.063123[/C][C]0.5356[/C][C]0.296938[/C][/ROW]
[ROW][C]39[/C][C]0.033027[/C][C]0.2802[/C][C]0.390047[/C][/ROW]
[ROW][C]40[/C][C]-0.140438[/C][C]-1.1917[/C][C]0.118655[/C][/ROW]
[ROW][C]41[/C][C]-0.115286[/C][C]-0.9782[/C][C]0.165618[/C][/ROW]
[ROW][C]42[/C][C]-0.014419[/C][C]-0.1224[/C][C]0.45148[/C][/ROW]
[ROW][C]43[/C][C]-0.127318[/C][C]-1.0803[/C][C]0.1418[/C][/ROW]
[ROW][C]44[/C][C]0.031007[/C][C]0.2631[/C][C]0.396612[/C][/ROW]
[ROW][C]45[/C][C]0.075507[/C][C]0.6407[/C][C]0.261877[/C][/ROW]
[ROW][C]46[/C][C]-0.024562[/C][C]-0.2084[/C][C]0.417745[/C][/ROW]
[ROW][C]47[/C][C]-0.047945[/C][C]-0.4068[/C][C]0.342672[/C][/ROW]
[ROW][C]48[/C][C]0.022165[/C][C]0.1881[/C][C]0.425673[/C][/ROW]
[/TABLE]
Source: https://freestatistics.org/blog/index.php?pk=75125&T=2

Globally Unique Identifier (entire table): ba.freestatistics.org/blog/index.php?pk=75125&T=2

As an alternative you can also use a QR Code:  

The GUIDs for individual cells are displayed in the table below:

Partial Autocorrelation Function
Time lag kPACF(k)T-STATP-value
10.3516252.98360.001944
20.3596323.05160.001593
3-0.236011-2.00260.024492
40.128411.08960.139763
5-0.021625-0.18350.427462
60.0251480.21340.415812
70.0854050.72470.235496
80.2272081.92790.028905
90.225631.91450.029763
100.0434970.36910.356574
110.1585461.34530.091374
12-0.002536-0.02150.491445
13-0.099102-0.84090.201591
140.0145540.12350.45103
150.1359861.15390.126183
16-0.091478-0.77620.220081
17-0.062207-0.52780.299615
18-0.192223-1.63110.053622
19-0.032177-0.2730.392805
20-0.201292-1.7080.04597
21-0.04271-0.36240.359055
22-0.032186-0.27310.392777
23-0.215806-1.83120.035606
240.0057410.04870.480642
250.017690.15010.44055
260.0008090.00690.497273
27-0.032481-0.27560.39182
28-0.012604-0.10690.457564
290.023320.19790.421848
30-0.008244-0.070.472212
310.0947270.80380.212083
320.1130670.95940.170283
330.0207920.17640.430229
34-0.03737-0.31710.376044
350.0369950.31390.377248
36-0.087278-0.74060.230679
37-0.018416-0.15630.43813
380.0631230.53560.296938
390.0330270.28020.390047
40-0.140438-1.19170.118655
41-0.115286-0.97820.165618
42-0.014419-0.12240.45148
43-0.127318-1.08030.1418
440.0310070.26310.396612
450.0755070.64070.261877
46-0.024562-0.20840.417745
47-0.047945-0.40680.342672
480.0221650.18810.425673


Parameters (Session):
par1 = 48 ; par2 = 1 ; par3 = 0 ; par4 = 0 ; par5 = 12 ; par6 = White Noise ; par7 = 0.95 ;
Parameters (R input):
par1 = 48 ; par2 = 1 ; par3 = 0 ; par4 = 0 ; par5 = 12 ; par6 = White Noise ; par7 = 0.95 ;
R code (references can be found in the software module):
if (par1 == 'Default') {
par1 = 10*log10(length(x))
} else {
par1 <- as.numeric(par1)
}
par2 <- as.numeric(par2)
par3 <- as.numeric(par3)
par4 <- as.numeric(par4)
par5 <- as.numeric(par5)
if (par6 == 'White Noise') par6 <- 'white' else par6 <- 'ma'
par7 <- as.numeric(par7)
if (par2 == 0) {
x <- log(x)
} else {
x <- (x ^ par2 - 1) / par2
}
if (par3 > 0) x <- diff(x,lag=1,difference=par3)
if (par4 > 0) x <- diff(x,lag=par5,difference=par4)
bitmap(file='pic1.png')
racf <- acf(x, par1, main='Autocorrelation', xlab='time lag', ylab='ACF', ci.type=par6, ci=par7, sub=paste('(lambda=',par2,', d=',par3,', D=',par4,', CI=', par7, ', CI type=',par6,')',sep=''))
dev.off()
bitmap(file='pic2.png')
rpacf <- pacf(x,par1,main='Partial Autocorrelation',xlab='lags',ylab='PACF')
dev.off()
(myacf <- c(racf$acf))
(mypacf <- c(rpacf$acf))
lengthx <- length(x)
sqrtn <- sqrt(lengthx)
load(file='createtable')
a<-table.start()
a<-table.row.start(a)
a<-table.element(a,'Autocorrelation Function',4,TRUE)
a<-table.row.end(a)
a<-table.row.start(a)
a<-table.element(a,'Time lag k',header=TRUE)
a<-table.element(a,hyperlink('basics.htm','ACF(k)','click here for more information about the Autocorrelation Function'),header=TRUE)
a<-table.element(a,'T-STAT',header=TRUE)
a<-table.element(a,'P-value',header=TRUE)
a<-table.row.end(a)
for (i in 2:(par1+1)) {
a<-table.row.start(a)
a<-table.element(a,i-1,header=TRUE)
a<-table.element(a,round(myacf[i],6))
mytstat <- myacf[i]*sqrtn
a<-table.element(a,round(mytstat,4))
a<-table.element(a,round(1-pt(abs(mytstat),lengthx),6))
a<-table.row.end(a)
}
a<-table.end(a)
table.save(a,file='mytable.tab')
a<-table.start()
a<-table.row.start(a)
a<-table.element(a,'Partial Autocorrelation Function',4,TRUE)
a<-table.row.end(a)
a<-table.row.start(a)
a<-table.element(a,'Time lag k',header=TRUE)
a<-table.element(a,hyperlink('basics.htm','PACF(k)','click here for more information about the Partial Autocorrelation Function'),header=TRUE)
a<-table.element(a,'T-STAT',header=TRUE)
a<-table.element(a,'P-value',header=TRUE)
a<-table.row.end(a)
for (i in 1:par1) {
a<-table.row.start(a)
a<-table.element(a,i,header=TRUE)
a<-table.element(a,round(mypacf[i],6))
mytstat <- mypacf[i]*sqrtn
a<-table.element(a,round(mytstat,4))
a<-table.element(a,round(1-pt(abs(mytstat),lengthx),6))
a<-table.row.end(a)
}
a<-table.end(a)
table.save(a,file='mytable1.tab')