| Multiple Linear Regression - Estimated Regression Equation |
| SWS[t] = + 11.5070110363618 + 3.62542674369367logL[t] -1.20478450362386logWb[t] -1.21779265926030logWbr[t] -1.66487299674713logtg[t] + 1.64304819294433P[t] + 0.498652069543446S[t] -2.76725650888491D[t] + e[t] |
| Multiple Linear Regression - Ordinary Least Squares | |||||
| Variable | Parameter | S.D. | T-STAT H0: parameter = 0 | 2-tail p-value | 1-tail p-value |
| (Intercept) | 11.5070110363618 | 2.861517 | 4.0213 | 0.000344 | 0.000172 |
| logL | 3.62542674369367 | 1.791505 | 2.0237 | 0.051697 | 0.025848 |
| logWb | -1.20478450362386 | 1.099594 | -1.0957 | 0.281666 | 0.140833 |
| logWbr | -1.21779265926030 | 1.61121 | -0.7558 | 0.45546 | 0.22773 |
| logtg | -1.66487299674713 | 1.580985 | -1.0531 | 0.300453 | 0.150226 |
| P | 1.64304819294433 | 0.96774 | 1.6978 | 0.09956 | 0.04978 |
| S | 0.498652069543446 | 0.614079 | 0.812 | 0.422965 | 0.211482 |
| D | -2.76725650888491 | 1.141416 | -2.4244 | 0.021357 | 0.010679 |
| Multiple Linear Regression - Regression Statistics | |
| Multiple R | 0.818281865155944 |
| R-squared | 0.669585210843091 |
| Adjusted R-squared | 0.594975419743143 |
| F-TEST (value) | 8.97449518316053 |
| F-TEST (DF numerator) | 7 |
| F-TEST (DF denominator) | 31 |
| p-value | 5.15396190969852e-06 |
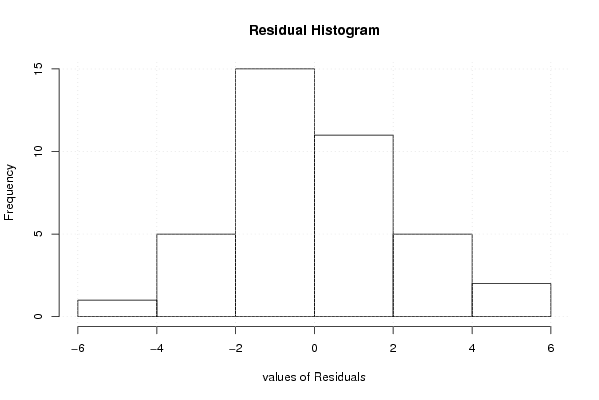
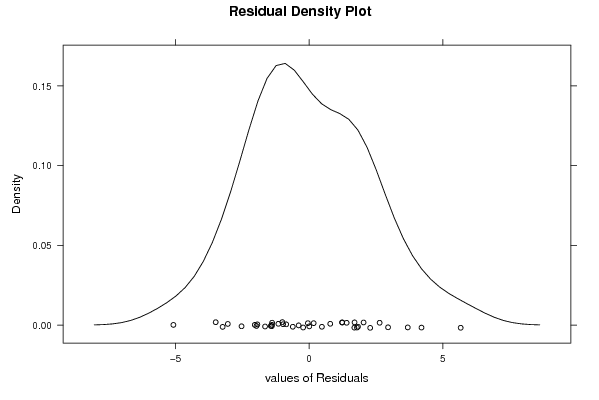
| Multiple Linear Regression - Residual Statistics | |
| Residual Standard Deviation | 2.52549194144789 |
| Sum Squared Residuals | 197.721395935866 |
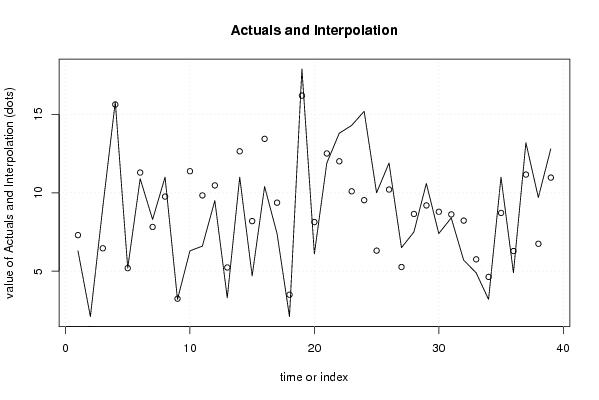
| Multiple Linear Regression - Actuals, Interpolation, and Residuals | |||
| Time or Index | Actuals | Interpolation Forecast | Residuals Prediction Error |
| 1 | 6.3 | 7.30067377562347 | -1.00067377562347 |
| 2 | 2.1 | 1.30901995268004 | 0.79098004731996 |
| 3 | 9.1 | 6.46156637633624 | 2.63843362366376 |
| 4 | 15.8 | 15.6304557323062 | 0.169544267693815 |
| 5 | 5.2 | 5.19340204825216 | 0.00659795174784222 |
| 6 | 10.9 | 11.2913569440383 | -0.391356944038324 |
| 7 | 8.3 | 7.8207702088827 | 0.479229791117297 |
| 8 | 11 | 9.7598189990841 | 1.24018100091590 |
| 9 | 3.2 | 3.24559567404532 | -0.0455956740453236 |
| 10 | 6.3 | 11.376543563123 | -5.076543563123 |
| 11 | 6.6 | 9.83530021023098 | -3.23530021023098 |
| 12 | 9.5 | 10.4724133886001 | -0.972413388600112 |
| 13 | 3.3 | 5.23618475834466 | -1.93618475834466 |
| 14 | 11 | 12.6478374219737 | -1.64783742197371 |
| 15 | 4.7 | 8.19450070518856 | -3.49450070518856 |
| 16 | 10.4 | 13.4409367950058 | -3.04093679500583 |
| 17 | 7.4 | 9.36948297108636 | -1.96948297108636 |
| 18 | 2.1 | 3.49860050236497 | -1.39860050236497 |
| 19 | 17.9 | 16.1994935002315 | 1.70050649976853 |
| 20 | 6.1 | 8.13281744397012 | -2.03281744397012 |
| 21 | 11.9 | 12.5100094070182 | -0.610009407018226 |
| 22 | 13.8 | 12.0107954718009 | 1.78920452819912 |
| 23 | 14.3 | 10.0961074824127 | 4.20389251758726 |
| 24 | 15.2 | 9.5298188936062 | 5.67018110639381 |
| 25 | 10 | 6.30954042909576 | 3.69045957090424 |
| 26 | 11.9 | 10.2077138990662 | 1.69228610093383 |
| 27 | 6.5 | 5.26595009365573 | 1.23404990634427 |
| 28 | 7.5 | 8.64916047120749 | -1.14916047120749 |
| 29 | 10.6 | 9.19494385485147 | 1.40505614514853 |
| 30 | 7.4 | 8.78909661237185 | -1.38909661237185 |
| 31 | 8.4 | 8.62243198931502 | -0.222431989315018 |
| 32 | 5.7 | 8.22690023082095 | -2.52690023082095 |
| 33 | 4.9 | 5.75632184027131 | -0.856321840271307 |
| 34 | 3.2 | 4.63524643894338 | -1.43524643894338 |
| 35 | 11 | 8.71480100848942 | 2.28519899151058 |
| 36 | 4.9 | 6.28463124236496 | -1.38463124236496 |
| 37 | 13.2 | 11.1622599752891 | 2.03774002471087 |
| 38 | 9.7 | 6.74666505404779 | 2.95333494595221 |
| 39 | 12.8 | 10.9708346340032 | 1.82916536599677 |
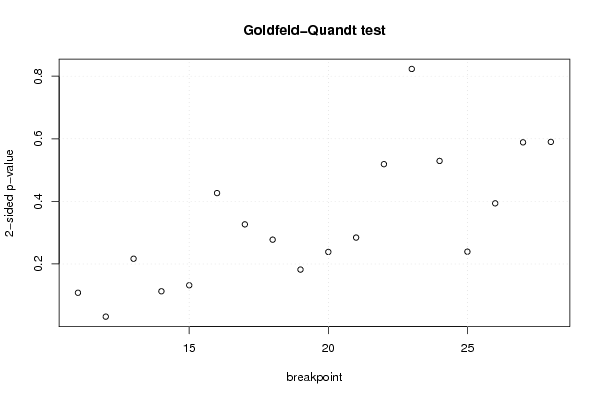
| Goldfeld-Quandt test for Heteroskedasticity | |||
| p-values | Alternative Hypothesis | ||
| breakpoint index | greater | 2-sided | less |
| 11 | 0.0540126442782225 | 0.108025288556445 | 0.945987355721778 |
| 12 | 0.0158369466412963 | 0.0316738932825926 | 0.984163053358704 |
| 13 | 0.108374697020654 | 0.216749394041308 | 0.891625302979346 |
| 14 | 0.0563636159141775 | 0.112727231828355 | 0.943636384085823 |
| 15 | 0.065991134767842 | 0.131982269535684 | 0.934008865232158 |
| 16 | 0.213280857690778 | 0.426561715381557 | 0.786719142309222 |
| 17 | 0.163268210790918 | 0.326536421581835 | 0.836731789209082 |
| 18 | 0.138819506266395 | 0.27763901253279 | 0.861180493733605 |
| 19 | 0.0910506968140397 | 0.182101393628079 | 0.90894930318596 |
| 20 | 0.119240615002762 | 0.238481230005525 | 0.880759384997237 |
| 21 | 0.142174846217819 | 0.284349692435638 | 0.85782515378218 |
| 22 | 0.259439987842637 | 0.518879975685274 | 0.740560012157363 |
| 23 | 0.411559892684357 | 0.823119785368714 | 0.588440107315643 |
| 24 | 0.735384884401555 | 0.52923023119689 | 0.264615115598445 |
| 25 | 0.880372998753681 | 0.239254002492638 | 0.119627001246319 |
| 26 | 0.803128642022743 | 0.393742715954514 | 0.196871357977257 |
| 27 | 0.705657473501532 | 0.588685052996936 | 0.294342526498468 |
| 28 | 0.70498624964135 | 0.590027500717301 | 0.295013750358651 |
| Meta Analysis of Goldfeld-Quandt test for Heteroskedasticity | |||
| Description | # significant tests | % significant tests | OK/NOK |
| 1% type I error level | 0 | 0 | OK |
| 5% type I error level | 1 | 0.0555555555555556 | NOK |
| 10% type I error level | 1 | 0.0555555555555556 | OK |