Free Statistics

of Irreproducible Research!

Author's title

Author*Unverified author*
R Software Modulerwasp_autocorrelation.wasp
Title produced by software(Partial) Autocorrelation Function
Date of computationSat, 01 May 2010 11:55:44 +0000
Cite this page as followsStatistical Computations at FreeStatistics.org, Office for Research Development and Education, URL https://freestatistics.org/blog/index.php?v=date/2010/May/01/t1272715045f2km6oi54i1iz8r.htm/, Retrieved Sat, 27 Apr 2024 16:07:34 +0000
Statistical Computations at FreeStatistics.org, Office for Research Development and Education, URL https://freestatistics.org/blog/index.php?pk=75122, Retrieved Sat, 27 Apr 2024 16:07:34 +0000
QR Codes:

Original text written by user:
IsPrivate?No (this computation is public)
User-defined keywordsKDGP2W21
Estimated Impact125
Family? (F = Feedback message, R = changed R code, M = changed R Module, P = changed Parameters, D = changed Data)
-       [(Partial) Autocorrelation Function] [geboortes new york] [2010-05-01 11:55:44] [d7538e569801d54d04f9597e433c8097] [Current]
Feedback Forum

Post a new message
Dataseries X:
26.663
23.598
26.931
24.740
25.806
24.364
24.477
23.901
23.175
23.227
21.672
21.870
21.439
21.089
23.709
21.669
21.752
20.761
23.479
23.824
23.105
23.110
21.759
22.073
21.937
20.035
23.590
21.672
22.222
22.123
23.950
23.504
22.238
23.142
21.059
21.573
21.548
20.000
22.424
20.615
21.761
22.874
24.104
23.748
23.262
22.907
21.519
22.025
22.604
20.894
24.677
23.673
25.320
23.583
24.671
24.454
24.122
24.252
22.084
22.991
23.287
23.049
25.076
24.037
24.430
24.667
26.451
25.618
25.014
25.110
22.964
23.981
23.798
22.270
24.775
22.646
23.988
24.737
26.276
25.816
25.210
25.199
23.162
24.707
24.364
22.644
25.565
24.062
25.431
24.635
27.009
26.606
26.268
26.462
25.246
25.180
24.657
23.304
26.982
26.199
27.210
26.122
26.706
26.878
26.152
26.379
24.712
25.688
24.990
24.239
26.721
23.475
24.767
26.219
28.361
28.599
27.914
27.784
25.693
26.881
26.217
24.218
27.914
26.975
28.527
27.139
28.982
28.169
28.056
29.136
26.291
26.987
26.589
24.848
27.543
26.896
28.878
27.390
28.065
28.141
29.048
28.484
26.634
27.735
27.132
24.924
28.963
26.589
27.931
28.009
29.229
28.759
28.405
27.945
25.912
26.619
26.076
25.286
27.660
25.951
26.398
25.565
28.865
30.000
29.261
29.012
26.992
27.897


Summary of computational transaction
Raw Inputview raw input (R code)
Raw Outputview raw output of R engine
Computing time2 seconds
R Server'RServer@AstonUniversity' @ vre.aston.ac.uk

\begin{tabular}{lllllllll}
\hline
Summary of computational transaction \tabularnewline
Raw Input & view raw input (R code)  \tabularnewline
Raw Output & view raw output of R engine  \tabularnewline
Computing time & 2 seconds \tabularnewline
R Server & 'RServer@AstonUniversity' @ vre.aston.ac.uk \tabularnewline
\hline
\end{tabular}
%Source: https://freestatistics.org/blog/index.php?pk=75122&T=0

[TABLE]
[ROW][C]Summary of computational transaction[/C][/ROW]
[ROW][C]Raw Input[/C][C]view raw input (R code) [/C][/ROW]
[ROW][C]Raw Output[/C][C]view raw output of R engine [/C][/ROW]
[ROW][C]Computing time[/C][C]2 seconds[/C][/ROW]
[ROW][C]R Server[/C][C]'RServer@AstonUniversity' @ vre.aston.ac.uk[/C][/ROW]
[/TABLE]
Source: https://freestatistics.org/blog/index.php?pk=75122&T=0

Globally Unique Identifier (entire table): ba.freestatistics.org/blog/index.php?pk=75122&T=0

As an alternative you can also use a QR Code:  

The GUIDs for individual cells are displayed in the table below:

Summary of computational transaction
Raw Inputview raw input (R code)
Raw Outputview raw output of R engine
Computing time2 seconds
R Server'RServer@AstonUniversity' @ vre.aston.ac.uk


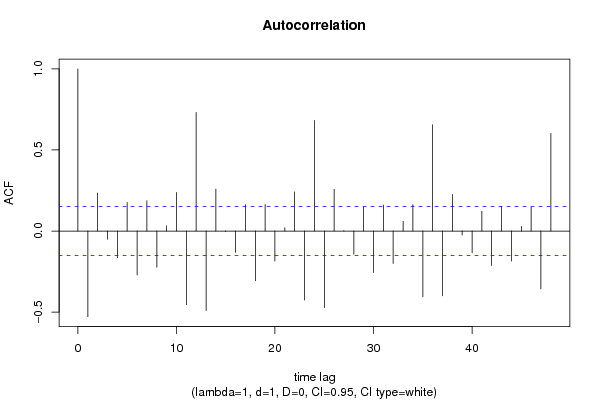
Autocorrelation Function
Time lag kACF(k)T-STATP-value
1-0.528223-6.82610
20.2341173.02550.001438
3-0.050322-0.65030.258193
4-0.164367-2.12410.017567
50.1766092.28230.011867
6-0.271277-3.50570.000292
70.186232.40660.008596
8-0.224158-2.89680.002138
90.0318490.41160.340589
100.2375463.06980.00125
11-0.454153-5.86890
120.730999.44650
13-0.490634-6.34040
140.2582833.33780.000521
15-0.002645-0.03420.486386
16-0.132247-1.7090.044654
170.1619632.0930.018929
18-0.306904-3.96615.4e-05
190.1631942.10890.018221
20-0.185464-2.39670.008823
210.0208730.26970.393845
220.2406833.11030.001099
23-0.425493-5.49860
240.6818738.81170
25-0.471598-6.09440
260.257263.32450.000544
270.0024590.03180.487345
28-0.143534-1.85490.032689
290.1482651.9160.028536
30-0.255878-3.30670.000578
310.1603372.0720.019901
32-0.199863-2.58280.005329
330.059640.77070.220981
340.1621582.09550.018816
35-0.405992-5.24660
360.6564858.48370
37-0.398892-5.15480
380.2252972.91150.002044
39-0.024661-0.31870.375182
40-0.13419-1.73410.042371
410.1213731.56850.05933
42-0.213188-2.7550.00326
430.1503071.94240.026886
44-0.185184-2.39310.008908
450.0283830.36680.357122
460.1478821.91110.028856
47-0.357062-4.61434e-06
480.6015377.77360

\begin{tabular}{lllllllll}
\hline
Autocorrelation Function \tabularnewline
Time lag k & ACF(k) & T-STAT & P-value \tabularnewline
1 & -0.528223 & -6.8261 & 0 \tabularnewline
2 & 0.234117 & 3.0255 & 0.001438 \tabularnewline
3 & -0.050322 & -0.6503 & 0.258193 \tabularnewline
4 & -0.164367 & -2.1241 & 0.017567 \tabularnewline
5 & 0.176609 & 2.2823 & 0.011867 \tabularnewline
6 & -0.271277 & -3.5057 & 0.000292 \tabularnewline
7 & 0.18623 & 2.4066 & 0.008596 \tabularnewline
8 & -0.224158 & -2.8968 & 0.002138 \tabularnewline
9 & 0.031849 & 0.4116 & 0.340589 \tabularnewline
10 & 0.237546 & 3.0698 & 0.00125 \tabularnewline
11 & -0.454153 & -5.8689 & 0 \tabularnewline
12 & 0.73099 & 9.4465 & 0 \tabularnewline
13 & -0.490634 & -6.3404 & 0 \tabularnewline
14 & 0.258283 & 3.3378 & 0.000521 \tabularnewline
15 & -0.002645 & -0.0342 & 0.486386 \tabularnewline
16 & -0.132247 & -1.709 & 0.044654 \tabularnewline
17 & 0.161963 & 2.093 & 0.018929 \tabularnewline
18 & -0.306904 & -3.9661 & 5.4e-05 \tabularnewline
19 & 0.163194 & 2.1089 & 0.018221 \tabularnewline
20 & -0.185464 & -2.3967 & 0.008823 \tabularnewline
21 & 0.020873 & 0.2697 & 0.393845 \tabularnewline
22 & 0.240683 & 3.1103 & 0.001099 \tabularnewline
23 & -0.425493 & -5.4986 & 0 \tabularnewline
24 & 0.681873 & 8.8117 & 0 \tabularnewline
25 & -0.471598 & -6.0944 & 0 \tabularnewline
26 & 0.25726 & 3.3245 & 0.000544 \tabularnewline
27 & 0.002459 & 0.0318 & 0.487345 \tabularnewline
28 & -0.143534 & -1.8549 & 0.032689 \tabularnewline
29 & 0.148265 & 1.916 & 0.028536 \tabularnewline
30 & -0.255878 & -3.3067 & 0.000578 \tabularnewline
31 & 0.160337 & 2.072 & 0.019901 \tabularnewline
32 & -0.199863 & -2.5828 & 0.005329 \tabularnewline
33 & 0.05964 & 0.7707 & 0.220981 \tabularnewline
34 & 0.162158 & 2.0955 & 0.018816 \tabularnewline
35 & -0.405992 & -5.2466 & 0 \tabularnewline
36 & 0.656485 & 8.4837 & 0 \tabularnewline
37 & -0.398892 & -5.1548 & 0 \tabularnewline
38 & 0.225297 & 2.9115 & 0.002044 \tabularnewline
39 & -0.024661 & -0.3187 & 0.375182 \tabularnewline
40 & -0.13419 & -1.7341 & 0.042371 \tabularnewline
41 & 0.121373 & 1.5685 & 0.05933 \tabularnewline
42 & -0.213188 & -2.755 & 0.00326 \tabularnewline
43 & 0.150307 & 1.9424 & 0.026886 \tabularnewline
44 & -0.185184 & -2.3931 & 0.008908 \tabularnewline
45 & 0.028383 & 0.3668 & 0.357122 \tabularnewline
46 & 0.147882 & 1.9111 & 0.028856 \tabularnewline
47 & -0.357062 & -4.6143 & 4e-06 \tabularnewline
48 & 0.601537 & 7.7736 & 0 \tabularnewline
\hline
\end{tabular}
%Source: https://freestatistics.org/blog/index.php?pk=75122&T=1

[TABLE]
[ROW][C]Autocorrelation Function[/C][/ROW]
[ROW][C]Time lag k[/C][C]ACF(k)[/C][C]T-STAT[/C][C]P-value[/C][/ROW]
[ROW][C]1[/C][C]-0.528223[/C][C]-6.8261[/C][C]0[/C][/ROW]
[ROW][C]2[/C][C]0.234117[/C][C]3.0255[/C][C]0.001438[/C][/ROW]
[ROW][C]3[/C][C]-0.050322[/C][C]-0.6503[/C][C]0.258193[/C][/ROW]
[ROW][C]4[/C][C]-0.164367[/C][C]-2.1241[/C][C]0.017567[/C][/ROW]
[ROW][C]5[/C][C]0.176609[/C][C]2.2823[/C][C]0.011867[/C][/ROW]
[ROW][C]6[/C][C]-0.271277[/C][C]-3.5057[/C][C]0.000292[/C][/ROW]
[ROW][C]7[/C][C]0.18623[/C][C]2.4066[/C][C]0.008596[/C][/ROW]
[ROW][C]8[/C][C]-0.224158[/C][C]-2.8968[/C][C]0.002138[/C][/ROW]
[ROW][C]9[/C][C]0.031849[/C][C]0.4116[/C][C]0.340589[/C][/ROW]
[ROW][C]10[/C][C]0.237546[/C][C]3.0698[/C][C]0.00125[/C][/ROW]
[ROW][C]11[/C][C]-0.454153[/C][C]-5.8689[/C][C]0[/C][/ROW]
[ROW][C]12[/C][C]0.73099[/C][C]9.4465[/C][C]0[/C][/ROW]
[ROW][C]13[/C][C]-0.490634[/C][C]-6.3404[/C][C]0[/C][/ROW]
[ROW][C]14[/C][C]0.258283[/C][C]3.3378[/C][C]0.000521[/C][/ROW]
[ROW][C]15[/C][C]-0.002645[/C][C]-0.0342[/C][C]0.486386[/C][/ROW]
[ROW][C]16[/C][C]-0.132247[/C][C]-1.709[/C][C]0.044654[/C][/ROW]
[ROW][C]17[/C][C]0.161963[/C][C]2.093[/C][C]0.018929[/C][/ROW]
[ROW][C]18[/C][C]-0.306904[/C][C]-3.9661[/C][C]5.4e-05[/C][/ROW]
[ROW][C]19[/C][C]0.163194[/C][C]2.1089[/C][C]0.018221[/C][/ROW]
[ROW][C]20[/C][C]-0.185464[/C][C]-2.3967[/C][C]0.008823[/C][/ROW]
[ROW][C]21[/C][C]0.020873[/C][C]0.2697[/C][C]0.393845[/C][/ROW]
[ROW][C]22[/C][C]0.240683[/C][C]3.1103[/C][C]0.001099[/C][/ROW]
[ROW][C]23[/C][C]-0.425493[/C][C]-5.4986[/C][C]0[/C][/ROW]
[ROW][C]24[/C][C]0.681873[/C][C]8.8117[/C][C]0[/C][/ROW]
[ROW][C]25[/C][C]-0.471598[/C][C]-6.0944[/C][C]0[/C][/ROW]
[ROW][C]26[/C][C]0.25726[/C][C]3.3245[/C][C]0.000544[/C][/ROW]
[ROW][C]27[/C][C]0.002459[/C][C]0.0318[/C][C]0.487345[/C][/ROW]
[ROW][C]28[/C][C]-0.143534[/C][C]-1.8549[/C][C]0.032689[/C][/ROW]
[ROW][C]29[/C][C]0.148265[/C][C]1.916[/C][C]0.028536[/C][/ROW]
[ROW][C]30[/C][C]-0.255878[/C][C]-3.3067[/C][C]0.000578[/C][/ROW]
[ROW][C]31[/C][C]0.160337[/C][C]2.072[/C][C]0.019901[/C][/ROW]
[ROW][C]32[/C][C]-0.199863[/C][C]-2.5828[/C][C]0.005329[/C][/ROW]
[ROW][C]33[/C][C]0.05964[/C][C]0.7707[/C][C]0.220981[/C][/ROW]
[ROW][C]34[/C][C]0.162158[/C][C]2.0955[/C][C]0.018816[/C][/ROW]
[ROW][C]35[/C][C]-0.405992[/C][C]-5.2466[/C][C]0[/C][/ROW]
[ROW][C]36[/C][C]0.656485[/C][C]8.4837[/C][C]0[/C][/ROW]
[ROW][C]37[/C][C]-0.398892[/C][C]-5.1548[/C][C]0[/C][/ROW]
[ROW][C]38[/C][C]0.225297[/C][C]2.9115[/C][C]0.002044[/C][/ROW]
[ROW][C]39[/C][C]-0.024661[/C][C]-0.3187[/C][C]0.375182[/C][/ROW]
[ROW][C]40[/C][C]-0.13419[/C][C]-1.7341[/C][C]0.042371[/C][/ROW]
[ROW][C]41[/C][C]0.121373[/C][C]1.5685[/C][C]0.05933[/C][/ROW]
[ROW][C]42[/C][C]-0.213188[/C][C]-2.755[/C][C]0.00326[/C][/ROW]
[ROW][C]43[/C][C]0.150307[/C][C]1.9424[/C][C]0.026886[/C][/ROW]
[ROW][C]44[/C][C]-0.185184[/C][C]-2.3931[/C][C]0.008908[/C][/ROW]
[ROW][C]45[/C][C]0.028383[/C][C]0.3668[/C][C]0.357122[/C][/ROW]
[ROW][C]46[/C][C]0.147882[/C][C]1.9111[/C][C]0.028856[/C][/ROW]
[ROW][C]47[/C][C]-0.357062[/C][C]-4.6143[/C][C]4e-06[/C][/ROW]
[ROW][C]48[/C][C]0.601537[/C][C]7.7736[/C][C]0[/C][/ROW]
[/TABLE]
Source: https://freestatistics.org/blog/index.php?pk=75122&T=1

Globally Unique Identifier (entire table): ba.freestatistics.org/blog/index.php?pk=75122&T=1

As an alternative you can also use a QR Code:  

The GUIDs for individual cells are displayed in the table below:

Autocorrelation Function
Time lag kACF(k)T-STATP-value
1-0.528223-6.82610
20.2341173.02550.001438
3-0.050322-0.65030.258193
4-0.164367-2.12410.017567
50.1766092.28230.011867
6-0.271277-3.50570.000292
70.186232.40660.008596
8-0.224158-2.89680.002138
90.0318490.41160.340589
100.2375463.06980.00125
11-0.454153-5.86890
120.730999.44650
13-0.490634-6.34040
140.2582833.33780.000521
15-0.002645-0.03420.486386
16-0.132247-1.7090.044654
170.1619632.0930.018929
18-0.306904-3.96615.4e-05
190.1631942.10890.018221
20-0.185464-2.39670.008823
210.0208730.26970.393845
220.2406833.11030.001099
23-0.425493-5.49860
240.6818738.81170
25-0.471598-6.09440
260.257263.32450.000544
270.0024590.03180.487345
28-0.143534-1.85490.032689
290.1482651.9160.028536
30-0.255878-3.30670.000578
310.1603372.0720.019901
32-0.199863-2.58280.005329
330.059640.77070.220981
340.1621582.09550.018816
35-0.405992-5.24660
360.6564858.48370
37-0.398892-5.15480
380.2252972.91150.002044
39-0.024661-0.31870.375182
40-0.13419-1.73410.042371
410.1213731.56850.05933
42-0.213188-2.7550.00326
430.1503071.94240.026886
44-0.185184-2.39310.008908
450.0283830.36680.357122
460.1478821.91110.028856
47-0.357062-4.61434e-06
480.6015377.77360


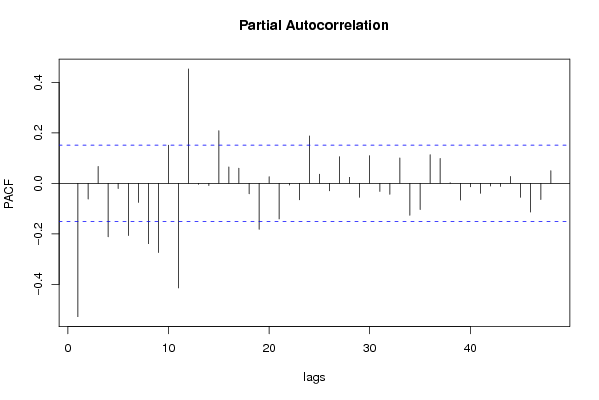
Partial Autocorrelation Function
Time lag kPACF(k)T-STATP-value
1-0.528223-6.82610
2-0.06228-0.80480.211031
30.0670410.86640.193767
4-0.211493-2.73310.003475
5-0.020414-0.26380.396128
6-0.206531-2.6690.004179
7-0.075456-0.97510.16546
8-0.239058-3.08930.001175
9-0.273923-3.53990.000259
100.1512711.95490.026135
11-0.414258-5.35340
120.4532935.85780
13-0.003783-0.04890.480532
14-0.008879-0.11470.454392
150.2083322.69220.00391
160.0651590.8420.200485
170.0600410.77590.219451
18-0.041328-0.53410.296999
19-0.181905-2.35070.009952
200.0264640.3420.366394
21-0.140942-1.82140.035169
22-0.006687-0.08640.465622
23-0.065105-0.84130.200679
240.1877072.42570.008172
250.0365290.47210.318752
26-0.029587-0.38230.351344
270.1052911.36070.087728
280.0238540.30830.379135
29-0.055482-0.7170.237191
300.1092531.41190.079926
31-0.031855-0.41170.340559
32-0.043149-0.55760.288928
330.1006341.30050.097616
34-0.126695-1.63730.05173
35-0.103617-1.3390.091191
360.1137191.46960.071779
370.0982971.27030.102877
380.0028490.03680.485338
39-0.066485-0.85920.195736
40-0.013552-0.17510.430595
41-0.039192-0.50650.306597
42-0.010414-0.13460.446552
43-0.012138-0.15690.437774
440.0270050.3490.36377
45-0.055128-0.71240.238601
46-0.114003-1.47320.071283
47-0.063791-0.82440.205455
480.050020.64640.259452

\begin{tabular}{lllllllll}
\hline
Partial Autocorrelation Function \tabularnewline
Time lag k & PACF(k) & T-STAT & P-value \tabularnewline
1 & -0.528223 & -6.8261 & 0 \tabularnewline
2 & -0.06228 & -0.8048 & 0.211031 \tabularnewline
3 & 0.067041 & 0.8664 & 0.193767 \tabularnewline
4 & -0.211493 & -2.7331 & 0.003475 \tabularnewline
5 & -0.020414 & -0.2638 & 0.396128 \tabularnewline
6 & -0.206531 & -2.669 & 0.004179 \tabularnewline
7 & -0.075456 & -0.9751 & 0.16546 \tabularnewline
8 & -0.239058 & -3.0893 & 0.001175 \tabularnewline
9 & -0.273923 & -3.5399 & 0.000259 \tabularnewline
10 & 0.151271 & 1.9549 & 0.026135 \tabularnewline
11 & -0.414258 & -5.3534 & 0 \tabularnewline
12 & 0.453293 & 5.8578 & 0 \tabularnewline
13 & -0.003783 & -0.0489 & 0.480532 \tabularnewline
14 & -0.008879 & -0.1147 & 0.454392 \tabularnewline
15 & 0.208332 & 2.6922 & 0.00391 \tabularnewline
16 & 0.065159 & 0.842 & 0.200485 \tabularnewline
17 & 0.060041 & 0.7759 & 0.219451 \tabularnewline
18 & -0.041328 & -0.5341 & 0.296999 \tabularnewline
19 & -0.181905 & -2.3507 & 0.009952 \tabularnewline
20 & 0.026464 & 0.342 & 0.366394 \tabularnewline
21 & -0.140942 & -1.8214 & 0.035169 \tabularnewline
22 & -0.006687 & -0.0864 & 0.465622 \tabularnewline
23 & -0.065105 & -0.8413 & 0.200679 \tabularnewline
24 & 0.187707 & 2.4257 & 0.008172 \tabularnewline
25 & 0.036529 & 0.4721 & 0.318752 \tabularnewline
26 & -0.029587 & -0.3823 & 0.351344 \tabularnewline
27 & 0.105291 & 1.3607 & 0.087728 \tabularnewline
28 & 0.023854 & 0.3083 & 0.379135 \tabularnewline
29 & -0.055482 & -0.717 & 0.237191 \tabularnewline
30 & 0.109253 & 1.4119 & 0.079926 \tabularnewline
31 & -0.031855 & -0.4117 & 0.340559 \tabularnewline
32 & -0.043149 & -0.5576 & 0.288928 \tabularnewline
33 & 0.100634 & 1.3005 & 0.097616 \tabularnewline
34 & -0.126695 & -1.6373 & 0.05173 \tabularnewline
35 & -0.103617 & -1.339 & 0.091191 \tabularnewline
36 & 0.113719 & 1.4696 & 0.071779 \tabularnewline
37 & 0.098297 & 1.2703 & 0.102877 \tabularnewline
38 & 0.002849 & 0.0368 & 0.485338 \tabularnewline
39 & -0.066485 & -0.8592 & 0.195736 \tabularnewline
40 & -0.013552 & -0.1751 & 0.430595 \tabularnewline
41 & -0.039192 & -0.5065 & 0.306597 \tabularnewline
42 & -0.010414 & -0.1346 & 0.446552 \tabularnewline
43 & -0.012138 & -0.1569 & 0.437774 \tabularnewline
44 & 0.027005 & 0.349 & 0.36377 \tabularnewline
45 & -0.055128 & -0.7124 & 0.238601 \tabularnewline
46 & -0.114003 & -1.4732 & 0.071283 \tabularnewline
47 & -0.063791 & -0.8244 & 0.205455 \tabularnewline
48 & 0.05002 & 0.6464 & 0.259452 \tabularnewline
\hline
\end{tabular}
%Source: https://freestatistics.org/blog/index.php?pk=75122&T=2

[TABLE]
[ROW][C]Partial Autocorrelation Function[/C][/ROW]
[ROW][C]Time lag k[/C][C]PACF(k)[/C][C]T-STAT[/C][C]P-value[/C][/ROW]
[ROW][C]1[/C][C]-0.528223[/C][C]-6.8261[/C][C]0[/C][/ROW]
[ROW][C]2[/C][C]-0.06228[/C][C]-0.8048[/C][C]0.211031[/C][/ROW]
[ROW][C]3[/C][C]0.067041[/C][C]0.8664[/C][C]0.193767[/C][/ROW]
[ROW][C]4[/C][C]-0.211493[/C][C]-2.7331[/C][C]0.003475[/C][/ROW]
[ROW][C]5[/C][C]-0.020414[/C][C]-0.2638[/C][C]0.396128[/C][/ROW]
[ROW][C]6[/C][C]-0.206531[/C][C]-2.669[/C][C]0.004179[/C][/ROW]
[ROW][C]7[/C][C]-0.075456[/C][C]-0.9751[/C][C]0.16546[/C][/ROW]
[ROW][C]8[/C][C]-0.239058[/C][C]-3.0893[/C][C]0.001175[/C][/ROW]
[ROW][C]9[/C][C]-0.273923[/C][C]-3.5399[/C][C]0.000259[/C][/ROW]
[ROW][C]10[/C][C]0.151271[/C][C]1.9549[/C][C]0.026135[/C][/ROW]
[ROW][C]11[/C][C]-0.414258[/C][C]-5.3534[/C][C]0[/C][/ROW]
[ROW][C]12[/C][C]0.453293[/C][C]5.8578[/C][C]0[/C][/ROW]
[ROW][C]13[/C][C]-0.003783[/C][C]-0.0489[/C][C]0.480532[/C][/ROW]
[ROW][C]14[/C][C]-0.008879[/C][C]-0.1147[/C][C]0.454392[/C][/ROW]
[ROW][C]15[/C][C]0.208332[/C][C]2.6922[/C][C]0.00391[/C][/ROW]
[ROW][C]16[/C][C]0.065159[/C][C]0.842[/C][C]0.200485[/C][/ROW]
[ROW][C]17[/C][C]0.060041[/C][C]0.7759[/C][C]0.219451[/C][/ROW]
[ROW][C]18[/C][C]-0.041328[/C][C]-0.5341[/C][C]0.296999[/C][/ROW]
[ROW][C]19[/C][C]-0.181905[/C][C]-2.3507[/C][C]0.009952[/C][/ROW]
[ROW][C]20[/C][C]0.026464[/C][C]0.342[/C][C]0.366394[/C][/ROW]
[ROW][C]21[/C][C]-0.140942[/C][C]-1.8214[/C][C]0.035169[/C][/ROW]
[ROW][C]22[/C][C]-0.006687[/C][C]-0.0864[/C][C]0.465622[/C][/ROW]
[ROW][C]23[/C][C]-0.065105[/C][C]-0.8413[/C][C]0.200679[/C][/ROW]
[ROW][C]24[/C][C]0.187707[/C][C]2.4257[/C][C]0.008172[/C][/ROW]
[ROW][C]25[/C][C]0.036529[/C][C]0.4721[/C][C]0.318752[/C][/ROW]
[ROW][C]26[/C][C]-0.029587[/C][C]-0.3823[/C][C]0.351344[/C][/ROW]
[ROW][C]27[/C][C]0.105291[/C][C]1.3607[/C][C]0.087728[/C][/ROW]
[ROW][C]28[/C][C]0.023854[/C][C]0.3083[/C][C]0.379135[/C][/ROW]
[ROW][C]29[/C][C]-0.055482[/C][C]-0.717[/C][C]0.237191[/C][/ROW]
[ROW][C]30[/C][C]0.109253[/C][C]1.4119[/C][C]0.079926[/C][/ROW]
[ROW][C]31[/C][C]-0.031855[/C][C]-0.4117[/C][C]0.340559[/C][/ROW]
[ROW][C]32[/C][C]-0.043149[/C][C]-0.5576[/C][C]0.288928[/C][/ROW]
[ROW][C]33[/C][C]0.100634[/C][C]1.3005[/C][C]0.097616[/C][/ROW]
[ROW][C]34[/C][C]-0.126695[/C][C]-1.6373[/C][C]0.05173[/C][/ROW]
[ROW][C]35[/C][C]-0.103617[/C][C]-1.339[/C][C]0.091191[/C][/ROW]
[ROW][C]36[/C][C]0.113719[/C][C]1.4696[/C][C]0.071779[/C][/ROW]
[ROW][C]37[/C][C]0.098297[/C][C]1.2703[/C][C]0.102877[/C][/ROW]
[ROW][C]38[/C][C]0.002849[/C][C]0.0368[/C][C]0.485338[/C][/ROW]
[ROW][C]39[/C][C]-0.066485[/C][C]-0.8592[/C][C]0.195736[/C][/ROW]
[ROW][C]40[/C][C]-0.013552[/C][C]-0.1751[/C][C]0.430595[/C][/ROW]
[ROW][C]41[/C][C]-0.039192[/C][C]-0.5065[/C][C]0.306597[/C][/ROW]
[ROW][C]42[/C][C]-0.010414[/C][C]-0.1346[/C][C]0.446552[/C][/ROW]
[ROW][C]43[/C][C]-0.012138[/C][C]-0.1569[/C][C]0.437774[/C][/ROW]
[ROW][C]44[/C][C]0.027005[/C][C]0.349[/C][C]0.36377[/C][/ROW]
[ROW][C]45[/C][C]-0.055128[/C][C]-0.7124[/C][C]0.238601[/C][/ROW]
[ROW][C]46[/C][C]-0.114003[/C][C]-1.4732[/C][C]0.071283[/C][/ROW]
[ROW][C]47[/C][C]-0.063791[/C][C]-0.8244[/C][C]0.205455[/C][/ROW]
[ROW][C]48[/C][C]0.05002[/C][C]0.6464[/C][C]0.259452[/C][/ROW]
[/TABLE]
Source: https://freestatistics.org/blog/index.php?pk=75122&T=2

Globally Unique Identifier (entire table): ba.freestatistics.org/blog/index.php?pk=75122&T=2

As an alternative you can also use a QR Code:  

The GUIDs for individual cells are displayed in the table below:

Partial Autocorrelation Function
Time lag kPACF(k)T-STATP-value
1-0.528223-6.82610
2-0.06228-0.80480.211031
30.0670410.86640.193767
4-0.211493-2.73310.003475
5-0.020414-0.26380.396128
6-0.206531-2.6690.004179
7-0.075456-0.97510.16546
8-0.239058-3.08930.001175
9-0.273923-3.53990.000259
100.1512711.95490.026135
11-0.414258-5.35340
120.4532935.85780
13-0.003783-0.04890.480532
14-0.008879-0.11470.454392
150.2083322.69220.00391
160.0651590.8420.200485
170.0600410.77590.219451
18-0.041328-0.53410.296999
19-0.181905-2.35070.009952
200.0264640.3420.366394
21-0.140942-1.82140.035169
22-0.006687-0.08640.465622
23-0.065105-0.84130.200679
240.1877072.42570.008172
250.0365290.47210.318752
26-0.029587-0.38230.351344
270.1052911.36070.087728
280.0238540.30830.379135
29-0.055482-0.7170.237191
300.1092531.41190.079926
31-0.031855-0.41170.340559
32-0.043149-0.55760.288928
330.1006341.30050.097616
34-0.126695-1.63730.05173
35-0.103617-1.3390.091191
360.1137191.46960.071779
370.0982971.27030.102877
380.0028490.03680.485338
39-0.066485-0.85920.195736
40-0.013552-0.17510.430595
41-0.039192-0.50650.306597
42-0.010414-0.13460.446552
43-0.012138-0.15690.437774
440.0270050.3490.36377
45-0.055128-0.71240.238601
46-0.114003-1.47320.071283
47-0.063791-0.82440.205455
480.050020.64640.259452


Parameters (Session):
par1 = 48 ; par2 = 1 ; par3 = 1 ; par4 = 0 ; par5 = 12 ; par6 = White Noise ; par7 = 0.95 ;
Parameters (R input):
par1 = 48 ; par2 = 1 ; par3 = 1 ; par4 = 0 ; par5 = 12 ; par6 = White Noise ; par7 = 0.95 ;
R code (references can be found in the software module):
if (par1 == 'Default') {
par1 = 10*log10(length(x))
} else {
par1 <- as.numeric(par1)
}
par2 <- as.numeric(par2)
par3 <- as.numeric(par3)
par4 <- as.numeric(par4)
par5 <- as.numeric(par5)
if (par6 == 'White Noise') par6 <- 'white' else par6 <- 'ma'
par7 <- as.numeric(par7)
if (par2 == 0) {
x <- log(x)
} else {
x <- (x ^ par2 - 1) / par2
}
if (par3 > 0) x <- diff(x,lag=1,difference=par3)
if (par4 > 0) x <- diff(x,lag=par5,difference=par4)
bitmap(file='pic1.png')
racf <- acf(x, par1, main='Autocorrelation', xlab='time lag', ylab='ACF', ci.type=par6, ci=par7, sub=paste('(lambda=',par2,', d=',par3,', D=',par4,', CI=', par7, ', CI type=',par6,')',sep=''))
dev.off()
bitmap(file='pic2.png')
rpacf <- pacf(x,par1,main='Partial Autocorrelation',xlab='lags',ylab='PACF')
dev.off()
(myacf <- c(racf$acf))
(mypacf <- c(rpacf$acf))
lengthx <- length(x)
sqrtn <- sqrt(lengthx)
load(file='createtable')
a<-table.start()
a<-table.row.start(a)
a<-table.element(a,'Autocorrelation Function',4,TRUE)
a<-table.row.end(a)
a<-table.row.start(a)
a<-table.element(a,'Time lag k',header=TRUE)
a<-table.element(a,hyperlink('basics.htm','ACF(k)','click here for more information about the Autocorrelation Function'),header=TRUE)
a<-table.element(a,'T-STAT',header=TRUE)
a<-table.element(a,'P-value',header=TRUE)
a<-table.row.end(a)
for (i in 2:(par1+1)) {
a<-table.row.start(a)
a<-table.element(a,i-1,header=TRUE)
a<-table.element(a,round(myacf[i],6))
mytstat <- myacf[i]*sqrtn
a<-table.element(a,round(mytstat,4))
a<-table.element(a,round(1-pt(abs(mytstat),lengthx),6))
a<-table.row.end(a)
}
a<-table.end(a)
table.save(a,file='mytable.tab')
a<-table.start()
a<-table.row.start(a)
a<-table.element(a,'Partial Autocorrelation Function',4,TRUE)
a<-table.row.end(a)
a<-table.row.start(a)
a<-table.element(a,'Time lag k',header=TRUE)
a<-table.element(a,hyperlink('basics.htm','PACF(k)','click here for more information about the Partial Autocorrelation Function'),header=TRUE)
a<-table.element(a,'T-STAT',header=TRUE)
a<-table.element(a,'P-value',header=TRUE)
a<-table.row.end(a)
for (i in 1:par1) {
a<-table.row.start(a)
a<-table.element(a,i,header=TRUE)
a<-table.element(a,round(mypacf[i],6))
mytstat <- mypacf[i]*sqrtn
a<-table.element(a,round(mytstat,4))
a<-table.element(a,round(1-pt(abs(mytstat),lengthx),6))
a<-table.row.end(a)
}
a<-table.end(a)
table.save(a,file='mytable1.tab')