Free Statistics

of Irreproducible Research!

Author's title

Author*Unverified author*
R Software Modulerwasp_autocorrelation.wasp
Title produced by software(Partial) Autocorrelation Function
Date of computationSat, 01 May 2010 10:43:00 +0000
Cite this page as followsStatistical Computations at FreeStatistics.org, Office for Research Development and Education, URL https://freestatistics.org/blog/index.php?v=date/2010/May/01/t1272710835j7hnz8ir379pvvn.htm/, Retrieved Sat, 27 Apr 2024 18:36:53 +0000
Statistical Computations at FreeStatistics.org, Office for Research Development and Education, URL https://freestatistics.org/blog/index.php?pk=75105, Retrieved Sat, 27 Apr 2024 18:36:53 +0000
QR Codes:

Original text written by user:
IsPrivate?No (this computation is public)
User-defined keywordsKDGP2W21
Estimated Impact145
Family? (F = Feedback message, R = changed R code, M = changed R Module, P = changed Parameters, D = changed Data)
-     [Mean Plot] [Katleen van den A...] [2010-04-23 13:13:26] [b39c10f74e49ba87352399c34734b08b]
-    D  [Mean Plot] [Katleen van den A...] [2010-04-26 14:36:04] [b39c10f74e49ba87352399c34734b08b]
- RMPD    [(Partial) Autocorrelation Function] [Katleen van den A...] [2010-05-01 10:30:39] [b39c10f74e49ba87352399c34734b08b]
-   PD        [(Partial) Autocorrelation Function] [Katleen van den A...] [2010-05-01 10:43:00] [8b7f9564fd63910ef0a86e3a376c4af8] [Current]
Feedback Forum

Post a new message
Dataseries X:
285708
905858
225733
405481
845758
805651
395747
695853
175625
405534
965639
575634
576023
566089
336141
26271
586226
376484
176583
287042
997142
207694
418003
838258
848182
658215
208304
398599
438399
578393
988390
958304
318251
78307
408520
748640
258520
518618
388588
238842
328957
499266
109011
168896
798921
878732
897576
518317
228370
758167
658491
518170
398212
498286
78136
647990
357927
698061
407932
637934
397784
217980
47737
467672
67651
167524
687406
367345
157553
887453
227566
817279
697059
997185
847075
547122
996977
346998
967154
547097
586853
46728
236883
36784
277085
446998
586725
496845
86765
146966
197113
657096
337200
17273
457284
507696
547628
157435
67793
267631
518397
918560
918895
429509
289569
9010172
1810617
7111400
1611919
9712714
2913310
1013816
6714518
2414721
9114534
8214993
6215159
515612
9415340
3715267


Summary of computational transaction
Raw Inputview raw input (R code)
Raw Outputview raw output of R engine
Computing time2 seconds
R Server'Sir Ronald Aylmer Fisher' @ 193.190.124.24

\begin{tabular}{lllllllll}
\hline
Summary of computational transaction \tabularnewline
Raw Input & view raw input (R code)  \tabularnewline
Raw Output & view raw output of R engine  \tabularnewline
Computing time & 2 seconds \tabularnewline
R Server & 'Sir Ronald Aylmer Fisher' @ 193.190.124.24 \tabularnewline
\hline
\end{tabular}
%Source: https://freestatistics.org/blog/index.php?pk=75105&T=0

[TABLE]
[ROW][C]Summary of computational transaction[/C][/ROW]
[ROW][C]Raw Input[/C][C]view raw input (R code) [/C][/ROW]
[ROW][C]Raw Output[/C][C]view raw output of R engine [/C][/ROW]
[ROW][C]Computing time[/C][C]2 seconds[/C][/ROW]
[ROW][C]R Server[/C][C]'Sir Ronald Aylmer Fisher' @ 193.190.124.24[/C][/ROW]
[/TABLE]
Source: https://freestatistics.org/blog/index.php?pk=75105&T=0

Globally Unique Identifier (entire table): ba.freestatistics.org/blog/index.php?pk=75105&T=0

As an alternative you can also use a QR Code:  

The GUIDs for individual cells are displayed in the table below:

Summary of computational transaction
Raw Inputview raw input (R code)
Raw Outputview raw output of R engine
Computing time2 seconds
R Server'Sir Ronald Aylmer Fisher' @ 193.190.124.24


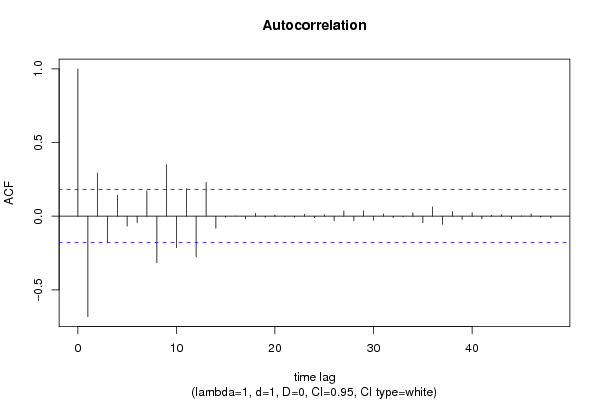
Autocorrelation Function
Time lag kACF(k)T-STATP-value
1-0.682471-7.44490
20.2937443.20440.000869
3-0.176184-1.92190.028502
40.1422081.55130.061742
5-0.066964-0.73050.233263
6-0.042765-0.46650.320852
70.1706491.86160.032566
8-0.317023-3.45830.000377
90.3492123.80950.000111
10-0.213667-2.33080.010723
110.1879212.050.021282
12-0.275351-3.00370.001626
130.2283832.49140.007052
14-0.081246-0.88630.188626
15-0.006667-0.07270.471074
160.0003690.0040.498396
17-0.017149-0.18710.42596
180.0191030.20840.417642
19-0.007486-0.08170.467526
200.0065660.07160.471511
21-0.004737-0.05170.479438
22-0.006498-0.07090.471803
230.0137890.15040.440345
24-0.010144-0.11070.456039
250.0103020.11240.455354
26-0.031542-0.34410.365694
270.0352760.38480.350531
28-0.031311-0.34160.366642
290.0355040.38730.34961
30-0.027676-0.30190.381624
310.0155540.16970.432776
32-0.008865-0.09670.461563
33-0.004413-0.04810.480842
340.0227220.24790.402333
35-0.044134-0.48140.315543
360.0631490.68890.246123
37-0.055163-0.60180.274241
380.032390.35330.362232
39-0.021744-0.23720.406455
400.0233350.25460.399752
41-0.017281-0.18850.425397
420.0059490.06490.474185
430.0118680.12950.448606
44-0.017614-0.19220.423976
45-0.00088-0.00960.496178
460.0141540.15440.438778
47-0.007286-0.07950.46839
48-0.011587-0.12640.449815

\begin{tabular}{lllllllll}
\hline
Autocorrelation Function \tabularnewline
Time lag k & ACF(k) & T-STAT & P-value \tabularnewline
1 & -0.682471 & -7.4449 & 0 \tabularnewline
2 & 0.293744 & 3.2044 & 0.000869 \tabularnewline
3 & -0.176184 & -1.9219 & 0.028502 \tabularnewline
4 & 0.142208 & 1.5513 & 0.061742 \tabularnewline
5 & -0.066964 & -0.7305 & 0.233263 \tabularnewline
6 & -0.042765 & -0.4665 & 0.320852 \tabularnewline
7 & 0.170649 & 1.8616 & 0.032566 \tabularnewline
8 & -0.317023 & -3.4583 & 0.000377 \tabularnewline
9 & 0.349212 & 3.8095 & 0.000111 \tabularnewline
10 & -0.213667 & -2.3308 & 0.010723 \tabularnewline
11 & 0.187921 & 2.05 & 0.021282 \tabularnewline
12 & -0.275351 & -3.0037 & 0.001626 \tabularnewline
13 & 0.228383 & 2.4914 & 0.007052 \tabularnewline
14 & -0.081246 & -0.8863 & 0.188626 \tabularnewline
15 & -0.006667 & -0.0727 & 0.471074 \tabularnewline
16 & 0.000369 & 0.004 & 0.498396 \tabularnewline
17 & -0.017149 & -0.1871 & 0.42596 \tabularnewline
18 & 0.019103 & 0.2084 & 0.417642 \tabularnewline
19 & -0.007486 & -0.0817 & 0.467526 \tabularnewline
20 & 0.006566 & 0.0716 & 0.471511 \tabularnewline
21 & -0.004737 & -0.0517 & 0.479438 \tabularnewline
22 & -0.006498 & -0.0709 & 0.471803 \tabularnewline
23 & 0.013789 & 0.1504 & 0.440345 \tabularnewline
24 & -0.010144 & -0.1107 & 0.456039 \tabularnewline
25 & 0.010302 & 0.1124 & 0.455354 \tabularnewline
26 & -0.031542 & -0.3441 & 0.365694 \tabularnewline
27 & 0.035276 & 0.3848 & 0.350531 \tabularnewline
28 & -0.031311 & -0.3416 & 0.366642 \tabularnewline
29 & 0.035504 & 0.3873 & 0.34961 \tabularnewline
30 & -0.027676 & -0.3019 & 0.381624 \tabularnewline
31 & 0.015554 & 0.1697 & 0.432776 \tabularnewline
32 & -0.008865 & -0.0967 & 0.461563 \tabularnewline
33 & -0.004413 & -0.0481 & 0.480842 \tabularnewline
34 & 0.022722 & 0.2479 & 0.402333 \tabularnewline
35 & -0.044134 & -0.4814 & 0.315543 \tabularnewline
36 & 0.063149 & 0.6889 & 0.246123 \tabularnewline
37 & -0.055163 & -0.6018 & 0.274241 \tabularnewline
38 & 0.03239 & 0.3533 & 0.362232 \tabularnewline
39 & -0.021744 & -0.2372 & 0.406455 \tabularnewline
40 & 0.023335 & 0.2546 & 0.399752 \tabularnewline
41 & -0.017281 & -0.1885 & 0.425397 \tabularnewline
42 & 0.005949 & 0.0649 & 0.474185 \tabularnewline
43 & 0.011868 & 0.1295 & 0.448606 \tabularnewline
44 & -0.017614 & -0.1922 & 0.423976 \tabularnewline
45 & -0.00088 & -0.0096 & 0.496178 \tabularnewline
46 & 0.014154 & 0.1544 & 0.438778 \tabularnewline
47 & -0.007286 & -0.0795 & 0.46839 \tabularnewline
48 & -0.011587 & -0.1264 & 0.449815 \tabularnewline
\hline
\end{tabular}
%Source: https://freestatistics.org/blog/index.php?pk=75105&T=1

[TABLE]
[ROW][C]Autocorrelation Function[/C][/ROW]
[ROW][C]Time lag k[/C][C]ACF(k)[/C][C]T-STAT[/C][C]P-value[/C][/ROW]
[ROW][C]1[/C][C]-0.682471[/C][C]-7.4449[/C][C]0[/C][/ROW]
[ROW][C]2[/C][C]0.293744[/C][C]3.2044[/C][C]0.000869[/C][/ROW]
[ROW][C]3[/C][C]-0.176184[/C][C]-1.9219[/C][C]0.028502[/C][/ROW]
[ROW][C]4[/C][C]0.142208[/C][C]1.5513[/C][C]0.061742[/C][/ROW]
[ROW][C]5[/C][C]-0.066964[/C][C]-0.7305[/C][C]0.233263[/C][/ROW]
[ROW][C]6[/C][C]-0.042765[/C][C]-0.4665[/C][C]0.320852[/C][/ROW]
[ROW][C]7[/C][C]0.170649[/C][C]1.8616[/C][C]0.032566[/C][/ROW]
[ROW][C]8[/C][C]-0.317023[/C][C]-3.4583[/C][C]0.000377[/C][/ROW]
[ROW][C]9[/C][C]0.349212[/C][C]3.8095[/C][C]0.000111[/C][/ROW]
[ROW][C]10[/C][C]-0.213667[/C][C]-2.3308[/C][C]0.010723[/C][/ROW]
[ROW][C]11[/C][C]0.187921[/C][C]2.05[/C][C]0.021282[/C][/ROW]
[ROW][C]12[/C][C]-0.275351[/C][C]-3.0037[/C][C]0.001626[/C][/ROW]
[ROW][C]13[/C][C]0.228383[/C][C]2.4914[/C][C]0.007052[/C][/ROW]
[ROW][C]14[/C][C]-0.081246[/C][C]-0.8863[/C][C]0.188626[/C][/ROW]
[ROW][C]15[/C][C]-0.006667[/C][C]-0.0727[/C][C]0.471074[/C][/ROW]
[ROW][C]16[/C][C]0.000369[/C][C]0.004[/C][C]0.498396[/C][/ROW]
[ROW][C]17[/C][C]-0.017149[/C][C]-0.1871[/C][C]0.42596[/C][/ROW]
[ROW][C]18[/C][C]0.019103[/C][C]0.2084[/C][C]0.417642[/C][/ROW]
[ROW][C]19[/C][C]-0.007486[/C][C]-0.0817[/C][C]0.467526[/C][/ROW]
[ROW][C]20[/C][C]0.006566[/C][C]0.0716[/C][C]0.471511[/C][/ROW]
[ROW][C]21[/C][C]-0.004737[/C][C]-0.0517[/C][C]0.479438[/C][/ROW]
[ROW][C]22[/C][C]-0.006498[/C][C]-0.0709[/C][C]0.471803[/C][/ROW]
[ROW][C]23[/C][C]0.013789[/C][C]0.1504[/C][C]0.440345[/C][/ROW]
[ROW][C]24[/C][C]-0.010144[/C][C]-0.1107[/C][C]0.456039[/C][/ROW]
[ROW][C]25[/C][C]0.010302[/C][C]0.1124[/C][C]0.455354[/C][/ROW]
[ROW][C]26[/C][C]-0.031542[/C][C]-0.3441[/C][C]0.365694[/C][/ROW]
[ROW][C]27[/C][C]0.035276[/C][C]0.3848[/C][C]0.350531[/C][/ROW]
[ROW][C]28[/C][C]-0.031311[/C][C]-0.3416[/C][C]0.366642[/C][/ROW]
[ROW][C]29[/C][C]0.035504[/C][C]0.3873[/C][C]0.34961[/C][/ROW]
[ROW][C]30[/C][C]-0.027676[/C][C]-0.3019[/C][C]0.381624[/C][/ROW]
[ROW][C]31[/C][C]0.015554[/C][C]0.1697[/C][C]0.432776[/C][/ROW]
[ROW][C]32[/C][C]-0.008865[/C][C]-0.0967[/C][C]0.461563[/C][/ROW]
[ROW][C]33[/C][C]-0.004413[/C][C]-0.0481[/C][C]0.480842[/C][/ROW]
[ROW][C]34[/C][C]0.022722[/C][C]0.2479[/C][C]0.402333[/C][/ROW]
[ROW][C]35[/C][C]-0.044134[/C][C]-0.4814[/C][C]0.315543[/C][/ROW]
[ROW][C]36[/C][C]0.063149[/C][C]0.6889[/C][C]0.246123[/C][/ROW]
[ROW][C]37[/C][C]-0.055163[/C][C]-0.6018[/C][C]0.274241[/C][/ROW]
[ROW][C]38[/C][C]0.03239[/C][C]0.3533[/C][C]0.362232[/C][/ROW]
[ROW][C]39[/C][C]-0.021744[/C][C]-0.2372[/C][C]0.406455[/C][/ROW]
[ROW][C]40[/C][C]0.023335[/C][C]0.2546[/C][C]0.399752[/C][/ROW]
[ROW][C]41[/C][C]-0.017281[/C][C]-0.1885[/C][C]0.425397[/C][/ROW]
[ROW][C]42[/C][C]0.005949[/C][C]0.0649[/C][C]0.474185[/C][/ROW]
[ROW][C]43[/C][C]0.011868[/C][C]0.1295[/C][C]0.448606[/C][/ROW]
[ROW][C]44[/C][C]-0.017614[/C][C]-0.1922[/C][C]0.423976[/C][/ROW]
[ROW][C]45[/C][C]-0.00088[/C][C]-0.0096[/C][C]0.496178[/C][/ROW]
[ROW][C]46[/C][C]0.014154[/C][C]0.1544[/C][C]0.438778[/C][/ROW]
[ROW][C]47[/C][C]-0.007286[/C][C]-0.0795[/C][C]0.46839[/C][/ROW]
[ROW][C]48[/C][C]-0.011587[/C][C]-0.1264[/C][C]0.449815[/C][/ROW]
[/TABLE]
Source: https://freestatistics.org/blog/index.php?pk=75105&T=1

Globally Unique Identifier (entire table): ba.freestatistics.org/blog/index.php?pk=75105&T=1

As an alternative you can also use a QR Code:  

The GUIDs for individual cells are displayed in the table below:

Autocorrelation Function
Time lag kACF(k)T-STATP-value
1-0.682471-7.44490
20.2937443.20440.000869
3-0.176184-1.92190.028502
40.1422081.55130.061742
5-0.066964-0.73050.233263
6-0.042765-0.46650.320852
70.1706491.86160.032566
8-0.317023-3.45830.000377
90.3492123.80950.000111
10-0.213667-2.33080.010723
110.1879212.050.021282
12-0.275351-3.00370.001626
130.2283832.49140.007052
14-0.081246-0.88630.188626
15-0.006667-0.07270.471074
160.0003690.0040.498396
17-0.017149-0.18710.42596
180.0191030.20840.417642
19-0.007486-0.08170.467526
200.0065660.07160.471511
21-0.004737-0.05170.479438
22-0.006498-0.07090.471803
230.0137890.15040.440345
24-0.010144-0.11070.456039
250.0103020.11240.455354
26-0.031542-0.34410.365694
270.0352760.38480.350531
28-0.031311-0.34160.366642
290.0355040.38730.34961
30-0.027676-0.30190.381624
310.0155540.16970.432776
32-0.008865-0.09670.461563
33-0.004413-0.04810.480842
340.0227220.24790.402333
35-0.044134-0.48140.315543
360.0631490.68890.246123
37-0.055163-0.60180.274241
380.032390.35330.362232
39-0.021744-0.23720.406455
400.0233350.25460.399752
41-0.017281-0.18850.425397
420.0059490.06490.474185
430.0118680.12950.448606
44-0.017614-0.19220.423976
45-0.00088-0.00960.496178
460.0141540.15440.438778
47-0.007286-0.07950.46839
48-0.011587-0.12640.449815


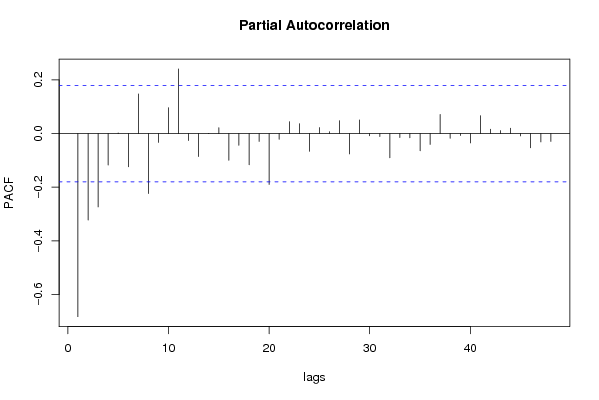
Partial Autocorrelation Function
Time lag kPACF(k)T-STATP-value
1-0.682471-7.44490
2-0.321999-3.51260.000314
3-0.273399-2.98240.001735
4-0.116925-1.27550.102308
50.0023420.02560.489829
6-0.123729-1.34970.089834
70.1475741.60980.055041
8-0.223164-2.43440.0082
9-0.032759-0.35740.360729
100.0968061.0560.146547
110.2410182.62920.004844
12-0.025985-0.28350.388656
13-0.085202-0.92940.17727
14-9e-04-0.00980.49609
150.0216760.23650.406743
16-0.099373-1.0840.140271
17-0.043845-0.47830.31666
18-0.116514-1.2710.1031
19-0.029122-0.31770.375639
20-0.189539-2.06760.020422
21-0.021428-0.23380.407789
220.0445050.48550.314109
230.0366630.39990.344956
24-0.066041-0.72040.236337
250.0224040.24440.40367
260.0072750.07940.468439
270.0480860.52460.300433
28-0.07578-0.82670.205042
290.050690.5530.290665
30-0.007865-0.08580.465888
31-0.010777-0.11760.453306
32-0.090005-0.98180.164086
33-0.01448-0.1580.437378
34-0.015273-0.16660.433979
35-0.06433-0.70180.242101
36-0.040373-0.44040.330216
370.0712540.77730.219266
38-0.017526-0.19120.424353
39-0.00712-0.07770.469111
40-0.034756-0.37910.352629
410.0669420.73020.233337
420.0160050.17460.430848
430.011120.12130.451825
440.0197570.21550.414863
45-0.008524-0.0930.463034
46-0.052963-0.57780.28226
47-0.031-0.33820.367917
48-0.029051-0.31690.375934

\begin{tabular}{lllllllll}
\hline
Partial Autocorrelation Function \tabularnewline
Time lag k & PACF(k) & T-STAT & P-value \tabularnewline
1 & -0.682471 & -7.4449 & 0 \tabularnewline
2 & -0.321999 & -3.5126 & 0.000314 \tabularnewline
3 & -0.273399 & -2.9824 & 0.001735 \tabularnewline
4 & -0.116925 & -1.2755 & 0.102308 \tabularnewline
5 & 0.002342 & 0.0256 & 0.489829 \tabularnewline
6 & -0.123729 & -1.3497 & 0.089834 \tabularnewline
7 & 0.147574 & 1.6098 & 0.055041 \tabularnewline
8 & -0.223164 & -2.4344 & 0.0082 \tabularnewline
9 & -0.032759 & -0.3574 & 0.360729 \tabularnewline
10 & 0.096806 & 1.056 & 0.146547 \tabularnewline
11 & 0.241018 & 2.6292 & 0.004844 \tabularnewline
12 & -0.025985 & -0.2835 & 0.388656 \tabularnewline
13 & -0.085202 & -0.9294 & 0.17727 \tabularnewline
14 & -9e-04 & -0.0098 & 0.49609 \tabularnewline
15 & 0.021676 & 0.2365 & 0.406743 \tabularnewline
16 & -0.099373 & -1.084 & 0.140271 \tabularnewline
17 & -0.043845 & -0.4783 & 0.31666 \tabularnewline
18 & -0.116514 & -1.271 & 0.1031 \tabularnewline
19 & -0.029122 & -0.3177 & 0.375639 \tabularnewline
20 & -0.189539 & -2.0676 & 0.020422 \tabularnewline
21 & -0.021428 & -0.2338 & 0.407789 \tabularnewline
22 & 0.044505 & 0.4855 & 0.314109 \tabularnewline
23 & 0.036663 & 0.3999 & 0.344956 \tabularnewline
24 & -0.066041 & -0.7204 & 0.236337 \tabularnewline
25 & 0.022404 & 0.2444 & 0.40367 \tabularnewline
26 & 0.007275 & 0.0794 & 0.468439 \tabularnewline
27 & 0.048086 & 0.5246 & 0.300433 \tabularnewline
28 & -0.07578 & -0.8267 & 0.205042 \tabularnewline
29 & 0.05069 & 0.553 & 0.290665 \tabularnewline
30 & -0.007865 & -0.0858 & 0.465888 \tabularnewline
31 & -0.010777 & -0.1176 & 0.453306 \tabularnewline
32 & -0.090005 & -0.9818 & 0.164086 \tabularnewline
33 & -0.01448 & -0.158 & 0.437378 \tabularnewline
34 & -0.015273 & -0.1666 & 0.433979 \tabularnewline
35 & -0.06433 & -0.7018 & 0.242101 \tabularnewline
36 & -0.040373 & -0.4404 & 0.330216 \tabularnewline
37 & 0.071254 & 0.7773 & 0.219266 \tabularnewline
38 & -0.017526 & -0.1912 & 0.424353 \tabularnewline
39 & -0.00712 & -0.0777 & 0.469111 \tabularnewline
40 & -0.034756 & -0.3791 & 0.352629 \tabularnewline
41 & 0.066942 & 0.7302 & 0.233337 \tabularnewline
42 & 0.016005 & 0.1746 & 0.430848 \tabularnewline
43 & 0.01112 & 0.1213 & 0.451825 \tabularnewline
44 & 0.019757 & 0.2155 & 0.414863 \tabularnewline
45 & -0.008524 & -0.093 & 0.463034 \tabularnewline
46 & -0.052963 & -0.5778 & 0.28226 \tabularnewline
47 & -0.031 & -0.3382 & 0.367917 \tabularnewline
48 & -0.029051 & -0.3169 & 0.375934 \tabularnewline
\hline
\end{tabular}
%Source: https://freestatistics.org/blog/index.php?pk=75105&T=2

[TABLE]
[ROW][C]Partial Autocorrelation Function[/C][/ROW]
[ROW][C]Time lag k[/C][C]PACF(k)[/C][C]T-STAT[/C][C]P-value[/C][/ROW]
[ROW][C]1[/C][C]-0.682471[/C][C]-7.4449[/C][C]0[/C][/ROW]
[ROW][C]2[/C][C]-0.321999[/C][C]-3.5126[/C][C]0.000314[/C][/ROW]
[ROW][C]3[/C][C]-0.273399[/C][C]-2.9824[/C][C]0.001735[/C][/ROW]
[ROW][C]4[/C][C]-0.116925[/C][C]-1.2755[/C][C]0.102308[/C][/ROW]
[ROW][C]5[/C][C]0.002342[/C][C]0.0256[/C][C]0.489829[/C][/ROW]
[ROW][C]6[/C][C]-0.123729[/C][C]-1.3497[/C][C]0.089834[/C][/ROW]
[ROW][C]7[/C][C]0.147574[/C][C]1.6098[/C][C]0.055041[/C][/ROW]
[ROW][C]8[/C][C]-0.223164[/C][C]-2.4344[/C][C]0.0082[/C][/ROW]
[ROW][C]9[/C][C]-0.032759[/C][C]-0.3574[/C][C]0.360729[/C][/ROW]
[ROW][C]10[/C][C]0.096806[/C][C]1.056[/C][C]0.146547[/C][/ROW]
[ROW][C]11[/C][C]0.241018[/C][C]2.6292[/C][C]0.004844[/C][/ROW]
[ROW][C]12[/C][C]-0.025985[/C][C]-0.2835[/C][C]0.388656[/C][/ROW]
[ROW][C]13[/C][C]-0.085202[/C][C]-0.9294[/C][C]0.17727[/C][/ROW]
[ROW][C]14[/C][C]-9e-04[/C][C]-0.0098[/C][C]0.49609[/C][/ROW]
[ROW][C]15[/C][C]0.021676[/C][C]0.2365[/C][C]0.406743[/C][/ROW]
[ROW][C]16[/C][C]-0.099373[/C][C]-1.084[/C][C]0.140271[/C][/ROW]
[ROW][C]17[/C][C]-0.043845[/C][C]-0.4783[/C][C]0.31666[/C][/ROW]
[ROW][C]18[/C][C]-0.116514[/C][C]-1.271[/C][C]0.1031[/C][/ROW]
[ROW][C]19[/C][C]-0.029122[/C][C]-0.3177[/C][C]0.375639[/C][/ROW]
[ROW][C]20[/C][C]-0.189539[/C][C]-2.0676[/C][C]0.020422[/C][/ROW]
[ROW][C]21[/C][C]-0.021428[/C][C]-0.2338[/C][C]0.407789[/C][/ROW]
[ROW][C]22[/C][C]0.044505[/C][C]0.4855[/C][C]0.314109[/C][/ROW]
[ROW][C]23[/C][C]0.036663[/C][C]0.3999[/C][C]0.344956[/C][/ROW]
[ROW][C]24[/C][C]-0.066041[/C][C]-0.7204[/C][C]0.236337[/C][/ROW]
[ROW][C]25[/C][C]0.022404[/C][C]0.2444[/C][C]0.40367[/C][/ROW]
[ROW][C]26[/C][C]0.007275[/C][C]0.0794[/C][C]0.468439[/C][/ROW]
[ROW][C]27[/C][C]0.048086[/C][C]0.5246[/C][C]0.300433[/C][/ROW]
[ROW][C]28[/C][C]-0.07578[/C][C]-0.8267[/C][C]0.205042[/C][/ROW]
[ROW][C]29[/C][C]0.05069[/C][C]0.553[/C][C]0.290665[/C][/ROW]
[ROW][C]30[/C][C]-0.007865[/C][C]-0.0858[/C][C]0.465888[/C][/ROW]
[ROW][C]31[/C][C]-0.010777[/C][C]-0.1176[/C][C]0.453306[/C][/ROW]
[ROW][C]32[/C][C]-0.090005[/C][C]-0.9818[/C][C]0.164086[/C][/ROW]
[ROW][C]33[/C][C]-0.01448[/C][C]-0.158[/C][C]0.437378[/C][/ROW]
[ROW][C]34[/C][C]-0.015273[/C][C]-0.1666[/C][C]0.433979[/C][/ROW]
[ROW][C]35[/C][C]-0.06433[/C][C]-0.7018[/C][C]0.242101[/C][/ROW]
[ROW][C]36[/C][C]-0.040373[/C][C]-0.4404[/C][C]0.330216[/C][/ROW]
[ROW][C]37[/C][C]0.071254[/C][C]0.7773[/C][C]0.219266[/C][/ROW]
[ROW][C]38[/C][C]-0.017526[/C][C]-0.1912[/C][C]0.424353[/C][/ROW]
[ROW][C]39[/C][C]-0.00712[/C][C]-0.0777[/C][C]0.469111[/C][/ROW]
[ROW][C]40[/C][C]-0.034756[/C][C]-0.3791[/C][C]0.352629[/C][/ROW]
[ROW][C]41[/C][C]0.066942[/C][C]0.7302[/C][C]0.233337[/C][/ROW]
[ROW][C]42[/C][C]0.016005[/C][C]0.1746[/C][C]0.430848[/C][/ROW]
[ROW][C]43[/C][C]0.01112[/C][C]0.1213[/C][C]0.451825[/C][/ROW]
[ROW][C]44[/C][C]0.019757[/C][C]0.2155[/C][C]0.414863[/C][/ROW]
[ROW][C]45[/C][C]-0.008524[/C][C]-0.093[/C][C]0.463034[/C][/ROW]
[ROW][C]46[/C][C]-0.052963[/C][C]-0.5778[/C][C]0.28226[/C][/ROW]
[ROW][C]47[/C][C]-0.031[/C][C]-0.3382[/C][C]0.367917[/C][/ROW]
[ROW][C]48[/C][C]-0.029051[/C][C]-0.3169[/C][C]0.375934[/C][/ROW]
[/TABLE]
Source: https://freestatistics.org/blog/index.php?pk=75105&T=2

Globally Unique Identifier (entire table): ba.freestatistics.org/blog/index.php?pk=75105&T=2

As an alternative you can also use a QR Code:  

The GUIDs for individual cells are displayed in the table below:

Partial Autocorrelation Function
Time lag kPACF(k)T-STATP-value
1-0.682471-7.44490
2-0.321999-3.51260.000314
3-0.273399-2.98240.001735
4-0.116925-1.27550.102308
50.0023420.02560.489829
6-0.123729-1.34970.089834
70.1475741.60980.055041
8-0.223164-2.43440.0082
9-0.032759-0.35740.360729
100.0968061.0560.146547
110.2410182.62920.004844
12-0.025985-0.28350.388656
13-0.085202-0.92940.17727
14-9e-04-0.00980.49609
150.0216760.23650.406743
16-0.099373-1.0840.140271
17-0.043845-0.47830.31666
18-0.116514-1.2710.1031
19-0.029122-0.31770.375639
20-0.189539-2.06760.020422
21-0.021428-0.23380.407789
220.0445050.48550.314109
230.0366630.39990.344956
24-0.066041-0.72040.236337
250.0224040.24440.40367
260.0072750.07940.468439
270.0480860.52460.300433
28-0.07578-0.82670.205042
290.050690.5530.290665
30-0.007865-0.08580.465888
31-0.010777-0.11760.453306
32-0.090005-0.98180.164086
33-0.01448-0.1580.437378
34-0.015273-0.16660.433979
35-0.06433-0.70180.242101
36-0.040373-0.44040.330216
370.0712540.77730.219266
38-0.017526-0.19120.424353
39-0.00712-0.07770.469111
40-0.034756-0.37910.352629
410.0669420.73020.233337
420.0160050.17460.430848
430.011120.12130.451825
440.0197570.21550.414863
45-0.008524-0.0930.463034
46-0.052963-0.57780.28226
47-0.031-0.33820.367917
48-0.029051-0.31690.375934


Parameters (Session):
par1 = 48 ; par2 = 1 ; par3 = 1 ; par4 = 0 ; par5 = 12 ; par6 = White Noise ; par7 = 0.95 ;
Parameters (R input):
par1 = 48 ; par2 = 1 ; par3 = 1 ; par4 = 0 ; par5 = 12 ; par6 = White Noise ; par7 = 0.95 ;
R code (references can be found in the software module):
if (par1 == 'Default') {
par1 = 10*log10(length(x))
} else {
par1 <- as.numeric(par1)
}
par2 <- as.numeric(par2)
par3 <- as.numeric(par3)
par4 <- as.numeric(par4)
par5 <- as.numeric(par5)
if (par6 == 'White Noise') par6 <- 'white' else par6 <- 'ma'
par7 <- as.numeric(par7)
if (par2 == 0) {
x <- log(x)
} else {
x <- (x ^ par2 - 1) / par2
}
if (par3 > 0) x <- diff(x,lag=1,difference=par3)
if (par4 > 0) x <- diff(x,lag=par5,difference=par4)
bitmap(file='pic1.png')
racf <- acf(x, par1, main='Autocorrelation', xlab='time lag', ylab='ACF', ci.type=par6, ci=par7, sub=paste('(lambda=',par2,', d=',par3,', D=',par4,', CI=', par7, ', CI type=',par6,')',sep=''))
dev.off()
bitmap(file='pic2.png')
rpacf <- pacf(x,par1,main='Partial Autocorrelation',xlab='lags',ylab='PACF')
dev.off()
(myacf <- c(racf$acf))
(mypacf <- c(rpacf$acf))
lengthx <- length(x)
sqrtn <- sqrt(lengthx)
load(file='createtable')
a<-table.start()
a<-table.row.start(a)
a<-table.element(a,'Autocorrelation Function',4,TRUE)
a<-table.row.end(a)
a<-table.row.start(a)
a<-table.element(a,'Time lag k',header=TRUE)
a<-table.element(a,hyperlink('basics.htm','ACF(k)','click here for more information about the Autocorrelation Function'),header=TRUE)
a<-table.element(a,'T-STAT',header=TRUE)
a<-table.element(a,'P-value',header=TRUE)
a<-table.row.end(a)
for (i in 2:(par1+1)) {
a<-table.row.start(a)
a<-table.element(a,i-1,header=TRUE)
a<-table.element(a,round(myacf[i],6))
mytstat <- myacf[i]*sqrtn
a<-table.element(a,round(mytstat,4))
a<-table.element(a,round(1-pt(abs(mytstat),lengthx),6))
a<-table.row.end(a)
}
a<-table.end(a)
table.save(a,file='mytable.tab')
a<-table.start()
a<-table.row.start(a)
a<-table.element(a,'Partial Autocorrelation Function',4,TRUE)
a<-table.row.end(a)
a<-table.row.start(a)
a<-table.element(a,'Time lag k',header=TRUE)
a<-table.element(a,hyperlink('basics.htm','PACF(k)','click here for more information about the Partial Autocorrelation Function'),header=TRUE)
a<-table.element(a,'T-STAT',header=TRUE)
a<-table.element(a,'P-value',header=TRUE)
a<-table.row.end(a)
for (i in 1:par1) {
a<-table.row.start(a)
a<-table.element(a,i,header=TRUE)
a<-table.element(a,round(mypacf[i],6))
mytstat <- mypacf[i]*sqrtn
a<-table.element(a,round(mytstat,4))
a<-table.element(a,round(1-pt(abs(mytstat),lengthx),6))
a<-table.row.end(a)
}
a<-table.end(a)
table.save(a,file='mytable1.tab')