Free Statistics

of Irreproducible Research!

Author's title

Author*Unverified author*
R Software Modulerwasp_autocorrelation.wasp
Title produced by software(Partial) Autocorrelation Function
Date of computationSat, 01 May 2010 07:36:55 +0000
Cite this page as followsStatistical Computations at FreeStatistics.org, Office for Research Development and Education, URL https://freestatistics.org/blog/index.php?v=date/2010/May/01/t1272699512phzj21l27qzjd1n.htm/, Retrieved Sun, 28 Apr 2024 14:42:47 +0000
Statistical Computations at FreeStatistics.org, Office for Research Development and Education, URL https://freestatistics.org/blog/index.php?pk=75087, Retrieved Sun, 28 Apr 2024 14:42:47 +0000
QR Codes:

Original text written by user:
IsPrivate?No (this computation is public)
User-defined keywordsKdGP2W21
Estimated Impact144
Family? (F = Feedback message, R = changed R code, M = changed R Module, P = changed Parameters, D = changed Data)
-       [(Partial) Autocorrelation Function] [Werkloosheid 20-2...] [2010-05-01 07:36:55] [4942f64bbdc4cce21b299a740a533758] [Current]
Feedback Forum

Post a new message
Dataseries X:
43657
42811
45419
50846
54500
51035
38675
36214
38763
39486
40540
40719
40471
39947
42683
47090
51520
48823
36122
33812
36928
37737
40123
41713
42025
42169
46352
50939
56139
52713
38532
37860
40880
41988
44576
46728
46913
49357
54709
60819
63695
60109
45544
43596
44431
45575
47980
49211
51374
52954
57529
62960
64530
61008
44964
43480
45429
47616
49364
51010
53188
55317
60106
65845
67028
63617
47605
45844
47925
50156
52258
53476
54327
55214
59347
64718
66208
62744
45587
43684
45676
47088
48907
50964
51798


Summary of computational transaction
Raw Inputview raw input (R code)
Raw Outputview raw output of R engine
Computing time2 seconds
R Server'RServer@AstonUniversity' @ vre.aston.ac.uk

\begin{tabular}{lllllllll}
\hline
Summary of computational transaction \tabularnewline
Raw Input & view raw input (R code)  \tabularnewline
Raw Output & view raw output of R engine  \tabularnewline
Computing time & 2 seconds \tabularnewline
R Server & 'RServer@AstonUniversity' @ vre.aston.ac.uk \tabularnewline
\hline
\end{tabular}
%Source: https://freestatistics.org/blog/index.php?pk=75087&T=0

[TABLE]
[ROW][C]Summary of computational transaction[/C][/ROW]
[ROW][C]Raw Input[/C][C]view raw input (R code) [/C][/ROW]
[ROW][C]Raw Output[/C][C]view raw output of R engine [/C][/ROW]
[ROW][C]Computing time[/C][C]2 seconds[/C][/ROW]
[ROW][C]R Server[/C][C]'RServer@AstonUniversity' @ vre.aston.ac.uk[/C][/ROW]
[/TABLE]
Source: https://freestatistics.org/blog/index.php?pk=75087&T=0

Globally Unique Identifier (entire table): ba.freestatistics.org/blog/index.php?pk=75087&T=0

As an alternative you can also use a QR Code:  

The GUIDs for individual cells are displayed in the table below:

Summary of computational transaction
Raw Inputview raw input (R code)
Raw Outputview raw output of R engine
Computing time2 seconds
R Server'RServer@AstonUniversity' @ vre.aston.ac.uk


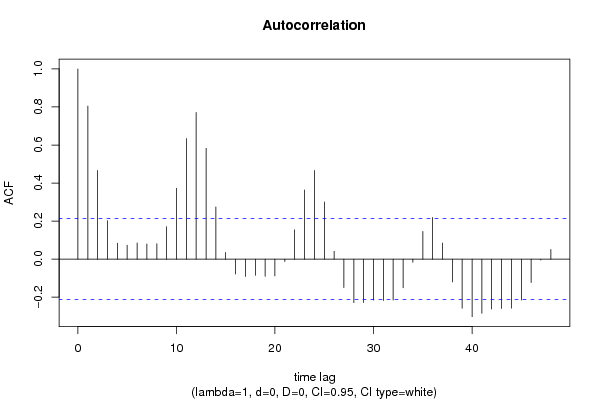
Autocorrelation Function
Time lag kACF(k)T-STATP-value
10.8046817.41880
20.4659554.29592.3e-05
30.2024381.86640.032718
40.0832630.76770.222411
50.073550.67810.249777
60.0852680.78610.216989
70.0800110.73770.231376
80.0812850.74940.227839
90.1701131.56840.060256
100.3725983.43520.000459
110.6337285.84270
120.7707217.10570
130.582485.37020
140.2744682.53050.006617
150.0349780.32250.373939
16-0.077873-0.7180.237376
17-0.091889-0.84720.199638
18-0.084446-0.77860.219201
19-0.089764-0.82760.205112
20-0.088165-0.81280.20929
21-0.012633-0.11650.453777
220.1539721.41950.079698
230.3636573.35270.000598
240.4662064.29822.3e-05
250.3003572.76920.00345
260.0409670.37770.353299
27-0.14909-1.37450.086443
28-0.228695-2.10850.018967
29-0.227669-2.0990.019391
30-0.215034-1.98250.025326
31-0.217822-2.00820.023897
32-0.214703-1.97950.0255
33-0.150321-1.38590.084703
34-0.016705-0.1540.438982
350.1450411.33720.092361
360.2192032.02090.023216
370.0842330.77660.219777
38-0.119816-1.10460.136215
39-0.258374-2.38210.009723
40-0.302408-2.78810.003271
41-0.284914-2.62680.005112
42-0.262296-2.41830.008865
43-0.259373-2.39130.009498
44-0.257841-2.37720.009845
45-0.21538-1.98570.025145
46-0.122942-1.13350.130102
47-0.005163-0.04760.481072
480.050560.46610.321155

\begin{tabular}{lllllllll}
\hline
Autocorrelation Function \tabularnewline
Time lag k & ACF(k) & T-STAT & P-value \tabularnewline
1 & 0.804681 & 7.4188 & 0 \tabularnewline
2 & 0.465955 & 4.2959 & 2.3e-05 \tabularnewline
3 & 0.202438 & 1.8664 & 0.032718 \tabularnewline
4 & 0.083263 & 0.7677 & 0.222411 \tabularnewline
5 & 0.07355 & 0.6781 & 0.249777 \tabularnewline
6 & 0.085268 & 0.7861 & 0.216989 \tabularnewline
7 & 0.080011 & 0.7377 & 0.231376 \tabularnewline
8 & 0.081285 & 0.7494 & 0.227839 \tabularnewline
9 & 0.170113 & 1.5684 & 0.060256 \tabularnewline
10 & 0.372598 & 3.4352 & 0.000459 \tabularnewline
11 & 0.633728 & 5.8427 & 0 \tabularnewline
12 & 0.770721 & 7.1057 & 0 \tabularnewline
13 & 0.58248 & 5.3702 & 0 \tabularnewline
14 & 0.274468 & 2.5305 & 0.006617 \tabularnewline
15 & 0.034978 & 0.3225 & 0.373939 \tabularnewline
16 & -0.077873 & -0.718 & 0.237376 \tabularnewline
17 & -0.091889 & -0.8472 & 0.199638 \tabularnewline
18 & -0.084446 & -0.7786 & 0.219201 \tabularnewline
19 & -0.089764 & -0.8276 & 0.205112 \tabularnewline
20 & -0.088165 & -0.8128 & 0.20929 \tabularnewline
21 & -0.012633 & -0.1165 & 0.453777 \tabularnewline
22 & 0.153972 & 1.4195 & 0.079698 \tabularnewline
23 & 0.363657 & 3.3527 & 0.000598 \tabularnewline
24 & 0.466206 & 4.2982 & 2.3e-05 \tabularnewline
25 & 0.300357 & 2.7692 & 0.00345 \tabularnewline
26 & 0.040967 & 0.3777 & 0.353299 \tabularnewline
27 & -0.14909 & -1.3745 & 0.086443 \tabularnewline
28 & -0.228695 & -2.1085 & 0.018967 \tabularnewline
29 & -0.227669 & -2.099 & 0.019391 \tabularnewline
30 & -0.215034 & -1.9825 & 0.025326 \tabularnewline
31 & -0.217822 & -2.0082 & 0.023897 \tabularnewline
32 & -0.214703 & -1.9795 & 0.0255 \tabularnewline
33 & -0.150321 & -1.3859 & 0.084703 \tabularnewline
34 & -0.016705 & -0.154 & 0.438982 \tabularnewline
35 & 0.145041 & 1.3372 & 0.092361 \tabularnewline
36 & 0.219203 & 2.0209 & 0.023216 \tabularnewline
37 & 0.084233 & 0.7766 & 0.219777 \tabularnewline
38 & -0.119816 & -1.1046 & 0.136215 \tabularnewline
39 & -0.258374 & -2.3821 & 0.009723 \tabularnewline
40 & -0.302408 & -2.7881 & 0.003271 \tabularnewline
41 & -0.284914 & -2.6268 & 0.005112 \tabularnewline
42 & -0.262296 & -2.4183 & 0.008865 \tabularnewline
43 & -0.259373 & -2.3913 & 0.009498 \tabularnewline
44 & -0.257841 & -2.3772 & 0.009845 \tabularnewline
45 & -0.21538 & -1.9857 & 0.025145 \tabularnewline
46 & -0.122942 & -1.1335 & 0.130102 \tabularnewline
47 & -0.005163 & -0.0476 & 0.481072 \tabularnewline
48 & 0.05056 & 0.4661 & 0.321155 \tabularnewline
\hline
\end{tabular}
%Source: https://freestatistics.org/blog/index.php?pk=75087&T=1

[TABLE]
[ROW][C]Autocorrelation Function[/C][/ROW]
[ROW][C]Time lag k[/C][C]ACF(k)[/C][C]T-STAT[/C][C]P-value[/C][/ROW]
[ROW][C]1[/C][C]0.804681[/C][C]7.4188[/C][C]0[/C][/ROW]
[ROW][C]2[/C][C]0.465955[/C][C]4.2959[/C][C]2.3e-05[/C][/ROW]
[ROW][C]3[/C][C]0.202438[/C][C]1.8664[/C][C]0.032718[/C][/ROW]
[ROW][C]4[/C][C]0.083263[/C][C]0.7677[/C][C]0.222411[/C][/ROW]
[ROW][C]5[/C][C]0.07355[/C][C]0.6781[/C][C]0.249777[/C][/ROW]
[ROW][C]6[/C][C]0.085268[/C][C]0.7861[/C][C]0.216989[/C][/ROW]
[ROW][C]7[/C][C]0.080011[/C][C]0.7377[/C][C]0.231376[/C][/ROW]
[ROW][C]8[/C][C]0.081285[/C][C]0.7494[/C][C]0.227839[/C][/ROW]
[ROW][C]9[/C][C]0.170113[/C][C]1.5684[/C][C]0.060256[/C][/ROW]
[ROW][C]10[/C][C]0.372598[/C][C]3.4352[/C][C]0.000459[/C][/ROW]
[ROW][C]11[/C][C]0.633728[/C][C]5.8427[/C][C]0[/C][/ROW]
[ROW][C]12[/C][C]0.770721[/C][C]7.1057[/C][C]0[/C][/ROW]
[ROW][C]13[/C][C]0.58248[/C][C]5.3702[/C][C]0[/C][/ROW]
[ROW][C]14[/C][C]0.274468[/C][C]2.5305[/C][C]0.006617[/C][/ROW]
[ROW][C]15[/C][C]0.034978[/C][C]0.3225[/C][C]0.373939[/C][/ROW]
[ROW][C]16[/C][C]-0.077873[/C][C]-0.718[/C][C]0.237376[/C][/ROW]
[ROW][C]17[/C][C]-0.091889[/C][C]-0.8472[/C][C]0.199638[/C][/ROW]
[ROW][C]18[/C][C]-0.084446[/C][C]-0.7786[/C][C]0.219201[/C][/ROW]
[ROW][C]19[/C][C]-0.089764[/C][C]-0.8276[/C][C]0.205112[/C][/ROW]
[ROW][C]20[/C][C]-0.088165[/C][C]-0.8128[/C][C]0.20929[/C][/ROW]
[ROW][C]21[/C][C]-0.012633[/C][C]-0.1165[/C][C]0.453777[/C][/ROW]
[ROW][C]22[/C][C]0.153972[/C][C]1.4195[/C][C]0.079698[/C][/ROW]
[ROW][C]23[/C][C]0.363657[/C][C]3.3527[/C][C]0.000598[/C][/ROW]
[ROW][C]24[/C][C]0.466206[/C][C]4.2982[/C][C]2.3e-05[/C][/ROW]
[ROW][C]25[/C][C]0.300357[/C][C]2.7692[/C][C]0.00345[/C][/ROW]
[ROW][C]26[/C][C]0.040967[/C][C]0.3777[/C][C]0.353299[/C][/ROW]
[ROW][C]27[/C][C]-0.14909[/C][C]-1.3745[/C][C]0.086443[/C][/ROW]
[ROW][C]28[/C][C]-0.228695[/C][C]-2.1085[/C][C]0.018967[/C][/ROW]
[ROW][C]29[/C][C]-0.227669[/C][C]-2.099[/C][C]0.019391[/C][/ROW]
[ROW][C]30[/C][C]-0.215034[/C][C]-1.9825[/C][C]0.025326[/C][/ROW]
[ROW][C]31[/C][C]-0.217822[/C][C]-2.0082[/C][C]0.023897[/C][/ROW]
[ROW][C]32[/C][C]-0.214703[/C][C]-1.9795[/C][C]0.0255[/C][/ROW]
[ROW][C]33[/C][C]-0.150321[/C][C]-1.3859[/C][C]0.084703[/C][/ROW]
[ROW][C]34[/C][C]-0.016705[/C][C]-0.154[/C][C]0.438982[/C][/ROW]
[ROW][C]35[/C][C]0.145041[/C][C]1.3372[/C][C]0.092361[/C][/ROW]
[ROW][C]36[/C][C]0.219203[/C][C]2.0209[/C][C]0.023216[/C][/ROW]
[ROW][C]37[/C][C]0.084233[/C][C]0.7766[/C][C]0.219777[/C][/ROW]
[ROW][C]38[/C][C]-0.119816[/C][C]-1.1046[/C][C]0.136215[/C][/ROW]
[ROW][C]39[/C][C]-0.258374[/C][C]-2.3821[/C][C]0.009723[/C][/ROW]
[ROW][C]40[/C][C]-0.302408[/C][C]-2.7881[/C][C]0.003271[/C][/ROW]
[ROW][C]41[/C][C]-0.284914[/C][C]-2.6268[/C][C]0.005112[/C][/ROW]
[ROW][C]42[/C][C]-0.262296[/C][C]-2.4183[/C][C]0.008865[/C][/ROW]
[ROW][C]43[/C][C]-0.259373[/C][C]-2.3913[/C][C]0.009498[/C][/ROW]
[ROW][C]44[/C][C]-0.257841[/C][C]-2.3772[/C][C]0.009845[/C][/ROW]
[ROW][C]45[/C][C]-0.21538[/C][C]-1.9857[/C][C]0.025145[/C][/ROW]
[ROW][C]46[/C][C]-0.122942[/C][C]-1.1335[/C][C]0.130102[/C][/ROW]
[ROW][C]47[/C][C]-0.005163[/C][C]-0.0476[/C][C]0.481072[/C][/ROW]
[ROW][C]48[/C][C]0.05056[/C][C]0.4661[/C][C]0.321155[/C][/ROW]
[/TABLE]
Source: https://freestatistics.org/blog/index.php?pk=75087&T=1

Globally Unique Identifier (entire table): ba.freestatistics.org/blog/index.php?pk=75087&T=1

As an alternative you can also use a QR Code:  

The GUIDs for individual cells are displayed in the table below:

Autocorrelation Function
Time lag kACF(k)T-STATP-value
10.8046817.41880
20.4659554.29592.3e-05
30.2024381.86640.032718
40.0832630.76770.222411
50.073550.67810.249777
60.0852680.78610.216989
70.0800110.73770.231376
80.0812850.74940.227839
90.1701131.56840.060256
100.3725983.43520.000459
110.6337285.84270
120.7707217.10570
130.582485.37020
140.2744682.53050.006617
150.0349780.32250.373939
16-0.077873-0.7180.237376
17-0.091889-0.84720.199638
18-0.084446-0.77860.219201
19-0.089764-0.82760.205112
20-0.088165-0.81280.20929
21-0.012633-0.11650.453777
220.1539721.41950.079698
230.3636573.35270.000598
240.4662064.29822.3e-05
250.3003572.76920.00345
260.0409670.37770.353299
27-0.14909-1.37450.086443
28-0.228695-2.10850.018967
29-0.227669-2.0990.019391
30-0.215034-1.98250.025326
31-0.217822-2.00820.023897
32-0.214703-1.97950.0255
33-0.150321-1.38590.084703
34-0.016705-0.1540.438982
350.1450411.33720.092361
360.2192032.02090.023216
370.0842330.77660.219777
38-0.119816-1.10460.136215
39-0.258374-2.38210.009723
40-0.302408-2.78810.003271
41-0.284914-2.62680.005112
42-0.262296-2.41830.008865
43-0.259373-2.39130.009498
44-0.257841-2.37720.009845
45-0.21538-1.98570.025145
46-0.122942-1.13350.130102
47-0.005163-0.04760.481072
480.050560.46610.321155


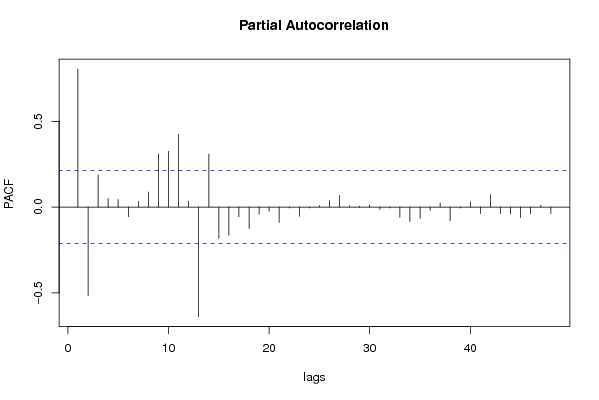
Partial Autocorrelation Function
Time lag kPACF(k)T-STATP-value
10.8046817.41880
2-0.515072-4.74874e-06
30.1885811.73860.042861
40.0487610.44960.32709
50.0440450.40610.342852
6-0.056649-0.52230.301419
70.0322260.29710.383553
80.087530.8070.210962
90.309092.84970.002745
100.3257693.00340.001753
110.4250973.91929e-05
120.0350770.32340.373596
13-0.637909-5.88120
140.3079532.83920.002828
15-0.182971-1.68690.047644
16-0.163866-1.51080.067278
17-0.056598-0.52180.301581
18-0.124049-1.14370.127984
19-0.041261-0.38040.352297
20-0.024452-0.22540.411089
21-0.089196-0.82230.20659
22-0.004918-0.04530.48197
23-0.052934-0.4880.313395
24-0.004607-0.04250.48311
250.0085980.07930.468503
260.0378460.34890.364006
270.0674180.62160.267946
280.0079080.07290.471027
290.0046960.04330.482783
300.010790.09950.460498
31-0.013133-0.12110.451958
32-0.005825-0.05370.478648
33-0.058777-0.54190.294654
34-0.083482-0.76970.221815
35-0.064217-0.59210.277693
36-0.019491-0.17970.428909
370.0243630.22460.41141
38-0.079001-0.72840.234199
39-0.005267-0.04860.480693
400.0314890.29030.386143
41-0.037369-0.34450.365652
420.0724220.66770.253068
43-0.03708-0.34190.36665
44-0.039749-0.36650.357463
45-0.060304-0.5560.289845
46-0.038463-0.35460.36188
470.0117170.1080.457113
48-0.037852-0.3490.363984

\begin{tabular}{lllllllll}
\hline
Partial Autocorrelation Function \tabularnewline
Time lag k & PACF(k) & T-STAT & P-value \tabularnewline
1 & 0.804681 & 7.4188 & 0 \tabularnewline
2 & -0.515072 & -4.7487 & 4e-06 \tabularnewline
3 & 0.188581 & 1.7386 & 0.042861 \tabularnewline
4 & 0.048761 & 0.4496 & 0.32709 \tabularnewline
5 & 0.044045 & 0.4061 & 0.342852 \tabularnewline
6 & -0.056649 & -0.5223 & 0.301419 \tabularnewline
7 & 0.032226 & 0.2971 & 0.383553 \tabularnewline
8 & 0.08753 & 0.807 & 0.210962 \tabularnewline
9 & 0.30909 & 2.8497 & 0.002745 \tabularnewline
10 & 0.325769 & 3.0034 & 0.001753 \tabularnewline
11 & 0.425097 & 3.9192 & 9e-05 \tabularnewline
12 & 0.035077 & 0.3234 & 0.373596 \tabularnewline
13 & -0.637909 & -5.8812 & 0 \tabularnewline
14 & 0.307953 & 2.8392 & 0.002828 \tabularnewline
15 & -0.182971 & -1.6869 & 0.047644 \tabularnewline
16 & -0.163866 & -1.5108 & 0.067278 \tabularnewline
17 & -0.056598 & -0.5218 & 0.301581 \tabularnewline
18 & -0.124049 & -1.1437 & 0.127984 \tabularnewline
19 & -0.041261 & -0.3804 & 0.352297 \tabularnewline
20 & -0.024452 & -0.2254 & 0.411089 \tabularnewline
21 & -0.089196 & -0.8223 & 0.20659 \tabularnewline
22 & -0.004918 & -0.0453 & 0.48197 \tabularnewline
23 & -0.052934 & -0.488 & 0.313395 \tabularnewline
24 & -0.004607 & -0.0425 & 0.48311 \tabularnewline
25 & 0.008598 & 0.0793 & 0.468503 \tabularnewline
26 & 0.037846 & 0.3489 & 0.364006 \tabularnewline
27 & 0.067418 & 0.6216 & 0.267946 \tabularnewline
28 & 0.007908 & 0.0729 & 0.471027 \tabularnewline
29 & 0.004696 & 0.0433 & 0.482783 \tabularnewline
30 & 0.01079 & 0.0995 & 0.460498 \tabularnewline
31 & -0.013133 & -0.1211 & 0.451958 \tabularnewline
32 & -0.005825 & -0.0537 & 0.478648 \tabularnewline
33 & -0.058777 & -0.5419 & 0.294654 \tabularnewline
34 & -0.083482 & -0.7697 & 0.221815 \tabularnewline
35 & -0.064217 & -0.5921 & 0.277693 \tabularnewline
36 & -0.019491 & -0.1797 & 0.428909 \tabularnewline
37 & 0.024363 & 0.2246 & 0.41141 \tabularnewline
38 & -0.079001 & -0.7284 & 0.234199 \tabularnewline
39 & -0.005267 & -0.0486 & 0.480693 \tabularnewline
40 & 0.031489 & 0.2903 & 0.386143 \tabularnewline
41 & -0.037369 & -0.3445 & 0.365652 \tabularnewline
42 & 0.072422 & 0.6677 & 0.253068 \tabularnewline
43 & -0.03708 & -0.3419 & 0.36665 \tabularnewline
44 & -0.039749 & -0.3665 & 0.357463 \tabularnewline
45 & -0.060304 & -0.556 & 0.289845 \tabularnewline
46 & -0.038463 & -0.3546 & 0.36188 \tabularnewline
47 & 0.011717 & 0.108 & 0.457113 \tabularnewline
48 & -0.037852 & -0.349 & 0.363984 \tabularnewline
\hline
\end{tabular}
%Source: https://freestatistics.org/blog/index.php?pk=75087&T=2

[TABLE]
[ROW][C]Partial Autocorrelation Function[/C][/ROW]
[ROW][C]Time lag k[/C][C]PACF(k)[/C][C]T-STAT[/C][C]P-value[/C][/ROW]
[ROW][C]1[/C][C]0.804681[/C][C]7.4188[/C][C]0[/C][/ROW]
[ROW][C]2[/C][C]-0.515072[/C][C]-4.7487[/C][C]4e-06[/C][/ROW]
[ROW][C]3[/C][C]0.188581[/C][C]1.7386[/C][C]0.042861[/C][/ROW]
[ROW][C]4[/C][C]0.048761[/C][C]0.4496[/C][C]0.32709[/C][/ROW]
[ROW][C]5[/C][C]0.044045[/C][C]0.4061[/C][C]0.342852[/C][/ROW]
[ROW][C]6[/C][C]-0.056649[/C][C]-0.5223[/C][C]0.301419[/C][/ROW]
[ROW][C]7[/C][C]0.032226[/C][C]0.2971[/C][C]0.383553[/C][/ROW]
[ROW][C]8[/C][C]0.08753[/C][C]0.807[/C][C]0.210962[/C][/ROW]
[ROW][C]9[/C][C]0.30909[/C][C]2.8497[/C][C]0.002745[/C][/ROW]
[ROW][C]10[/C][C]0.325769[/C][C]3.0034[/C][C]0.001753[/C][/ROW]
[ROW][C]11[/C][C]0.425097[/C][C]3.9192[/C][C]9e-05[/C][/ROW]
[ROW][C]12[/C][C]0.035077[/C][C]0.3234[/C][C]0.373596[/C][/ROW]
[ROW][C]13[/C][C]-0.637909[/C][C]-5.8812[/C][C]0[/C][/ROW]
[ROW][C]14[/C][C]0.307953[/C][C]2.8392[/C][C]0.002828[/C][/ROW]
[ROW][C]15[/C][C]-0.182971[/C][C]-1.6869[/C][C]0.047644[/C][/ROW]
[ROW][C]16[/C][C]-0.163866[/C][C]-1.5108[/C][C]0.067278[/C][/ROW]
[ROW][C]17[/C][C]-0.056598[/C][C]-0.5218[/C][C]0.301581[/C][/ROW]
[ROW][C]18[/C][C]-0.124049[/C][C]-1.1437[/C][C]0.127984[/C][/ROW]
[ROW][C]19[/C][C]-0.041261[/C][C]-0.3804[/C][C]0.352297[/C][/ROW]
[ROW][C]20[/C][C]-0.024452[/C][C]-0.2254[/C][C]0.411089[/C][/ROW]
[ROW][C]21[/C][C]-0.089196[/C][C]-0.8223[/C][C]0.20659[/C][/ROW]
[ROW][C]22[/C][C]-0.004918[/C][C]-0.0453[/C][C]0.48197[/C][/ROW]
[ROW][C]23[/C][C]-0.052934[/C][C]-0.488[/C][C]0.313395[/C][/ROW]
[ROW][C]24[/C][C]-0.004607[/C][C]-0.0425[/C][C]0.48311[/C][/ROW]
[ROW][C]25[/C][C]0.008598[/C][C]0.0793[/C][C]0.468503[/C][/ROW]
[ROW][C]26[/C][C]0.037846[/C][C]0.3489[/C][C]0.364006[/C][/ROW]
[ROW][C]27[/C][C]0.067418[/C][C]0.6216[/C][C]0.267946[/C][/ROW]
[ROW][C]28[/C][C]0.007908[/C][C]0.0729[/C][C]0.471027[/C][/ROW]
[ROW][C]29[/C][C]0.004696[/C][C]0.0433[/C][C]0.482783[/C][/ROW]
[ROW][C]30[/C][C]0.01079[/C][C]0.0995[/C][C]0.460498[/C][/ROW]
[ROW][C]31[/C][C]-0.013133[/C][C]-0.1211[/C][C]0.451958[/C][/ROW]
[ROW][C]32[/C][C]-0.005825[/C][C]-0.0537[/C][C]0.478648[/C][/ROW]
[ROW][C]33[/C][C]-0.058777[/C][C]-0.5419[/C][C]0.294654[/C][/ROW]
[ROW][C]34[/C][C]-0.083482[/C][C]-0.7697[/C][C]0.221815[/C][/ROW]
[ROW][C]35[/C][C]-0.064217[/C][C]-0.5921[/C][C]0.277693[/C][/ROW]
[ROW][C]36[/C][C]-0.019491[/C][C]-0.1797[/C][C]0.428909[/C][/ROW]
[ROW][C]37[/C][C]0.024363[/C][C]0.2246[/C][C]0.41141[/C][/ROW]
[ROW][C]38[/C][C]-0.079001[/C][C]-0.7284[/C][C]0.234199[/C][/ROW]
[ROW][C]39[/C][C]-0.005267[/C][C]-0.0486[/C][C]0.480693[/C][/ROW]
[ROW][C]40[/C][C]0.031489[/C][C]0.2903[/C][C]0.386143[/C][/ROW]
[ROW][C]41[/C][C]-0.037369[/C][C]-0.3445[/C][C]0.365652[/C][/ROW]
[ROW][C]42[/C][C]0.072422[/C][C]0.6677[/C][C]0.253068[/C][/ROW]
[ROW][C]43[/C][C]-0.03708[/C][C]-0.3419[/C][C]0.36665[/C][/ROW]
[ROW][C]44[/C][C]-0.039749[/C][C]-0.3665[/C][C]0.357463[/C][/ROW]
[ROW][C]45[/C][C]-0.060304[/C][C]-0.556[/C][C]0.289845[/C][/ROW]
[ROW][C]46[/C][C]-0.038463[/C][C]-0.3546[/C][C]0.36188[/C][/ROW]
[ROW][C]47[/C][C]0.011717[/C][C]0.108[/C][C]0.457113[/C][/ROW]
[ROW][C]48[/C][C]-0.037852[/C][C]-0.349[/C][C]0.363984[/C][/ROW]
[/TABLE]
Source: https://freestatistics.org/blog/index.php?pk=75087&T=2

Globally Unique Identifier (entire table): ba.freestatistics.org/blog/index.php?pk=75087&T=2

As an alternative you can also use a QR Code:  

The GUIDs for individual cells are displayed in the table below:

Partial Autocorrelation Function
Time lag kPACF(k)T-STATP-value
10.8046817.41880
2-0.515072-4.74874e-06
30.1885811.73860.042861
40.0487610.44960.32709
50.0440450.40610.342852
6-0.056649-0.52230.301419
70.0322260.29710.383553
80.087530.8070.210962
90.309092.84970.002745
100.3257693.00340.001753
110.4250973.91929e-05
120.0350770.32340.373596
13-0.637909-5.88120
140.3079532.83920.002828
15-0.182971-1.68690.047644
16-0.163866-1.51080.067278
17-0.056598-0.52180.301581
18-0.124049-1.14370.127984
19-0.041261-0.38040.352297
20-0.024452-0.22540.411089
21-0.089196-0.82230.20659
22-0.004918-0.04530.48197
23-0.052934-0.4880.313395
24-0.004607-0.04250.48311
250.0085980.07930.468503
260.0378460.34890.364006
270.0674180.62160.267946
280.0079080.07290.471027
290.0046960.04330.482783
300.010790.09950.460498
31-0.013133-0.12110.451958
32-0.005825-0.05370.478648
33-0.058777-0.54190.294654
34-0.083482-0.76970.221815
35-0.064217-0.59210.277693
36-0.019491-0.17970.428909
370.0243630.22460.41141
38-0.079001-0.72840.234199
39-0.005267-0.04860.480693
400.0314890.29030.386143
41-0.037369-0.34450.365652
420.0724220.66770.253068
43-0.03708-0.34190.36665
44-0.039749-0.36650.357463
45-0.060304-0.5560.289845
46-0.038463-0.35460.36188
470.0117170.1080.457113
48-0.037852-0.3490.363984


Parameters (Session):
par1 = 48 ; par2 = 1 ; par3 = 0 ; par4 = 0 ; par5 = 12 ; par6 = White Noise ; par7 = 0.95 ;
Parameters (R input):
par1 = 48 ; par2 = 1 ; par3 = 0 ; par4 = 0 ; par5 = 12 ; par6 = White Noise ; par7 = 0.95 ;
R code (references can be found in the software module):
if (par1 == 'Default') {
par1 = 10*log10(length(x))
} else {
par1 <- as.numeric(par1)
}
par2 <- as.numeric(par2)
par3 <- as.numeric(par3)
par4 <- as.numeric(par4)
par5 <- as.numeric(par5)
if (par6 == 'White Noise') par6 <- 'white' else par6 <- 'ma'
par7 <- as.numeric(par7)
if (par2 == 0) {
x <- log(x)
} else {
x <- (x ^ par2 - 1) / par2
}
if (par3 > 0) x <- diff(x,lag=1,difference=par3)
if (par4 > 0) x <- diff(x,lag=par5,difference=par4)
bitmap(file='pic1.png')
racf <- acf(x, par1, main='Autocorrelation', xlab='time lag', ylab='ACF', ci.type=par6, ci=par7, sub=paste('(lambda=',par2,', d=',par3,', D=',par4,', CI=', par7, ', CI type=',par6,')',sep=''))
dev.off()
bitmap(file='pic2.png')
rpacf <- pacf(x,par1,main='Partial Autocorrelation',xlab='lags',ylab='PACF')
dev.off()
(myacf <- c(racf$acf))
(mypacf <- c(rpacf$acf))
lengthx <- length(x)
sqrtn <- sqrt(lengthx)
load(file='createtable')
a<-table.start()
a<-table.row.start(a)
a<-table.element(a,'Autocorrelation Function',4,TRUE)
a<-table.row.end(a)
a<-table.row.start(a)
a<-table.element(a,'Time lag k',header=TRUE)
a<-table.element(a,hyperlink('basics.htm','ACF(k)','click here for more information about the Autocorrelation Function'),header=TRUE)
a<-table.element(a,'T-STAT',header=TRUE)
a<-table.element(a,'P-value',header=TRUE)
a<-table.row.end(a)
for (i in 2:(par1+1)) {
a<-table.row.start(a)
a<-table.element(a,i-1,header=TRUE)
a<-table.element(a,round(myacf[i],6))
mytstat <- myacf[i]*sqrtn
a<-table.element(a,round(mytstat,4))
a<-table.element(a,round(1-pt(abs(mytstat),lengthx),6))
a<-table.row.end(a)
}
a<-table.end(a)
table.save(a,file='mytable.tab')
a<-table.start()
a<-table.row.start(a)
a<-table.element(a,'Partial Autocorrelation Function',4,TRUE)
a<-table.row.end(a)
a<-table.row.start(a)
a<-table.element(a,'Time lag k',header=TRUE)
a<-table.element(a,hyperlink('basics.htm','PACF(k)','click here for more information about the Partial Autocorrelation Function'),header=TRUE)
a<-table.element(a,'T-STAT',header=TRUE)
a<-table.element(a,'P-value',header=TRUE)
a<-table.row.end(a)
for (i in 1:par1) {
a<-table.row.start(a)
a<-table.element(a,i,header=TRUE)
a<-table.element(a,round(mypacf[i],6))
mytstat <- mypacf[i]*sqrtn
a<-table.element(a,round(mytstat,4))
a<-table.element(a,round(1-pt(abs(mytstat),lengthx),6))
a<-table.row.end(a)
}
a<-table.end(a)
table.save(a,file='mytable1.tab')