Free Statistics

of Irreproducible Research!

Author's title

Author*Unverified author*
R Software Modulerwasp_centraltendency.wasp
Title produced by softwareCentral Tendency
Date of computationFri, 04 Jun 2010 19:48:26 +0000
Cite this page as followsStatistical Computations at FreeStatistics.org, Office for Research Development and Education, URL https://freestatistics.org/blog/index.php?v=date/2010/Jun/04/t1275680954o2c9atyluph1lxm.htm/, Retrieved Sun, 28 Apr 2024 22:58:28 +0000
Statistical Computations at FreeStatistics.org, Office for Research Development and Education, URL https://freestatistics.org/blog/index.php?pk=77495, Retrieved Sun, 28 Apr 2024 22:58:28 +0000
QR Codes:

Original text written by user:
IsPrivate?No (this computation is public)
User-defined keywordsKDGP1W52
Estimated Impact126
Family? (F = Feedback message, R = changed R code, M = changed R Module, P = changed Parameters, D = changed Data)
-       [Central Tendency] [Maandelijkse cijf...] [2010-06-04 19:48:26] [26ddb8a30b965ed6738d4d4bc4c527d5] [Current]
Feedback Forum

Post a new message
Dataseries X:
580
575
558
564
581
597
587
536
524
537
536
533
528
516
502
506
518
534
528
478
469
490
493
508
517
514
510
527
542
565
555
499
511
526
532
549
561
557
566
588
620
626
620
573
573
574
580
590
593
597
595
612
628
629
621
569
567
573
584
589
591
595
594
611
613
611
594
543
537
544
555
561
562


Summary of computational transaction
Raw Inputview raw input (R code)
Raw Outputview raw output of R engine
Computing time2 seconds
R Server'Sir Ronald Aylmer Fisher' @ 193.190.124.24

\begin{tabular}{lllllllll}
\hline
Summary of computational transaction \tabularnewline
Raw Input & view raw input (R code)  \tabularnewline
Raw Output & view raw output of R engine  \tabularnewline
Computing time & 2 seconds \tabularnewline
R Server & 'Sir Ronald Aylmer Fisher' @ 193.190.124.24 \tabularnewline
\hline
\end{tabular}
%Source: https://freestatistics.org/blog/index.php?pk=77495&T=0

[TABLE]
[ROW][C]Summary of computational transaction[/C][/ROW]
[ROW][C]Raw Input[/C][C]view raw input (R code) [/C][/ROW]
[ROW][C]Raw Output[/C][C]view raw output of R engine [/C][/ROW]
[ROW][C]Computing time[/C][C]2 seconds[/C][/ROW]
[ROW][C]R Server[/C][C]'Sir Ronald Aylmer Fisher' @ 193.190.124.24[/C][/ROW]
[/TABLE]
Source: https://freestatistics.org/blog/index.php?pk=77495&T=0

Globally Unique Identifier (entire table): ba.freestatistics.org/blog/index.php?pk=77495&T=0

As an alternative you can also use a QR Code:  

The GUIDs for individual cells are displayed in the table below:

Summary of computational transaction
Raw Inputview raw input (R code)
Raw Outputview raw output of R engine
Computing time2 seconds
R Server'Sir Ronald Aylmer Fisher' @ 193.190.124.24


Central Tendency - Ungrouped Data
MeasureValueS.E.Value/S.E.
Arithmetic Mean559.1917808219184.61198629995709121.247493911055
Geometric Mean557.806666384831
Harmonic Mean556.406541917863
Quadratic Mean560.559468574226
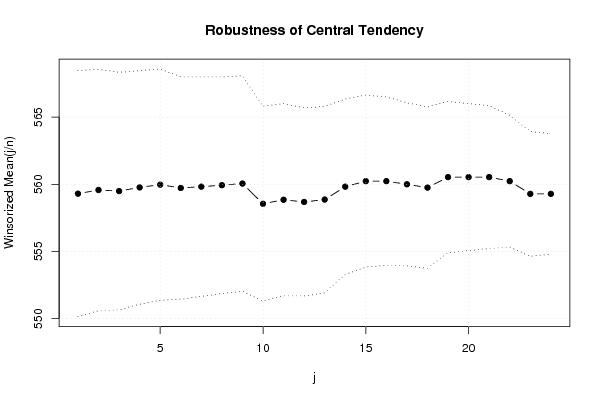
Winsorized Mean ( 1 / 24 )559.3013698630144.5771620940741122.193918058336
Winsorized Mean ( 2 / 24 )559.5753424657534.48983791730565124.631524071042
Winsorized Mean ( 3 / 24 )559.4931506849314.42273096584248126.503998322755
Winsorized Mean ( 4 / 24 )559.7671232876714.34589505872735128.803644755194
Winsorized Mean ( 5 / 24 )559.9726027397264.30673133366157130.022645797048
Winsorized Mean ( 6 / 24 )559.726027397264.13914473413609135.227459620129
Winsorized Mean ( 7 / 24 )559.8219178082194.08790129667066136.946045704224
Winsorized Mean ( 8 / 24 )559.9315068493154.03038916502913138.927404754788
Winsorized Mean ( 9 / 24 )560.0547945205484.00930663958214139.688690555961
Winsorized Mean ( 10 / 24 )558.5479452054793.62754351514854153.974154375543
Winsorized Mean ( 11 / 24 )558.8493150684933.5767658427396156.244311101016
Winsorized Mean ( 12 / 24 )558.6849315068493.50146070369008159.557675720327
Winsorized Mean ( 13 / 24 )558.863013698633.47218316943906160.954358231313
Winsorized Mean ( 14 / 24 )559.8219178082193.26239251097172171.598578627644
Winsorized Mean ( 15 / 24 )560.2328767123293.20052320137446175.044154178210
Winsorized Mean ( 16 / 24 )560.2328767123293.13614954975956178.637168866925
Winsorized Mean ( 17 / 24 )5603.03511914916358184.506759859600
Winsorized Mean ( 18 / 24 )559.7534246575343.00036659492238186.561677364634
Winsorized Mean ( 19 / 24 )560.5342465753422.81393319254263199.199557424052
Winsorized Mean ( 20 / 24 )560.5342465753422.73715918569442204.786864244117
Winsorized Mean ( 21 / 24 )560.5342465753422.65716645291865210.95187543093
Winsorized Mean ( 22 / 24 )560.2328767123292.45046205594994228.623363235531
Winsorized Mean ( 23 / 24 )559.2876712328772.32544978154215240.507309885651
Winsorized Mean ( 24 / 24 )559.2876712328772.23738467914129249.973854047992
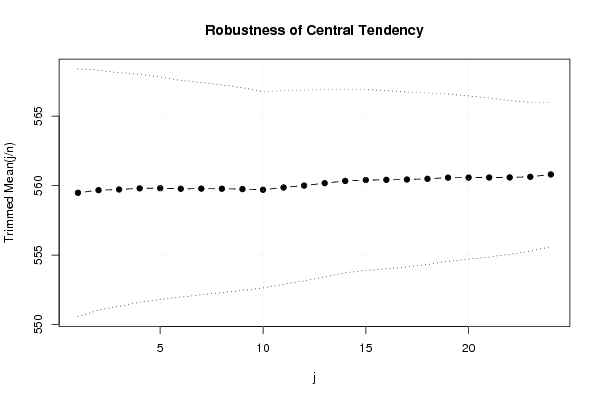
Trimmed Mean ( 1 / 24 )559.4788732394374.45825073991262125.492913225065
Trimmed Mean ( 2 / 24 )559.6666666666674.31712161904207129.638846447613
Trimmed Mean ( 3 / 24 )559.7164179104484.2050994203824133.104205621742
Trimmed Mean ( 4 / 24 )559.84.10166476520862136.481168511959
Trimmed Mean ( 5 / 24 )559.8095238095244.00542752248991139.762739599274
Trimmed Mean ( 6 / 24 )559.7704918032793.90112730258082143.489419438571
Trimmed Mean ( 7 / 24 )559.7796610169493.8215657236445146.479140095255
Trimmed Mean ( 8 / 24 )559.7719298245613.73663177305857149.806554089853
Trimmed Mean ( 9 / 24 )559.7454545454553.6453206185463153.551775856872
Trimmed Mean ( 10 / 24 )559.6981132075473.53620963692344158.276281859379
Trimmed Mean ( 11 / 24 )559.8627450980393.48565909122925160.618904615999
Trimmed Mean ( 12 / 24 )5603.43043104330303163.244791377820
Trimmed Mean ( 13 / 24 )560.1702127659573.3733623702164166.056934087998
Trimmed Mean ( 14 / 24 )560.3333333333333.30365576507926169.610084457419
Trimmed Mean ( 15 / 24 )560.3953488372093.25684210945136172.067091373862
Trimmed Mean ( 16 / 24 )560.4146341463413.20479359134363174.867621946094
Trimmed Mean ( 17 / 24 )560.4358974358973.14576056679189178.155929396572
Trimmed Mean ( 18 / 24 )560.4864864864863.08527979019995181.664719117796
Trimmed Mean ( 19 / 24 )560.5714285714293.00595647169481186.486874926492
Trimmed Mean ( 20 / 24 )560.5757575757582.94006747984502190.667650119822
Trimmed Mean ( 21 / 24 )560.580645161292.861601248699195.897540028036
Trimmed Mean ( 22 / 24 )560.5862068965522.76569290500168202.692860759323
Trimmed Mean ( 23 / 24 )560.629629629632.68431560730559208.853842709043
Trimmed Mean ( 24 / 24 )560.82.59358182185692216.226068240440
Median562
Midrange549
Midmean - Weighted Average at Xnp558.810810810811
Midmean - Weighted Average at X(n+1)p559.631578947368
Midmean - Empirical Distribution Function559.631578947368
Midmean - Empirical Distribution Function - Averaging559.631578947368
Midmean - Empirical Distribution Function - Interpolation559.631578947368
Midmean - Closest Observation559.631578947368
Midmean - True Basic - Statistics Graphics Toolkit559.631578947368
Midmean - MS Excel (old versions)559.631578947368
Number of observations73

\begin{tabular}{lllllllll}
\hline
Central Tendency - Ungrouped Data \tabularnewline
Measure & Value & S.E. & Value/S.E. \tabularnewline
Arithmetic Mean & 559.191780821918 & 4.61198629995709 & 121.247493911055 \tabularnewline
Geometric Mean & 557.806666384831 &  &  \tabularnewline
Harmonic Mean & 556.406541917863 &  &  \tabularnewline
Quadratic Mean & 560.559468574226 &  &  \tabularnewline
Winsorized Mean ( 1 / 24 ) & 559.301369863014 & 4.5771620940741 & 122.193918058336 \tabularnewline
Winsorized Mean ( 2 / 24 ) & 559.575342465753 & 4.48983791730565 & 124.631524071042 \tabularnewline
Winsorized Mean ( 3 / 24 ) & 559.493150684931 & 4.42273096584248 & 126.503998322755 \tabularnewline
Winsorized Mean ( 4 / 24 ) & 559.767123287671 & 4.34589505872735 & 128.803644755194 \tabularnewline
Winsorized Mean ( 5 / 24 ) & 559.972602739726 & 4.30673133366157 & 130.022645797048 \tabularnewline
Winsorized Mean ( 6 / 24 ) & 559.72602739726 & 4.13914473413609 & 135.227459620129 \tabularnewline
Winsorized Mean ( 7 / 24 ) & 559.821917808219 & 4.08790129667066 & 136.946045704224 \tabularnewline
Winsorized Mean ( 8 / 24 ) & 559.931506849315 & 4.03038916502913 & 138.927404754788 \tabularnewline
Winsorized Mean ( 9 / 24 ) & 560.054794520548 & 4.00930663958214 & 139.688690555961 \tabularnewline
Winsorized Mean ( 10 / 24 ) & 558.547945205479 & 3.62754351514854 & 153.974154375543 \tabularnewline
Winsorized Mean ( 11 / 24 ) & 558.849315068493 & 3.5767658427396 & 156.244311101016 \tabularnewline
Winsorized Mean ( 12 / 24 ) & 558.684931506849 & 3.50146070369008 & 159.557675720327 \tabularnewline
Winsorized Mean ( 13 / 24 ) & 558.86301369863 & 3.47218316943906 & 160.954358231313 \tabularnewline
Winsorized Mean ( 14 / 24 ) & 559.821917808219 & 3.26239251097172 & 171.598578627644 \tabularnewline
Winsorized Mean ( 15 / 24 ) & 560.232876712329 & 3.20052320137446 & 175.044154178210 \tabularnewline
Winsorized Mean ( 16 / 24 ) & 560.232876712329 & 3.13614954975956 & 178.637168866925 \tabularnewline
Winsorized Mean ( 17 / 24 ) & 560 & 3.03511914916358 & 184.506759859600 \tabularnewline
Winsorized Mean ( 18 / 24 ) & 559.753424657534 & 3.00036659492238 & 186.561677364634 \tabularnewline
Winsorized Mean ( 19 / 24 ) & 560.534246575342 & 2.81393319254263 & 199.199557424052 \tabularnewline
Winsorized Mean ( 20 / 24 ) & 560.534246575342 & 2.73715918569442 & 204.786864244117 \tabularnewline
Winsorized Mean ( 21 / 24 ) & 560.534246575342 & 2.65716645291865 & 210.95187543093 \tabularnewline
Winsorized Mean ( 22 / 24 ) & 560.232876712329 & 2.45046205594994 & 228.623363235531 \tabularnewline
Winsorized Mean ( 23 / 24 ) & 559.287671232877 & 2.32544978154215 & 240.507309885651 \tabularnewline
Winsorized Mean ( 24 / 24 ) & 559.287671232877 & 2.23738467914129 & 249.973854047992 \tabularnewline
Trimmed Mean ( 1 / 24 ) & 559.478873239437 & 4.45825073991262 & 125.492913225065 \tabularnewline
Trimmed Mean ( 2 / 24 ) & 559.666666666667 & 4.31712161904207 & 129.638846447613 \tabularnewline
Trimmed Mean ( 3 / 24 ) & 559.716417910448 & 4.2050994203824 & 133.104205621742 \tabularnewline
Trimmed Mean ( 4 / 24 ) & 559.8 & 4.10166476520862 & 136.481168511959 \tabularnewline
Trimmed Mean ( 5 / 24 ) & 559.809523809524 & 4.00542752248991 & 139.762739599274 \tabularnewline
Trimmed Mean ( 6 / 24 ) & 559.770491803279 & 3.90112730258082 & 143.489419438571 \tabularnewline
Trimmed Mean ( 7 / 24 ) & 559.779661016949 & 3.8215657236445 & 146.479140095255 \tabularnewline
Trimmed Mean ( 8 / 24 ) & 559.771929824561 & 3.73663177305857 & 149.806554089853 \tabularnewline
Trimmed Mean ( 9 / 24 ) & 559.745454545455 & 3.6453206185463 & 153.551775856872 \tabularnewline
Trimmed Mean ( 10 / 24 ) & 559.698113207547 & 3.53620963692344 & 158.276281859379 \tabularnewline
Trimmed Mean ( 11 / 24 ) & 559.862745098039 & 3.48565909122925 & 160.618904615999 \tabularnewline
Trimmed Mean ( 12 / 24 ) & 560 & 3.43043104330303 & 163.244791377820 \tabularnewline
Trimmed Mean ( 13 / 24 ) & 560.170212765957 & 3.3733623702164 & 166.056934087998 \tabularnewline
Trimmed Mean ( 14 / 24 ) & 560.333333333333 & 3.30365576507926 & 169.610084457419 \tabularnewline
Trimmed Mean ( 15 / 24 ) & 560.395348837209 & 3.25684210945136 & 172.067091373862 \tabularnewline
Trimmed Mean ( 16 / 24 ) & 560.414634146341 & 3.20479359134363 & 174.867621946094 \tabularnewline
Trimmed Mean ( 17 / 24 ) & 560.435897435897 & 3.14576056679189 & 178.155929396572 \tabularnewline
Trimmed Mean ( 18 / 24 ) & 560.486486486486 & 3.08527979019995 & 181.664719117796 \tabularnewline
Trimmed Mean ( 19 / 24 ) & 560.571428571429 & 3.00595647169481 & 186.486874926492 \tabularnewline
Trimmed Mean ( 20 / 24 ) & 560.575757575758 & 2.94006747984502 & 190.667650119822 \tabularnewline
Trimmed Mean ( 21 / 24 ) & 560.58064516129 & 2.861601248699 & 195.897540028036 \tabularnewline
Trimmed Mean ( 22 / 24 ) & 560.586206896552 & 2.76569290500168 & 202.692860759323 \tabularnewline
Trimmed Mean ( 23 / 24 ) & 560.62962962963 & 2.68431560730559 & 208.853842709043 \tabularnewline
Trimmed Mean ( 24 / 24 ) & 560.8 & 2.59358182185692 & 216.226068240440 \tabularnewline
Median & 562 &  &  \tabularnewline
Midrange & 549 &  &  \tabularnewline
Midmean - Weighted Average at Xnp & 558.810810810811 &  &  \tabularnewline
Midmean - Weighted Average at X(n+1)p & 559.631578947368 &  &  \tabularnewline
Midmean - Empirical Distribution Function & 559.631578947368 &  &  \tabularnewline
Midmean - Empirical Distribution Function - Averaging & 559.631578947368 &  &  \tabularnewline
Midmean - Empirical Distribution Function - Interpolation & 559.631578947368 &  &  \tabularnewline
Midmean - Closest Observation & 559.631578947368 &  &  \tabularnewline
Midmean - True Basic - Statistics Graphics Toolkit & 559.631578947368 &  &  \tabularnewline
Midmean - MS Excel (old versions) & 559.631578947368 &  &  \tabularnewline
Number of observations & 73 &  &  \tabularnewline
\hline
\end{tabular}
%Source: https://freestatistics.org/blog/index.php?pk=77495&T=1

[TABLE]
[ROW][C]Central Tendency - Ungrouped Data[/C][/ROW]
[ROW][C]Measure[/C][C]Value[/C][C]S.E.[/C][C]Value/S.E.[/C][/ROW]
[ROW][C]Arithmetic Mean[/C][C]559.191780821918[/C][C]4.61198629995709[/C][C]121.247493911055[/C][/ROW]
[ROW][C]Geometric Mean[/C][C]557.806666384831[/C][C][/C][C][/C][/ROW]
[ROW][C]Harmonic Mean[/C][C]556.406541917863[/C][C][/C][C][/C][/ROW]
[ROW][C]Quadratic Mean[/C][C]560.559468574226[/C][C][/C][C][/C][/ROW]
[ROW][C]Winsorized Mean ( 1 / 24 )[/C][C]559.301369863014[/C][C]4.5771620940741[/C][C]122.193918058336[/C][/ROW]
[ROW][C]Winsorized Mean ( 2 / 24 )[/C][C]559.575342465753[/C][C]4.48983791730565[/C][C]124.631524071042[/C][/ROW]
[ROW][C]Winsorized Mean ( 3 / 24 )[/C][C]559.493150684931[/C][C]4.42273096584248[/C][C]126.503998322755[/C][/ROW]
[ROW][C]Winsorized Mean ( 4 / 24 )[/C][C]559.767123287671[/C][C]4.34589505872735[/C][C]128.803644755194[/C][/ROW]
[ROW][C]Winsorized Mean ( 5 / 24 )[/C][C]559.972602739726[/C][C]4.30673133366157[/C][C]130.022645797048[/C][/ROW]
[ROW][C]Winsorized Mean ( 6 / 24 )[/C][C]559.72602739726[/C][C]4.13914473413609[/C][C]135.227459620129[/C][/ROW]
[ROW][C]Winsorized Mean ( 7 / 24 )[/C][C]559.821917808219[/C][C]4.08790129667066[/C][C]136.946045704224[/C][/ROW]
[ROW][C]Winsorized Mean ( 8 / 24 )[/C][C]559.931506849315[/C][C]4.03038916502913[/C][C]138.927404754788[/C][/ROW]
[ROW][C]Winsorized Mean ( 9 / 24 )[/C][C]560.054794520548[/C][C]4.00930663958214[/C][C]139.688690555961[/C][/ROW]
[ROW][C]Winsorized Mean ( 10 / 24 )[/C][C]558.547945205479[/C][C]3.62754351514854[/C][C]153.974154375543[/C][/ROW]
[ROW][C]Winsorized Mean ( 11 / 24 )[/C][C]558.849315068493[/C][C]3.5767658427396[/C][C]156.244311101016[/C][/ROW]
[ROW][C]Winsorized Mean ( 12 / 24 )[/C][C]558.684931506849[/C][C]3.50146070369008[/C][C]159.557675720327[/C][/ROW]
[ROW][C]Winsorized Mean ( 13 / 24 )[/C][C]558.86301369863[/C][C]3.47218316943906[/C][C]160.954358231313[/C][/ROW]
[ROW][C]Winsorized Mean ( 14 / 24 )[/C][C]559.821917808219[/C][C]3.26239251097172[/C][C]171.598578627644[/C][/ROW]
[ROW][C]Winsorized Mean ( 15 / 24 )[/C][C]560.232876712329[/C][C]3.20052320137446[/C][C]175.044154178210[/C][/ROW]
[ROW][C]Winsorized Mean ( 16 / 24 )[/C][C]560.232876712329[/C][C]3.13614954975956[/C][C]178.637168866925[/C][/ROW]
[ROW][C]Winsorized Mean ( 17 / 24 )[/C][C]560[/C][C]3.03511914916358[/C][C]184.506759859600[/C][/ROW]
[ROW][C]Winsorized Mean ( 18 / 24 )[/C][C]559.753424657534[/C][C]3.00036659492238[/C][C]186.561677364634[/C][/ROW]
[ROW][C]Winsorized Mean ( 19 / 24 )[/C][C]560.534246575342[/C][C]2.81393319254263[/C][C]199.199557424052[/C][/ROW]
[ROW][C]Winsorized Mean ( 20 / 24 )[/C][C]560.534246575342[/C][C]2.73715918569442[/C][C]204.786864244117[/C][/ROW]
[ROW][C]Winsorized Mean ( 21 / 24 )[/C][C]560.534246575342[/C][C]2.65716645291865[/C][C]210.95187543093[/C][/ROW]
[ROW][C]Winsorized Mean ( 22 / 24 )[/C][C]560.232876712329[/C][C]2.45046205594994[/C][C]228.623363235531[/C][/ROW]
[ROW][C]Winsorized Mean ( 23 / 24 )[/C][C]559.287671232877[/C][C]2.32544978154215[/C][C]240.507309885651[/C][/ROW]
[ROW][C]Winsorized Mean ( 24 / 24 )[/C][C]559.287671232877[/C][C]2.23738467914129[/C][C]249.973854047992[/C][/ROW]
[ROW][C]Trimmed Mean ( 1 / 24 )[/C][C]559.478873239437[/C][C]4.45825073991262[/C][C]125.492913225065[/C][/ROW]
[ROW][C]Trimmed Mean ( 2 / 24 )[/C][C]559.666666666667[/C][C]4.31712161904207[/C][C]129.638846447613[/C][/ROW]
[ROW][C]Trimmed Mean ( 3 / 24 )[/C][C]559.716417910448[/C][C]4.2050994203824[/C][C]133.104205621742[/C][/ROW]
[ROW][C]Trimmed Mean ( 4 / 24 )[/C][C]559.8[/C][C]4.10166476520862[/C][C]136.481168511959[/C][/ROW]
[ROW][C]Trimmed Mean ( 5 / 24 )[/C][C]559.809523809524[/C][C]4.00542752248991[/C][C]139.762739599274[/C][/ROW]
[ROW][C]Trimmed Mean ( 6 / 24 )[/C][C]559.770491803279[/C][C]3.90112730258082[/C][C]143.489419438571[/C][/ROW]
[ROW][C]Trimmed Mean ( 7 / 24 )[/C][C]559.779661016949[/C][C]3.8215657236445[/C][C]146.479140095255[/C][/ROW]
[ROW][C]Trimmed Mean ( 8 / 24 )[/C][C]559.771929824561[/C][C]3.73663177305857[/C][C]149.806554089853[/C][/ROW]
[ROW][C]Trimmed Mean ( 9 / 24 )[/C][C]559.745454545455[/C][C]3.6453206185463[/C][C]153.551775856872[/C][/ROW]
[ROW][C]Trimmed Mean ( 10 / 24 )[/C][C]559.698113207547[/C][C]3.53620963692344[/C][C]158.276281859379[/C][/ROW]
[ROW][C]Trimmed Mean ( 11 / 24 )[/C][C]559.862745098039[/C][C]3.48565909122925[/C][C]160.618904615999[/C][/ROW]
[ROW][C]Trimmed Mean ( 12 / 24 )[/C][C]560[/C][C]3.43043104330303[/C][C]163.244791377820[/C][/ROW]
[ROW][C]Trimmed Mean ( 13 / 24 )[/C][C]560.170212765957[/C][C]3.3733623702164[/C][C]166.056934087998[/C][/ROW]
[ROW][C]Trimmed Mean ( 14 / 24 )[/C][C]560.333333333333[/C][C]3.30365576507926[/C][C]169.610084457419[/C][/ROW]
[ROW][C]Trimmed Mean ( 15 / 24 )[/C][C]560.395348837209[/C][C]3.25684210945136[/C][C]172.067091373862[/C][/ROW]
[ROW][C]Trimmed Mean ( 16 / 24 )[/C][C]560.414634146341[/C][C]3.20479359134363[/C][C]174.867621946094[/C][/ROW]
[ROW][C]Trimmed Mean ( 17 / 24 )[/C][C]560.435897435897[/C][C]3.14576056679189[/C][C]178.155929396572[/C][/ROW]
[ROW][C]Trimmed Mean ( 18 / 24 )[/C][C]560.486486486486[/C][C]3.08527979019995[/C][C]181.664719117796[/C][/ROW]
[ROW][C]Trimmed Mean ( 19 / 24 )[/C][C]560.571428571429[/C][C]3.00595647169481[/C][C]186.486874926492[/C][/ROW]
[ROW][C]Trimmed Mean ( 20 / 24 )[/C][C]560.575757575758[/C][C]2.94006747984502[/C][C]190.667650119822[/C][/ROW]
[ROW][C]Trimmed Mean ( 21 / 24 )[/C][C]560.58064516129[/C][C]2.861601248699[/C][C]195.897540028036[/C][/ROW]
[ROW][C]Trimmed Mean ( 22 / 24 )[/C][C]560.586206896552[/C][C]2.76569290500168[/C][C]202.692860759323[/C][/ROW]
[ROW][C]Trimmed Mean ( 23 / 24 )[/C][C]560.62962962963[/C][C]2.68431560730559[/C][C]208.853842709043[/C][/ROW]
[ROW][C]Trimmed Mean ( 24 / 24 )[/C][C]560.8[/C][C]2.59358182185692[/C][C]216.226068240440[/C][/ROW]
[ROW][C]Median[/C][C]562[/C][C][/C][C][/C][/ROW]
[ROW][C]Midrange[/C][C]549[/C][C][/C][C][/C][/ROW]
[ROW][C]Midmean - Weighted Average at Xnp[/C][C]558.810810810811[/C][C][/C][C][/C][/ROW]
[ROW][C]Midmean - Weighted Average at X(n+1)p[/C][C]559.631578947368[/C][C][/C][C][/C][/ROW]
[ROW][C]Midmean - Empirical Distribution Function[/C][C]559.631578947368[/C][C][/C][C][/C][/ROW]
[ROW][C]Midmean - Empirical Distribution Function - Averaging[/C][C]559.631578947368[/C][C][/C][C][/C][/ROW]
[ROW][C]Midmean - Empirical Distribution Function - Interpolation[/C][C]559.631578947368[/C][C][/C][C][/C][/ROW]
[ROW][C]Midmean - Closest Observation[/C][C]559.631578947368[/C][C][/C][C][/C][/ROW]
[ROW][C]Midmean - True Basic - Statistics Graphics Toolkit[/C][C]559.631578947368[/C][C][/C][C][/C][/ROW]
[ROW][C]Midmean - MS Excel (old versions)[/C][C]559.631578947368[/C][C][/C][C][/C][/ROW]
[ROW][C]Number of observations[/C][C]73[/C][C][/C][C][/C][/ROW]
[/TABLE]
Source: https://freestatistics.org/blog/index.php?pk=77495&T=1

Globally Unique Identifier (entire table): ba.freestatistics.org/blog/index.php?pk=77495&T=1

As an alternative you can also use a QR Code:  

The GUIDs for individual cells are displayed in the table below:

Central Tendency - Ungrouped Data
MeasureValueS.E.Value/S.E.
Arithmetic Mean559.1917808219184.61198629995709121.247493911055
Geometric Mean557.806666384831
Harmonic Mean556.406541917863
Quadratic Mean560.559468574226
Winsorized Mean ( 1 / 24 )559.3013698630144.5771620940741122.193918058336
Winsorized Mean ( 2 / 24 )559.5753424657534.48983791730565124.631524071042
Winsorized Mean ( 3 / 24 )559.4931506849314.42273096584248126.503998322755
Winsorized Mean ( 4 / 24 )559.7671232876714.34589505872735128.803644755194
Winsorized Mean ( 5 / 24 )559.9726027397264.30673133366157130.022645797048
Winsorized Mean ( 6 / 24 )559.726027397264.13914473413609135.227459620129
Winsorized Mean ( 7 / 24 )559.8219178082194.08790129667066136.946045704224
Winsorized Mean ( 8 / 24 )559.9315068493154.03038916502913138.927404754788
Winsorized Mean ( 9 / 24 )560.0547945205484.00930663958214139.688690555961
Winsorized Mean ( 10 / 24 )558.5479452054793.62754351514854153.974154375543
Winsorized Mean ( 11 / 24 )558.8493150684933.5767658427396156.244311101016
Winsorized Mean ( 12 / 24 )558.6849315068493.50146070369008159.557675720327
Winsorized Mean ( 13 / 24 )558.863013698633.47218316943906160.954358231313
Winsorized Mean ( 14 / 24 )559.8219178082193.26239251097172171.598578627644
Winsorized Mean ( 15 / 24 )560.2328767123293.20052320137446175.044154178210
Winsorized Mean ( 16 / 24 )560.2328767123293.13614954975956178.637168866925
Winsorized Mean ( 17 / 24 )5603.03511914916358184.506759859600
Winsorized Mean ( 18 / 24 )559.7534246575343.00036659492238186.561677364634
Winsorized Mean ( 19 / 24 )560.5342465753422.81393319254263199.199557424052
Winsorized Mean ( 20 / 24 )560.5342465753422.73715918569442204.786864244117
Winsorized Mean ( 21 / 24 )560.5342465753422.65716645291865210.95187543093
Winsorized Mean ( 22 / 24 )560.2328767123292.45046205594994228.623363235531
Winsorized Mean ( 23 / 24 )559.2876712328772.32544978154215240.507309885651
Winsorized Mean ( 24 / 24 )559.2876712328772.23738467914129249.973854047992
Trimmed Mean ( 1 / 24 )559.4788732394374.45825073991262125.492913225065
Trimmed Mean ( 2 / 24 )559.6666666666674.31712161904207129.638846447613
Trimmed Mean ( 3 / 24 )559.7164179104484.2050994203824133.104205621742
Trimmed Mean ( 4 / 24 )559.84.10166476520862136.481168511959
Trimmed Mean ( 5 / 24 )559.8095238095244.00542752248991139.762739599274
Trimmed Mean ( 6 / 24 )559.7704918032793.90112730258082143.489419438571
Trimmed Mean ( 7 / 24 )559.7796610169493.8215657236445146.479140095255
Trimmed Mean ( 8 / 24 )559.7719298245613.73663177305857149.806554089853
Trimmed Mean ( 9 / 24 )559.7454545454553.6453206185463153.551775856872
Trimmed Mean ( 10 / 24 )559.6981132075473.53620963692344158.276281859379
Trimmed Mean ( 11 / 24 )559.8627450980393.48565909122925160.618904615999
Trimmed Mean ( 12 / 24 )5603.43043104330303163.244791377820
Trimmed Mean ( 13 / 24 )560.1702127659573.3733623702164166.056934087998
Trimmed Mean ( 14 / 24 )560.3333333333333.30365576507926169.610084457419
Trimmed Mean ( 15 / 24 )560.3953488372093.25684210945136172.067091373862
Trimmed Mean ( 16 / 24 )560.4146341463413.20479359134363174.867621946094
Trimmed Mean ( 17 / 24 )560.4358974358973.14576056679189178.155929396572
Trimmed Mean ( 18 / 24 )560.4864864864863.08527979019995181.664719117796
Trimmed Mean ( 19 / 24 )560.5714285714293.00595647169481186.486874926492
Trimmed Mean ( 20 / 24 )560.5757575757582.94006747984502190.667650119822
Trimmed Mean ( 21 / 24 )560.580645161292.861601248699195.897540028036
Trimmed Mean ( 22 / 24 )560.5862068965522.76569290500168202.692860759323
Trimmed Mean ( 23 / 24 )560.629629629632.68431560730559208.853842709043
Trimmed Mean ( 24 / 24 )560.82.59358182185692216.226068240440
Median562
Midrange549
Midmean - Weighted Average at Xnp558.810810810811
Midmean - Weighted Average at X(n+1)p559.631578947368
Midmean - Empirical Distribution Function559.631578947368
Midmean - Empirical Distribution Function - Averaging559.631578947368
Midmean - Empirical Distribution Function - Interpolation559.631578947368
Midmean - Closest Observation559.631578947368
Midmean - True Basic - Statistics Graphics Toolkit559.631578947368
Midmean - MS Excel (old versions)559.631578947368
Number of observations73


Parameters (Session):
Parameters (R input):
R code (references can be found in the software module):
geomean <- function(x) {
return(exp(mean(log(x))))
}
harmean <- function(x) {
return(1/mean(1/x))
}
quamean <- function(x) {
return(sqrt(mean(x*x)))
}
winmean <- function(x) {
x <-sort(x[!is.na(x)])
n<-length(x)
denom <- 3
nodenom <- n/denom
if (nodenom>40) denom <- n/40
sqrtn = sqrt(n)
roundnodenom = floor(nodenom)
win <- array(NA,dim=c(roundnodenom,2))
for (j in 1:roundnodenom) {
win[j,1] <- (j*x[j+1]+sum(x[(j+1):(n-j)])+j*x[n-j])/n
win[j,2] <- sd(c(rep(x[j+1],j),x[(j+1):(n-j)],rep(x[n-j],j)))/sqrtn
}
return(win)
}
trimean <- function(x) {
x <-sort(x[!is.na(x)])
n<-length(x)
denom <- 3
nodenom <- n/denom
if (nodenom>40) denom <- n/40
sqrtn = sqrt(n)
roundnodenom = floor(nodenom)
tri <- array(NA,dim=c(roundnodenom,2))
for (j in 1:roundnodenom) {
tri[j,1] <- mean(x,trim=j/n)
tri[j,2] <- sd(x[(j+1):(n-j)]) / sqrt(n-j*2)
}
return(tri)
}
midrange <- function(x) {
return((max(x)+min(x))/2)
}
q1 <- function(data,n,p,i,f) {
np <- n*p;
i <<- floor(np)
f <<- np - i
qvalue <- (1-f)*data[i] + f*data[i+1]
}
q2 <- function(data,n,p,i,f) {
np <- (n+1)*p
i <<- floor(np)
f <<- np - i
qvalue <- (1-f)*data[i] + f*data[i+1]
}
q3 <- function(data,n,p,i,f) {
np <- n*p
i <<- floor(np)
f <<- np - i
if (f==0) {
qvalue <- data[i]
} else {
qvalue <- data[i+1]
}
}
q4 <- function(data,n,p,i,f) {
np <- n*p
i <<- floor(np)
f <<- np - i
if (f==0) {
qvalue <- (data[i]+data[i+1])/2
} else {
qvalue <- data[i+1]
}
}
q5 <- function(data,n,p,i,f) {
np <- (n-1)*p
i <<- floor(np)
f <<- np - i
if (f==0) {
qvalue <- data[i+1]
} else {
qvalue <- data[i+1] + f*(data[i+2]-data[i+1])
}
}
q6 <- function(data,n,p,i,f) {
np <- n*p+0.5
i <<- floor(np)
f <<- np - i
qvalue <- data[i]
}
q7 <- function(data,n,p,i,f) {
np <- (n+1)*p
i <<- floor(np)
f <<- np - i
if (f==0) {
qvalue <- data[i]
} else {
qvalue <- f*data[i] + (1-f)*data[i+1]
}
}
q8 <- function(data,n,p,i,f) {
np <- (n+1)*p
i <<- floor(np)
f <<- np - i
if (f==0) {
qvalue <- data[i]
} else {
if (f == 0.5) {
qvalue <- (data[i]+data[i+1])/2
} else {
if (f < 0.5) {
qvalue <- data[i]
} else {
qvalue <- data[i+1]
}
}
}
}
midmean <- function(x,def) {
x <-sort(x[!is.na(x)])
n<-length(x)
if (def==1) {
qvalue1 <- q1(x,n,0.25,i,f)
qvalue3 <- q1(x,n,0.75,i,f)
}
if (def==2) {
qvalue1 <- q2(x,n,0.25,i,f)
qvalue3 <- q2(x,n,0.75,i,f)
}
if (def==3) {
qvalue1 <- q3(x,n,0.25,i,f)
qvalue3 <- q3(x,n,0.75,i,f)
}
if (def==4) {
qvalue1 <- q4(x,n,0.25,i,f)
qvalue3 <- q4(x,n,0.75,i,f)
}
if (def==5) {
qvalue1 <- q5(x,n,0.25,i,f)
qvalue3 <- q5(x,n,0.75,i,f)
}
if (def==6) {
qvalue1 <- q6(x,n,0.25,i,f)
qvalue3 <- q6(x,n,0.75,i,f)
}
if (def==7) {
qvalue1 <- q7(x,n,0.25,i,f)
qvalue3 <- q7(x,n,0.75,i,f)
}
if (def==8) {
qvalue1 <- q8(x,n,0.25,i,f)
qvalue3 <- q8(x,n,0.75,i,f)
}
midm <- 0
myn <- 0
roundno4 <- round(n/4)
round3no4 <- round(3*n/4)
for (i in 1:n) {
if ((x[i]>=qvalue1) & (x[i]<=qvalue3)){
midm = midm + x[i]
myn = myn + 1
}
}
midm = midm / myn
return(midm)
}
(arm <- mean(x))
sqrtn <- sqrt(length(x))
(armse <- sd(x) / sqrtn)
(armose <- arm / armse)
(geo <- geomean(x))
(har <- harmean(x))
(qua <- quamean(x))
(win <- winmean(x))
(tri <- trimean(x))
(midr <- midrange(x))
midm <- array(NA,dim=8)
for (j in 1:8) midm[j] <- midmean(x,j)
midm
bitmap(file='test1.png')
lb <- win[,1] - 2*win[,2]
ub <- win[,1] + 2*win[,2]
if ((ylimmin == '') | (ylimmax == '')) plot(win[,1],type='b',main=main, xlab='j', pch=19, ylab='Winsorized Mean(j/n)', ylim=c(min(lb),max(ub))) else plot(win[,1],type='l',main=main, xlab='j', pch=19, ylab='Winsorized Mean(j/n)', ylim=c(ylimmin,ylimmax))
lines(ub,lty=3)
lines(lb,lty=3)
grid()
dev.off()
bitmap(file='test2.png')
lb <- tri[,1] - 2*tri[,2]
ub <- tri[,1] + 2*tri[,2]
if ((ylimmin == '') | (ylimmax == '')) plot(tri[,1],type='b',main=main, xlab='j', pch=19, ylab='Trimmed Mean(j/n)', ylim=c(min(lb),max(ub))) else plot(tri[,1],type='l',main=main, xlab='j', pch=19, ylab='Trimmed Mean(j/n)', ylim=c(ylimmin,ylimmax))
lines(ub,lty=3)
lines(lb,lty=3)
grid()
dev.off()
load(file='createtable')
a<-table.start()
a<-table.row.start(a)
a<-table.element(a,'Central Tendency - Ungrouped Data',4,TRUE)
a<-table.row.end(a)
a<-table.row.start(a)
a<-table.element(a,'Measure',header=TRUE)
a<-table.element(a,'Value',header=TRUE)
a<-table.element(a,'S.E.',header=TRUE)
a<-table.element(a,'Value/S.E.',header=TRUE)
a<-table.row.end(a)
a<-table.row.start(a)
a<-table.element(a,hyperlink('arithmetic_mean.htm', 'Arithmetic Mean', 'click to view the definition of the Arithmetic Mean'),header=TRUE)
a<-table.element(a,arm)
a<-table.element(a,hyperlink('arithmetic_mean_standard_error.htm', armse, 'click to view the definition of the Standard Error of the Arithmetic Mean'))
a<-table.element(a,armose)
a<-table.row.end(a)
a<-table.row.start(a)
a<-table.element(a,hyperlink('geometric_mean.htm', 'Geometric Mean', 'click to view the definition of the Geometric Mean'),header=TRUE)
a<-table.element(a,geo)
a<-table.element(a,'')
a<-table.row.end(a)
a<-table.row.start(a)
a<-table.element(a,hyperlink('harmonic_mean.htm', 'Harmonic Mean', 'click to view the definition of the Harmonic Mean'),header=TRUE)
a<-table.element(a,har)
a<-table.element(a,'')
a<-table.row.end(a)
a<-table.row.start(a)
a<-table.element(a,hyperlink('quadratic_mean.htm', 'Quadratic Mean', 'click to view the definition of the Quadratic Mean'),header=TRUE)
a<-table.element(a,qua)
a<-table.element(a,'')
a<-table.row.end(a)
for (j in 1:length(win[,1])) {
a<-table.row.start(a)
mylabel <- paste('Winsorized Mean (',j)
mylabel <- paste(mylabel,'/')
mylabel <- paste(mylabel,length(win[,1]))
mylabel <- paste(mylabel,')')
a<-table.element(a,hyperlink('winsorized_mean.htm', mylabel, 'click to view the definition of the Winsorized Mean'),header=TRUE)
a<-table.element(a,win[j,1])
a<-table.element(a,win[j,2])
a<-table.element(a,win[j,1]/win[j,2])
a<-table.row.end(a)
}
for (j in 1:length(tri[,1])) {
a<-table.row.start(a)
mylabel <- paste('Trimmed Mean (',j)
mylabel <- paste(mylabel,'/')
mylabel <- paste(mylabel,length(tri[,1]))
mylabel <- paste(mylabel,')')
a<-table.element(a,hyperlink('arithmetic_mean.htm', mylabel, 'click to view the definition of the Trimmed Mean'),header=TRUE)
a<-table.element(a,tri[j,1])
a<-table.element(a,tri[j,2])
a<-table.element(a,tri[j,1]/tri[j,2])
a<-table.row.end(a)
}
a<-table.row.start(a)
a<-table.element(a,hyperlink('median_1.htm', 'Median', 'click to view the definition of the Median'),header=TRUE)
a<-table.element(a,median(x))
a<-table.element(a,'')
a<-table.row.end(a)
a<-table.row.start(a)
a<-table.element(a,hyperlink('midrange.htm', 'Midrange', 'click to view the definition of the Midrange'),header=TRUE)
a<-table.element(a,midr)
a<-table.element(a,'')
a<-table.row.end(a)
a<-table.row.start(a)
mymid <- hyperlink('midmean.htm', 'Midmean', 'click to view the definition of the Midmean')
mylabel <- paste(mymid,hyperlink('method_1.htm','Weighted Average at Xnp',''),sep=' - ')
a<-table.element(a,mylabel,header=TRUE)
a<-table.element(a,midm[1])
a<-table.element(a,'')
a<-table.row.end(a)
a<-table.row.start(a)
mymid <- hyperlink('midmean.htm', 'Midmean', 'click to view the definition of the Midmean')
mylabel <- paste(mymid,hyperlink('method_2.htm','Weighted Average at X(n+1)p',''),sep=' - ')
a<-table.element(a,mylabel,header=TRUE)
a<-table.element(a,midm[2])
a<-table.element(a,'')
a<-table.row.end(a)
a<-table.row.start(a)
mymid <- hyperlink('midmean.htm', 'Midmean', 'click to view the definition of the Midmean')
mylabel <- paste(mymid,hyperlink('method_3.htm','Empirical Distribution Function',''),sep=' - ')
a<-table.element(a,mylabel,header=TRUE)
a<-table.element(a,midm[3])
a<-table.element(a,'')
a<-table.row.end(a)
a<-table.row.start(a)
mymid <- hyperlink('midmean.htm', 'Midmean', 'click to view the definition of the Midmean')
mylabel <- paste(mymid,hyperlink('method_4.htm','Empirical Distribution Function - Averaging',''),sep=' - ')
a<-table.element(a,mylabel,header=TRUE)
a<-table.element(a,midm[4])
a<-table.element(a,'')
a<-table.row.end(a)
a<-table.row.start(a)
mymid <- hyperlink('midmean.htm', 'Midmean', 'click to view the definition of the Midmean')
mylabel <- paste(mymid,hyperlink('method_5.htm','Empirical Distribution Function - Interpolation',''),sep=' - ')
a<-table.element(a,mylabel,header=TRUE)
a<-table.element(a,midm[5])
a<-table.element(a,'')
a<-table.row.end(a)
a<-table.row.start(a)
mymid <- hyperlink('midmean.htm', 'Midmean', 'click to view the definition of the Midmean')
mylabel <- paste(mymid,hyperlink('method_6.htm','Closest Observation',''),sep=' - ')
a<-table.element(a,mylabel,header=TRUE)
a<-table.element(a,midm[6])
a<-table.element(a,'')
a<-table.row.end(a)
a<-table.row.start(a)
mymid <- hyperlink('midmean.htm', 'Midmean', 'click to view the definition of the Midmean')
mylabel <- paste(mymid,hyperlink('method_7.htm','True Basic - Statistics Graphics Toolkit',''),sep=' - ')
a<-table.element(a,mylabel,header=TRUE)
a<-table.element(a,midm[7])
a<-table.element(a,'')
a<-table.row.end(a)
a<-table.row.start(a)
mymid <- hyperlink('midmean.htm', 'Midmean', 'click to view the definition of the Midmean')
mylabel <- paste(mymid,hyperlink('method_8.htm','MS Excel (old versions)',''),sep=' - ')
a<-table.element(a,mylabel,header=TRUE)
a<-table.element(a,midm[8])
a<-table.element(a,'')
a<-table.row.end(a)
a<-table.row.start(a)
a<-table.element(a,'Number of observations',header=TRUE)
a<-table.element(a,length(x))
a<-table.element(a,'')
a<-table.row.end(a)
a<-table.end(a)
table.save(a,file='mytable.tab')