Free Statistics
of Irreproducible Research!
Description of Statistical Computation | ||||||||||||||||||||||||||||||
|---|---|---|---|---|---|---|---|---|---|---|---|---|---|---|---|---|---|---|---|---|---|---|---|---|---|---|---|---|---|---|
| Author's title | ||||||||||||||||||||||||||||||
| Author | *Unverified author* | |||||||||||||||||||||||||||||
| R Software Module | rwasp_Reddy-Moores DAta.wasp | |||||||||||||||||||||||||||||
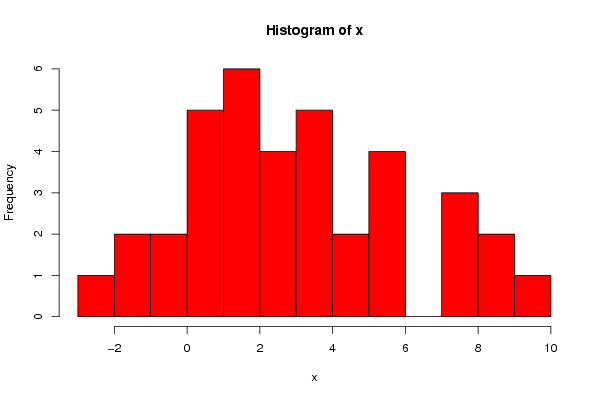
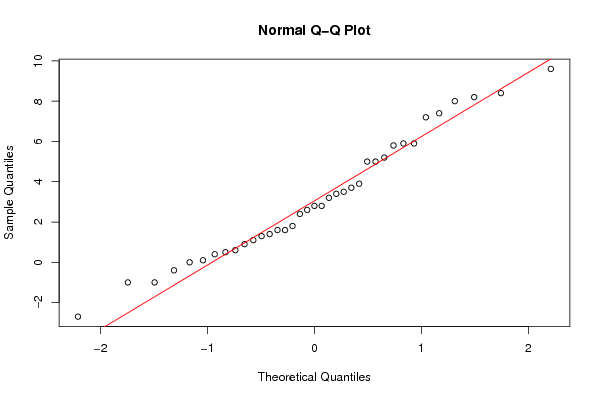
| Title produced by software | Histogram and QQPlot (Reddy-Moores Data) | |||||||||||||||||||||||||||||
| Date of computation | Fri, 04 Jun 2010 16:23:26 +0000 | |||||||||||||||||||||||||||||
| Cite this page as follows | Statistical Computations at FreeStatistics.org, Office for Research Development and Education, URL https://freestatistics.org/blog/index.php?v=date/2010/Jun/04/t1275668719tcc7ndpcnzkhq1q.htm/, Retrieved Sun, 28 Apr 2024 19:31:10 +0000 | |||||||||||||||||||||||||||||
| Statistical Computations at FreeStatistics.org, Office for Research Development and Education, URL https://freestatistics.org/blog/index.php?pk=77473, Retrieved Sun, 28 Apr 2024 19:31:10 +0000 | ||||||||||||||||||||||||||||||
| QR Codes: | ||||||||||||||||||||||||||||||
|
| ||||||||||||||||||||||||||||||
| Original text written by user: | ||||||||||||||||||||||||||||||
| IsPrivate? | No (this computation is public) | |||||||||||||||||||||||||||||
| User-defined keywords | ||||||||||||||||||||||||||||||
| Estimated Impact | 122 | |||||||||||||||||||||||||||||
Tree of Dependent Computations | ||||||||||||||||||||||||||||||
| Family? (F = Feedback message, R = changed R code, M = changed R Module, P = changed Parameters, D = changed Data) | ||||||||||||||||||||||||||||||
| - [Histogram and QQPlot (Reddy-Moores Data)] [Obestity data - a...] [2010-06-04 16:23:26] [d41d8cd98f00b204e9800998ecf8427e] [Current] - D [Histogram and QQPlot (Reddy-Moores Data)] [Obestity data - G...] [2010-06-04 16:31:49] [98fd0e87c3eb04e0cc2efde01dbafab6] - RMPD [Kolmogorov-Smirnov Test] [Obestity data - K...] [2010-06-04 17:33:55] [98fd0e87c3eb04e0cc2efde01dbafab6] - RM D [Aston University Statistical Software] [Obseity data - gr...] [2010-06-04 17:42:29] [98fd0e87c3eb04e0cc2efde01dbafab6] - RM D [T-Tests] [obesity weight lo...] [2010-06-04 18:00:35] [98fd0e87c3eb04e0cc2efde01dbafab6] - R D [T-Tests] [obesity data - on...] [2010-06-04 18:14:50] [98fd0e87c3eb04e0cc2efde01dbafab6] - RM D [One-Way-Between-Groups ANOVA- Free Statistics Software (Calculator)] [obestity data ANOVA] [2010-06-04 18:31:09] [98fd0e87c3eb04e0cc2efde01dbafab6] | ||||||||||||||||||||||||||||||
| Feedback Forum | ||||||||||||||||||||||||||||||
Post a new message | ||||||||||||||||||||||||||||||
Dataset | ||||||||||||||||||||||||||||||
| Dataseries X: | ||||||||||||||||||||||||||||||
-2.7 -1.0 -1.0 -0.4 0.1 0.4 0.5 0.6 0.9 1.1 1.3 1.4 1.6 1.6 3.4 3.5 3.7 5.0 5.9 0.0 1.8 2.4 2.6 2.8 2.8 3.2 3.9 5.0 5.2 5.8 5.9 7.2 7.4 8.0 8.2 8.4 9.6 | ||||||||||||||||||||||||||||||
Tables (Output of Computation) | ||||||||||||||||||||||||||||||
| ||||||||||||||||||||||||||||||
Figures (Output of Computation) | ||||||||||||||||||||||||||||||
Input Parameters & R Code | ||||||||||||||||||||||||||||||
| Parameters (Session): | ||||||||||||||||||||||||||||||
| par1 = 10 ; | ||||||||||||||||||||||||||||||
| Parameters (R input): | ||||||||||||||||||||||||||||||
| par1 = 10 ; | ||||||||||||||||||||||||||||||
| R code (references can be found in the software module): | ||||||||||||||||||||||||||||||
bitmap(file='test1.png') | ||||||||||||||||||||||||||||||