Free Statistics

of Irreproducible Research!

Author's title

Author*Unverified author*
R Software Modulerwasp_autocorrelation.wasp
Title produced by software(Partial) Autocorrelation Function
Date of computationFri, 04 Jun 2010 14:21:30 +0000
Cite this page as followsStatistical Computations at FreeStatistics.org, Office for Research Development and Education, URL https://freestatistics.org/blog/index.php?v=date/2010/Jun/04/t1275661450yp6d9tm6scj2oz9.htm/, Retrieved Sun, 28 Apr 2024 22:14:32 +0000
Statistical Computations at FreeStatistics.org, Office for Research Development and Education, URL https://freestatistics.org/blog/index.php?pk=77458, Retrieved Sun, 28 Apr 2024 22:14:32 +0000
QR Codes:

Original text written by user:
IsPrivate?No (this computation is public)
User-defined keywordsKDGP2W21
Estimated Impact173
Family? (F = Feedback message, R = changed R code, M = changed R Module, P = changed Parameters, D = changed Data)
-       [(Partial) Autocorrelation Function] [] [2010-06-04 14:21:30] [07915b1f88a41fb8d82e27c5eaa7bbed] [Current]
Feedback Forum

Post a new message
Dataseries X:
25000
25284
12434.5
33955
14980.5
50831
4198.5
34566
35000
11055.5
20807
21887.29
16977.5
19613.5
14570
24416.5
16825.5
13980
21450.5
27239.5
19078.5
20459.1
20373.5
19306.5
16723.16
11638
20917
17903.5
28218.5
15268
21555
23143
16691
17932.5
30512
41931.5
10853.5
25939.5
14900
25127.76
22063.5
25306.5
31217.5
23201.5
38148
26264
16359
27945.5
16218.5
36003.5
20323.5
20100.5
18741
24426.75
19174.5
13766
18999
21745
34469
13248
16218.5
36003.5
20323.5
20100.5
18741
24426.75
19174.5
13766
18999
21745
34469
13248


Summary of computational transaction
Raw Inputview raw input (R code)
Raw Outputview raw output of R engine
Computing time1 seconds
R Server'RServer@AstonUniversity' @ vre.aston.ac.uk

\begin{tabular}{lllllllll}
\hline
Summary of computational transaction \tabularnewline
Raw Input & view raw input (R code)  \tabularnewline
Raw Output & view raw output of R engine  \tabularnewline
Computing time & 1 seconds \tabularnewline
R Server & 'RServer@AstonUniversity' @ vre.aston.ac.uk \tabularnewline
\hline
\end{tabular}
%Source: https://freestatistics.org/blog/index.php?pk=77458&T=0

[TABLE]
[ROW][C]Summary of computational transaction[/C][/ROW]
[ROW][C]Raw Input[/C][C]view raw input (R code) [/C][/ROW]
[ROW][C]Raw Output[/C][C]view raw output of R engine [/C][/ROW]
[ROW][C]Computing time[/C][C]1 seconds[/C][/ROW]
[ROW][C]R Server[/C][C]'RServer@AstonUniversity' @ vre.aston.ac.uk[/C][/ROW]
[/TABLE]
Source: https://freestatistics.org/blog/index.php?pk=77458&T=0

Globally Unique Identifier (entire table): ba.freestatistics.org/blog/index.php?pk=77458&T=0

As an alternative you can also use a QR Code:  

The GUIDs for individual cells are displayed in the table below:

Summary of computational transaction
Raw Inputview raw input (R code)
Raw Outputview raw output of R engine
Computing time1 seconds
R Server'RServer@AstonUniversity' @ vre.aston.ac.uk


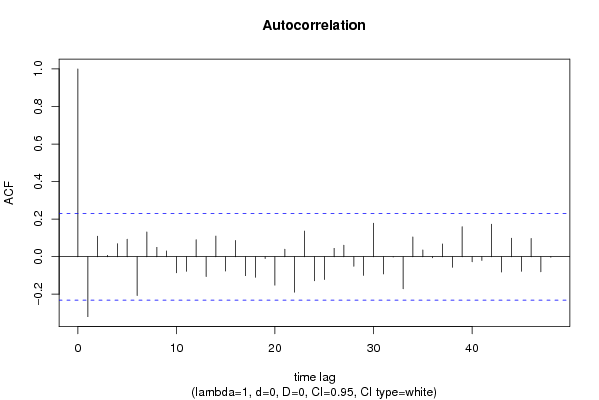
Autocorrelation Function
Time lag kACF(k)T-STATP-value
1-0.319417-2.71030.004198
20.1091860.92650.178648
30.0071950.0610.475744
40.0689260.58490.280238
50.092580.78560.217349
6-0.206958-1.75610.041662
70.1316191.11680.133892
80.049720.42190.337183
90.0303560.25760.398732
10-0.085884-0.72880.234258
11-0.077371-0.65650.256793
120.0904460.76750.222659
13-0.105918-0.89870.185893
140.1096640.93050.177603
15-0.076877-0.65230.258135
160.0867210.73590.232106
17-0.10091-0.85630.19735
18-0.110125-0.93440.176599
19-0.009882-0.08390.466703
20-0.151628-1.28660.101177
210.0396850.33670.368645
22-0.18907-1.60430.056512
230.1362181.15580.125783
24-0.127969-1.08590.140584
25-0.122179-1.03670.151667
260.0444750.37740.3535
270.0606410.51460.30422
28-0.051558-0.43750.331535
29-0.099849-0.84720.199832
300.1786411.51580.066972
31-0.091764-0.77860.21937
32-0.002336-0.01980.492121
33-0.170605-1.44760.07603
340.1052780.89330.187334
350.035540.30160.381927
36-0.006314-0.05360.478711
370.0673030.57110.284859
38-0.056744-0.48150.315815
390.1599571.35730.089466
40-0.027404-0.23250.408394
41-0.019709-0.16720.433827
420.1728361.46660.073425
43-0.081854-0.69460.244785
440.098190.83320.203753
45-0.077798-0.66010.255636
460.097470.82710.205468
47-0.080891-0.68640.247338
48-0.003333-0.02830.488759

\begin{tabular}{lllllllll}
\hline
Autocorrelation Function \tabularnewline
Time lag k & ACF(k) & T-STAT & P-value \tabularnewline
1 & -0.319417 & -2.7103 & 0.004198 \tabularnewline
2 & 0.109186 & 0.9265 & 0.178648 \tabularnewline
3 & 0.007195 & 0.061 & 0.475744 \tabularnewline
4 & 0.068926 & 0.5849 & 0.280238 \tabularnewline
5 & 0.09258 & 0.7856 & 0.217349 \tabularnewline
6 & -0.206958 & -1.7561 & 0.041662 \tabularnewline
7 & 0.131619 & 1.1168 & 0.133892 \tabularnewline
8 & 0.04972 & 0.4219 & 0.337183 \tabularnewline
9 & 0.030356 & 0.2576 & 0.398732 \tabularnewline
10 & -0.085884 & -0.7288 & 0.234258 \tabularnewline
11 & -0.077371 & -0.6565 & 0.256793 \tabularnewline
12 & 0.090446 & 0.7675 & 0.222659 \tabularnewline
13 & -0.105918 & -0.8987 & 0.185893 \tabularnewline
14 & 0.109664 & 0.9305 & 0.177603 \tabularnewline
15 & -0.076877 & -0.6523 & 0.258135 \tabularnewline
16 & 0.086721 & 0.7359 & 0.232106 \tabularnewline
17 & -0.10091 & -0.8563 & 0.19735 \tabularnewline
18 & -0.110125 & -0.9344 & 0.176599 \tabularnewline
19 & -0.009882 & -0.0839 & 0.466703 \tabularnewline
20 & -0.151628 & -1.2866 & 0.101177 \tabularnewline
21 & 0.039685 & 0.3367 & 0.368645 \tabularnewline
22 & -0.18907 & -1.6043 & 0.056512 \tabularnewline
23 & 0.136218 & 1.1558 & 0.125783 \tabularnewline
24 & -0.127969 & -1.0859 & 0.140584 \tabularnewline
25 & -0.122179 & -1.0367 & 0.151667 \tabularnewline
26 & 0.044475 & 0.3774 & 0.3535 \tabularnewline
27 & 0.060641 & 0.5146 & 0.30422 \tabularnewline
28 & -0.051558 & -0.4375 & 0.331535 \tabularnewline
29 & -0.099849 & -0.8472 & 0.199832 \tabularnewline
30 & 0.178641 & 1.5158 & 0.066972 \tabularnewline
31 & -0.091764 & -0.7786 & 0.21937 \tabularnewline
32 & -0.002336 & -0.0198 & 0.492121 \tabularnewline
33 & -0.170605 & -1.4476 & 0.07603 \tabularnewline
34 & 0.105278 & 0.8933 & 0.187334 \tabularnewline
35 & 0.03554 & 0.3016 & 0.381927 \tabularnewline
36 & -0.006314 & -0.0536 & 0.478711 \tabularnewline
37 & 0.067303 & 0.5711 & 0.284859 \tabularnewline
38 & -0.056744 & -0.4815 & 0.315815 \tabularnewline
39 & 0.159957 & 1.3573 & 0.089466 \tabularnewline
40 & -0.027404 & -0.2325 & 0.408394 \tabularnewline
41 & -0.019709 & -0.1672 & 0.433827 \tabularnewline
42 & 0.172836 & 1.4666 & 0.073425 \tabularnewline
43 & -0.081854 & -0.6946 & 0.244785 \tabularnewline
44 & 0.09819 & 0.8332 & 0.203753 \tabularnewline
45 & -0.077798 & -0.6601 & 0.255636 \tabularnewline
46 & 0.09747 & 0.8271 & 0.205468 \tabularnewline
47 & -0.080891 & -0.6864 & 0.247338 \tabularnewline
48 & -0.003333 & -0.0283 & 0.488759 \tabularnewline
\hline
\end{tabular}
%Source: https://freestatistics.org/blog/index.php?pk=77458&T=1

[TABLE]
[ROW][C]Autocorrelation Function[/C][/ROW]
[ROW][C]Time lag k[/C][C]ACF(k)[/C][C]T-STAT[/C][C]P-value[/C][/ROW]
[ROW][C]1[/C][C]-0.319417[/C][C]-2.7103[/C][C]0.004198[/C][/ROW]
[ROW][C]2[/C][C]0.109186[/C][C]0.9265[/C][C]0.178648[/C][/ROW]
[ROW][C]3[/C][C]0.007195[/C][C]0.061[/C][C]0.475744[/C][/ROW]
[ROW][C]4[/C][C]0.068926[/C][C]0.5849[/C][C]0.280238[/C][/ROW]
[ROW][C]5[/C][C]0.09258[/C][C]0.7856[/C][C]0.217349[/C][/ROW]
[ROW][C]6[/C][C]-0.206958[/C][C]-1.7561[/C][C]0.041662[/C][/ROW]
[ROW][C]7[/C][C]0.131619[/C][C]1.1168[/C][C]0.133892[/C][/ROW]
[ROW][C]8[/C][C]0.04972[/C][C]0.4219[/C][C]0.337183[/C][/ROW]
[ROW][C]9[/C][C]0.030356[/C][C]0.2576[/C][C]0.398732[/C][/ROW]
[ROW][C]10[/C][C]-0.085884[/C][C]-0.7288[/C][C]0.234258[/C][/ROW]
[ROW][C]11[/C][C]-0.077371[/C][C]-0.6565[/C][C]0.256793[/C][/ROW]
[ROW][C]12[/C][C]0.090446[/C][C]0.7675[/C][C]0.222659[/C][/ROW]
[ROW][C]13[/C][C]-0.105918[/C][C]-0.8987[/C][C]0.185893[/C][/ROW]
[ROW][C]14[/C][C]0.109664[/C][C]0.9305[/C][C]0.177603[/C][/ROW]
[ROW][C]15[/C][C]-0.076877[/C][C]-0.6523[/C][C]0.258135[/C][/ROW]
[ROW][C]16[/C][C]0.086721[/C][C]0.7359[/C][C]0.232106[/C][/ROW]
[ROW][C]17[/C][C]-0.10091[/C][C]-0.8563[/C][C]0.19735[/C][/ROW]
[ROW][C]18[/C][C]-0.110125[/C][C]-0.9344[/C][C]0.176599[/C][/ROW]
[ROW][C]19[/C][C]-0.009882[/C][C]-0.0839[/C][C]0.466703[/C][/ROW]
[ROW][C]20[/C][C]-0.151628[/C][C]-1.2866[/C][C]0.101177[/C][/ROW]
[ROW][C]21[/C][C]0.039685[/C][C]0.3367[/C][C]0.368645[/C][/ROW]
[ROW][C]22[/C][C]-0.18907[/C][C]-1.6043[/C][C]0.056512[/C][/ROW]
[ROW][C]23[/C][C]0.136218[/C][C]1.1558[/C][C]0.125783[/C][/ROW]
[ROW][C]24[/C][C]-0.127969[/C][C]-1.0859[/C][C]0.140584[/C][/ROW]
[ROW][C]25[/C][C]-0.122179[/C][C]-1.0367[/C][C]0.151667[/C][/ROW]
[ROW][C]26[/C][C]0.044475[/C][C]0.3774[/C][C]0.3535[/C][/ROW]
[ROW][C]27[/C][C]0.060641[/C][C]0.5146[/C][C]0.30422[/C][/ROW]
[ROW][C]28[/C][C]-0.051558[/C][C]-0.4375[/C][C]0.331535[/C][/ROW]
[ROW][C]29[/C][C]-0.099849[/C][C]-0.8472[/C][C]0.199832[/C][/ROW]
[ROW][C]30[/C][C]0.178641[/C][C]1.5158[/C][C]0.066972[/C][/ROW]
[ROW][C]31[/C][C]-0.091764[/C][C]-0.7786[/C][C]0.21937[/C][/ROW]
[ROW][C]32[/C][C]-0.002336[/C][C]-0.0198[/C][C]0.492121[/C][/ROW]
[ROW][C]33[/C][C]-0.170605[/C][C]-1.4476[/C][C]0.07603[/C][/ROW]
[ROW][C]34[/C][C]0.105278[/C][C]0.8933[/C][C]0.187334[/C][/ROW]
[ROW][C]35[/C][C]0.03554[/C][C]0.3016[/C][C]0.381927[/C][/ROW]
[ROW][C]36[/C][C]-0.006314[/C][C]-0.0536[/C][C]0.478711[/C][/ROW]
[ROW][C]37[/C][C]0.067303[/C][C]0.5711[/C][C]0.284859[/C][/ROW]
[ROW][C]38[/C][C]-0.056744[/C][C]-0.4815[/C][C]0.315815[/C][/ROW]
[ROW][C]39[/C][C]0.159957[/C][C]1.3573[/C][C]0.089466[/C][/ROW]
[ROW][C]40[/C][C]-0.027404[/C][C]-0.2325[/C][C]0.408394[/C][/ROW]
[ROW][C]41[/C][C]-0.019709[/C][C]-0.1672[/C][C]0.433827[/C][/ROW]
[ROW][C]42[/C][C]0.172836[/C][C]1.4666[/C][C]0.073425[/C][/ROW]
[ROW][C]43[/C][C]-0.081854[/C][C]-0.6946[/C][C]0.244785[/C][/ROW]
[ROW][C]44[/C][C]0.09819[/C][C]0.8332[/C][C]0.203753[/C][/ROW]
[ROW][C]45[/C][C]-0.077798[/C][C]-0.6601[/C][C]0.255636[/C][/ROW]
[ROW][C]46[/C][C]0.09747[/C][C]0.8271[/C][C]0.205468[/C][/ROW]
[ROW][C]47[/C][C]-0.080891[/C][C]-0.6864[/C][C]0.247338[/C][/ROW]
[ROW][C]48[/C][C]-0.003333[/C][C]-0.0283[/C][C]0.488759[/C][/ROW]
[/TABLE]
Source: https://freestatistics.org/blog/index.php?pk=77458&T=1

Globally Unique Identifier (entire table): ba.freestatistics.org/blog/index.php?pk=77458&T=1

As an alternative you can also use a QR Code:  

The GUIDs for individual cells are displayed in the table below:

Autocorrelation Function
Time lag kACF(k)T-STATP-value
1-0.319417-2.71030.004198
20.1091860.92650.178648
30.0071950.0610.475744
40.0689260.58490.280238
50.092580.78560.217349
6-0.206958-1.75610.041662
70.1316191.11680.133892
80.049720.42190.337183
90.0303560.25760.398732
10-0.085884-0.72880.234258
11-0.077371-0.65650.256793
120.0904460.76750.222659
13-0.105918-0.89870.185893
140.1096640.93050.177603
15-0.076877-0.65230.258135
160.0867210.73590.232106
17-0.10091-0.85630.19735
18-0.110125-0.93440.176599
19-0.009882-0.08390.466703
20-0.151628-1.28660.101177
210.0396850.33670.368645
22-0.18907-1.60430.056512
230.1362181.15580.125783
24-0.127969-1.08590.140584
25-0.122179-1.03670.151667
260.0444750.37740.3535
270.0606410.51460.30422
28-0.051558-0.43750.331535
29-0.099849-0.84720.199832
300.1786411.51580.066972
31-0.091764-0.77860.21937
32-0.002336-0.01980.492121
33-0.170605-1.44760.07603
340.1052780.89330.187334
350.035540.30160.381927
36-0.006314-0.05360.478711
370.0673030.57110.284859
38-0.056744-0.48150.315815
390.1599571.35730.089466
40-0.027404-0.23250.408394
41-0.019709-0.16720.433827
420.1728361.46660.073425
43-0.081854-0.69460.244785
440.098190.83320.203753
45-0.077798-0.66010.255636
460.097470.82710.205468
47-0.080891-0.68640.247338
48-0.003333-0.02830.488759


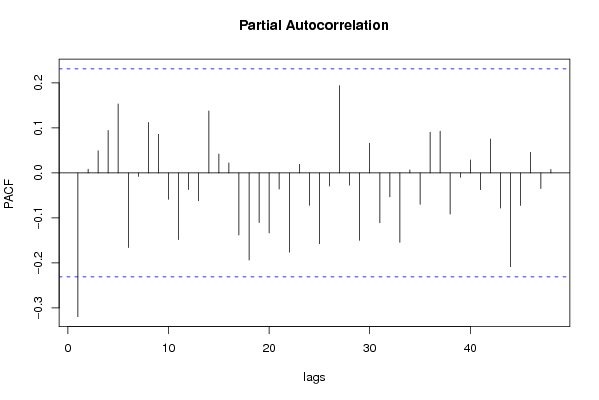
Partial Autocorrelation Function
Time lag kPACF(k)T-STATP-value
1-0.319417-2.71030.004198
20.0079720.06760.473129
30.049380.4190.338231
40.0942280.79950.213301
50.1532561.30040.098802
6-0.165787-1.40670.081902
7-0.007763-0.06590.473832
80.1122590.95250.172003
90.0856440.72670.234879
10-0.058652-0.49770.310114
11-0.148146-1.25710.106397
12-0.036821-0.31240.377806
13-0.061938-0.52560.300403
140.1376231.16780.123376
150.0418190.35480.36187
160.0220640.18720.426008
17-0.138197-1.17260.122402
18-0.193616-1.64290.052383
19-0.110102-0.93420.17665
20-0.133333-1.13140.130828
21-0.035883-0.30450.38082
22-0.176051-1.49380.069793
230.01940.16460.434854
24-0.071971-0.61070.271662
25-0.157418-1.33570.092921
26-0.029075-0.24670.402919
270.1935451.64230.052446
28-0.027168-0.23050.409167
29-0.149546-1.26890.104275
300.0661560.56130.288151
31-0.111019-0.9420.174664
32-0.052963-0.44940.327244
33-0.154084-1.30740.09761
340.0064570.05480.478228
35-0.069516-0.58990.278564
360.0903740.76680.222839
370.0924780.78470.217601
38-0.0915-0.77640.220028
39-0.009853-0.08360.4668
400.0289320.24550.403386
41-0.037242-0.3160.376456
420.0751460.63760.262868
43-0.077855-0.66060.255483
44-0.208261-1.76720.04072
45-0.072188-0.61250.271057
460.0456870.38770.349703
47-0.034754-0.29490.38446
480.0078050.06620.473691

\begin{tabular}{lllllllll}
\hline
Partial Autocorrelation Function \tabularnewline
Time lag k & PACF(k) & T-STAT & P-value \tabularnewline
1 & -0.319417 & -2.7103 & 0.004198 \tabularnewline
2 & 0.007972 & 0.0676 & 0.473129 \tabularnewline
3 & 0.04938 & 0.419 & 0.338231 \tabularnewline
4 & 0.094228 & 0.7995 & 0.213301 \tabularnewline
5 & 0.153256 & 1.3004 & 0.098802 \tabularnewline
6 & -0.165787 & -1.4067 & 0.081902 \tabularnewline
7 & -0.007763 & -0.0659 & 0.473832 \tabularnewline
8 & 0.112259 & 0.9525 & 0.172003 \tabularnewline
9 & 0.085644 & 0.7267 & 0.234879 \tabularnewline
10 & -0.058652 & -0.4977 & 0.310114 \tabularnewline
11 & -0.148146 & -1.2571 & 0.106397 \tabularnewline
12 & -0.036821 & -0.3124 & 0.377806 \tabularnewline
13 & -0.061938 & -0.5256 & 0.300403 \tabularnewline
14 & 0.137623 & 1.1678 & 0.123376 \tabularnewline
15 & 0.041819 & 0.3548 & 0.36187 \tabularnewline
16 & 0.022064 & 0.1872 & 0.426008 \tabularnewline
17 & -0.138197 & -1.1726 & 0.122402 \tabularnewline
18 & -0.193616 & -1.6429 & 0.052383 \tabularnewline
19 & -0.110102 & -0.9342 & 0.17665 \tabularnewline
20 & -0.133333 & -1.1314 & 0.130828 \tabularnewline
21 & -0.035883 & -0.3045 & 0.38082 \tabularnewline
22 & -0.176051 & -1.4938 & 0.069793 \tabularnewline
23 & 0.0194 & 0.1646 & 0.434854 \tabularnewline
24 & -0.071971 & -0.6107 & 0.271662 \tabularnewline
25 & -0.157418 & -1.3357 & 0.092921 \tabularnewline
26 & -0.029075 & -0.2467 & 0.402919 \tabularnewline
27 & 0.193545 & 1.6423 & 0.052446 \tabularnewline
28 & -0.027168 & -0.2305 & 0.409167 \tabularnewline
29 & -0.149546 & -1.2689 & 0.104275 \tabularnewline
30 & 0.066156 & 0.5613 & 0.288151 \tabularnewline
31 & -0.111019 & -0.942 & 0.174664 \tabularnewline
32 & -0.052963 & -0.4494 & 0.327244 \tabularnewline
33 & -0.154084 & -1.3074 & 0.09761 \tabularnewline
34 & 0.006457 & 0.0548 & 0.478228 \tabularnewline
35 & -0.069516 & -0.5899 & 0.278564 \tabularnewline
36 & 0.090374 & 0.7668 & 0.222839 \tabularnewline
37 & 0.092478 & 0.7847 & 0.217601 \tabularnewline
38 & -0.0915 & -0.7764 & 0.220028 \tabularnewline
39 & -0.009853 & -0.0836 & 0.4668 \tabularnewline
40 & 0.028932 & 0.2455 & 0.403386 \tabularnewline
41 & -0.037242 & -0.316 & 0.376456 \tabularnewline
42 & 0.075146 & 0.6376 & 0.262868 \tabularnewline
43 & -0.077855 & -0.6606 & 0.255483 \tabularnewline
44 & -0.208261 & -1.7672 & 0.04072 \tabularnewline
45 & -0.072188 & -0.6125 & 0.271057 \tabularnewline
46 & 0.045687 & 0.3877 & 0.349703 \tabularnewline
47 & -0.034754 & -0.2949 & 0.38446 \tabularnewline
48 & 0.007805 & 0.0662 & 0.473691 \tabularnewline
\hline
\end{tabular}
%Source: https://freestatistics.org/blog/index.php?pk=77458&T=2

[TABLE]
[ROW][C]Partial Autocorrelation Function[/C][/ROW]
[ROW][C]Time lag k[/C][C]PACF(k)[/C][C]T-STAT[/C][C]P-value[/C][/ROW]
[ROW][C]1[/C][C]-0.319417[/C][C]-2.7103[/C][C]0.004198[/C][/ROW]
[ROW][C]2[/C][C]0.007972[/C][C]0.0676[/C][C]0.473129[/C][/ROW]
[ROW][C]3[/C][C]0.04938[/C][C]0.419[/C][C]0.338231[/C][/ROW]
[ROW][C]4[/C][C]0.094228[/C][C]0.7995[/C][C]0.213301[/C][/ROW]
[ROW][C]5[/C][C]0.153256[/C][C]1.3004[/C][C]0.098802[/C][/ROW]
[ROW][C]6[/C][C]-0.165787[/C][C]-1.4067[/C][C]0.081902[/C][/ROW]
[ROW][C]7[/C][C]-0.007763[/C][C]-0.0659[/C][C]0.473832[/C][/ROW]
[ROW][C]8[/C][C]0.112259[/C][C]0.9525[/C][C]0.172003[/C][/ROW]
[ROW][C]9[/C][C]0.085644[/C][C]0.7267[/C][C]0.234879[/C][/ROW]
[ROW][C]10[/C][C]-0.058652[/C][C]-0.4977[/C][C]0.310114[/C][/ROW]
[ROW][C]11[/C][C]-0.148146[/C][C]-1.2571[/C][C]0.106397[/C][/ROW]
[ROW][C]12[/C][C]-0.036821[/C][C]-0.3124[/C][C]0.377806[/C][/ROW]
[ROW][C]13[/C][C]-0.061938[/C][C]-0.5256[/C][C]0.300403[/C][/ROW]
[ROW][C]14[/C][C]0.137623[/C][C]1.1678[/C][C]0.123376[/C][/ROW]
[ROW][C]15[/C][C]0.041819[/C][C]0.3548[/C][C]0.36187[/C][/ROW]
[ROW][C]16[/C][C]0.022064[/C][C]0.1872[/C][C]0.426008[/C][/ROW]
[ROW][C]17[/C][C]-0.138197[/C][C]-1.1726[/C][C]0.122402[/C][/ROW]
[ROW][C]18[/C][C]-0.193616[/C][C]-1.6429[/C][C]0.052383[/C][/ROW]
[ROW][C]19[/C][C]-0.110102[/C][C]-0.9342[/C][C]0.17665[/C][/ROW]
[ROW][C]20[/C][C]-0.133333[/C][C]-1.1314[/C][C]0.130828[/C][/ROW]
[ROW][C]21[/C][C]-0.035883[/C][C]-0.3045[/C][C]0.38082[/C][/ROW]
[ROW][C]22[/C][C]-0.176051[/C][C]-1.4938[/C][C]0.069793[/C][/ROW]
[ROW][C]23[/C][C]0.0194[/C][C]0.1646[/C][C]0.434854[/C][/ROW]
[ROW][C]24[/C][C]-0.071971[/C][C]-0.6107[/C][C]0.271662[/C][/ROW]
[ROW][C]25[/C][C]-0.157418[/C][C]-1.3357[/C][C]0.092921[/C][/ROW]
[ROW][C]26[/C][C]-0.029075[/C][C]-0.2467[/C][C]0.402919[/C][/ROW]
[ROW][C]27[/C][C]0.193545[/C][C]1.6423[/C][C]0.052446[/C][/ROW]
[ROW][C]28[/C][C]-0.027168[/C][C]-0.2305[/C][C]0.409167[/C][/ROW]
[ROW][C]29[/C][C]-0.149546[/C][C]-1.2689[/C][C]0.104275[/C][/ROW]
[ROW][C]30[/C][C]0.066156[/C][C]0.5613[/C][C]0.288151[/C][/ROW]
[ROW][C]31[/C][C]-0.111019[/C][C]-0.942[/C][C]0.174664[/C][/ROW]
[ROW][C]32[/C][C]-0.052963[/C][C]-0.4494[/C][C]0.327244[/C][/ROW]
[ROW][C]33[/C][C]-0.154084[/C][C]-1.3074[/C][C]0.09761[/C][/ROW]
[ROW][C]34[/C][C]0.006457[/C][C]0.0548[/C][C]0.478228[/C][/ROW]
[ROW][C]35[/C][C]-0.069516[/C][C]-0.5899[/C][C]0.278564[/C][/ROW]
[ROW][C]36[/C][C]0.090374[/C][C]0.7668[/C][C]0.222839[/C][/ROW]
[ROW][C]37[/C][C]0.092478[/C][C]0.7847[/C][C]0.217601[/C][/ROW]
[ROW][C]38[/C][C]-0.0915[/C][C]-0.7764[/C][C]0.220028[/C][/ROW]
[ROW][C]39[/C][C]-0.009853[/C][C]-0.0836[/C][C]0.4668[/C][/ROW]
[ROW][C]40[/C][C]0.028932[/C][C]0.2455[/C][C]0.403386[/C][/ROW]
[ROW][C]41[/C][C]-0.037242[/C][C]-0.316[/C][C]0.376456[/C][/ROW]
[ROW][C]42[/C][C]0.075146[/C][C]0.6376[/C][C]0.262868[/C][/ROW]
[ROW][C]43[/C][C]-0.077855[/C][C]-0.6606[/C][C]0.255483[/C][/ROW]
[ROW][C]44[/C][C]-0.208261[/C][C]-1.7672[/C][C]0.04072[/C][/ROW]
[ROW][C]45[/C][C]-0.072188[/C][C]-0.6125[/C][C]0.271057[/C][/ROW]
[ROW][C]46[/C][C]0.045687[/C][C]0.3877[/C][C]0.349703[/C][/ROW]
[ROW][C]47[/C][C]-0.034754[/C][C]-0.2949[/C][C]0.38446[/C][/ROW]
[ROW][C]48[/C][C]0.007805[/C][C]0.0662[/C][C]0.473691[/C][/ROW]
[/TABLE]
Source: https://freestatistics.org/blog/index.php?pk=77458&T=2

Globally Unique Identifier (entire table): ba.freestatistics.org/blog/index.php?pk=77458&T=2

As an alternative you can also use a QR Code:  

The GUIDs for individual cells are displayed in the table below:

Partial Autocorrelation Function
Time lag kPACF(k)T-STATP-value
1-0.319417-2.71030.004198
20.0079720.06760.473129
30.049380.4190.338231
40.0942280.79950.213301
50.1532561.30040.098802
6-0.165787-1.40670.081902
7-0.007763-0.06590.473832
80.1122590.95250.172003
90.0856440.72670.234879
10-0.058652-0.49770.310114
11-0.148146-1.25710.106397
12-0.036821-0.31240.377806
13-0.061938-0.52560.300403
140.1376231.16780.123376
150.0418190.35480.36187
160.0220640.18720.426008
17-0.138197-1.17260.122402
18-0.193616-1.64290.052383
19-0.110102-0.93420.17665
20-0.133333-1.13140.130828
21-0.035883-0.30450.38082
22-0.176051-1.49380.069793
230.01940.16460.434854
24-0.071971-0.61070.271662
25-0.157418-1.33570.092921
26-0.029075-0.24670.402919
270.1935451.64230.052446
28-0.027168-0.23050.409167
29-0.149546-1.26890.104275
300.0661560.56130.288151
31-0.111019-0.9420.174664
32-0.052963-0.44940.327244
33-0.154084-1.30740.09761
340.0064570.05480.478228
35-0.069516-0.58990.278564
360.0903740.76680.222839
370.0924780.78470.217601
38-0.0915-0.77640.220028
39-0.009853-0.08360.4668
400.0289320.24550.403386
41-0.037242-0.3160.376456
420.0751460.63760.262868
43-0.077855-0.66060.255483
44-0.208261-1.76720.04072
45-0.072188-0.61250.271057
460.0456870.38770.349703
47-0.034754-0.29490.38446
480.0078050.06620.473691


Parameters (Session):
par1 = 48 ; par2 = 1 ; par3 = 0 ; par4 = 0 ; par5 = 12 ; par6 = White Noise ; par7 = 0.95 ;
Parameters (R input):
par1 = 48 ; par2 = 1 ; par3 = 0 ; par4 = 0 ; par5 = 12 ; par6 = White Noise ; par7 = 0.95 ;
R code (references can be found in the software module):
if (par1 == 'Default') {
par1 = 10*log10(length(x))
} else {
par1 <- as.numeric(par1)
}
par2 <- as.numeric(par2)
par3 <- as.numeric(par3)
par4 <- as.numeric(par4)
par5 <- as.numeric(par5)
if (par6 == 'White Noise') par6 <- 'white' else par6 <- 'ma'
par7 <- as.numeric(par7)
if (par2 == 0) {
x <- log(x)
} else {
x <- (x ^ par2 - 1) / par2
}
if (par3 > 0) x <- diff(x,lag=1,difference=par3)
if (par4 > 0) x <- diff(x,lag=par5,difference=par4)
bitmap(file='pic1.png')
racf <- acf(x, par1, main='Autocorrelation', xlab='time lag', ylab='ACF', ci.type=par6, ci=par7, sub=paste('(lambda=',par2,', d=',par3,', D=',par4,', CI=', par7, ', CI type=',par6,')',sep=''))
dev.off()
bitmap(file='pic2.png')
rpacf <- pacf(x,par1,main='Partial Autocorrelation',xlab='lags',ylab='PACF')
dev.off()
(myacf <- c(racf$acf))
(mypacf <- c(rpacf$acf))
lengthx <- length(x)
sqrtn <- sqrt(lengthx)
load(file='createtable')
a<-table.start()
a<-table.row.start(a)
a<-table.element(a,'Autocorrelation Function',4,TRUE)
a<-table.row.end(a)
a<-table.row.start(a)
a<-table.element(a,'Time lag k',header=TRUE)
a<-table.element(a,hyperlink('basics.htm','ACF(k)','click here for more information about the Autocorrelation Function'),header=TRUE)
a<-table.element(a,'T-STAT',header=TRUE)
a<-table.element(a,'P-value',header=TRUE)
a<-table.row.end(a)
for (i in 2:(par1+1)) {
a<-table.row.start(a)
a<-table.element(a,i-1,header=TRUE)
a<-table.element(a,round(myacf[i],6))
mytstat <- myacf[i]*sqrtn
a<-table.element(a,round(mytstat,4))
a<-table.element(a,round(1-pt(abs(mytstat),lengthx),6))
a<-table.row.end(a)
}
a<-table.end(a)
table.save(a,file='mytable.tab')
a<-table.start()
a<-table.row.start(a)
a<-table.element(a,'Partial Autocorrelation Function',4,TRUE)
a<-table.row.end(a)
a<-table.row.start(a)
a<-table.element(a,'Time lag k',header=TRUE)
a<-table.element(a,hyperlink('basics.htm','PACF(k)','click here for more information about the Partial Autocorrelation Function'),header=TRUE)
a<-table.element(a,'T-STAT',header=TRUE)
a<-table.element(a,'P-value',header=TRUE)
a<-table.row.end(a)
for (i in 1:par1) {
a<-table.row.start(a)
a<-table.element(a,i,header=TRUE)
a<-table.element(a,round(mypacf[i],6))
mytstat <- mypacf[i]*sqrtn
a<-table.element(a,round(mytstat,4))
a<-table.element(a,round(1-pt(abs(mytstat),lengthx),6))
a<-table.row.end(a)
}
a<-table.end(a)
table.save(a,file='mytable1.tab')