Free Statistics

of Irreproducible Research!

Author's title

Author*Unverified author*
R Software Modulerwasp_autocorrelation.wasp
Title produced by software(Partial) Autocorrelation Function
Date of computationFri, 04 Jun 2010 14:10:15 +0000
Cite this page as followsStatistical Computations at FreeStatistics.org, Office for Research Development and Education, URL https://freestatistics.org/blog/index.php?v=date/2010/Jun/04/t1275660831dif19q8xbm9378h.htm/, Retrieved Mon, 29 Apr 2024 01:04:08 +0000
Statistical Computations at FreeStatistics.org, Office for Research Development and Education, URL https://freestatistics.org/blog/index.php?pk=77456, Retrieved Mon, 29 Apr 2024 01:04:08 +0000
QR Codes:

Original text written by user:
IsPrivate?No (this computation is public)
User-defined keywordsKDGP2W21
Estimated Impact170
Family? (F = Feedback message, R = changed R code, M = changed R Module, P = changed Parameters, D = changed Data)
-       [(Partial) Autocorrelation Function] [] [2010-06-04 14:10:15] [07915b1f88a41fb8d82e27c5eaa7bbed] [Current]
Feedback Forum

Post a new message
Dataseries X:
25000
25284
12434,5
33955
14980,5
50831
4198,5
34566
35000
11055,5
20807
21887,29
16977,5
19613,5
14570
24416,5
16825,5
13980
21450,5
27239,5
19078,5
20459,1
20373,5
19306,5
16723,16
11638
20917
17903,5
28218,5
15268
21555
23143
16691
17932,5
30512
41931,5
10853,5
25939,5
14900
25127,76
22063,5
25306,5
31217,5
23201,5
38148
26264
16359
27945,5
16218,5
36003,5
20323,5
20100,5
18741
24426,75
19174,5
13766
18999
21745
34469
13248
16218,5
36003,5
20323,5
20100,5
18741
24426,75
19174,5
13766
18999
21745
34469
13248


Summary of computational transaction
Raw Inputview raw input (R code)
Raw Outputview raw output of R engine
Computing time1 seconds
R Server'George Udny Yule' @ 72.249.76.132

\begin{tabular}{lllllllll}
\hline
Summary of computational transaction \tabularnewline
Raw Input & view raw input (R code)  \tabularnewline
Raw Output & view raw output of R engine  \tabularnewline
Computing time & 1 seconds \tabularnewline
R Server & 'George Udny Yule' @ 72.249.76.132 \tabularnewline
\hline
\end{tabular}
%Source: https://freestatistics.org/blog/index.php?pk=77456&T=0

[TABLE]
[ROW][C]Summary of computational transaction[/C][/ROW]
[ROW][C]Raw Input[/C][C]view raw input (R code) [/C][/ROW]
[ROW][C]Raw Output[/C][C]view raw output of R engine [/C][/ROW]
[ROW][C]Computing time[/C][C]1 seconds[/C][/ROW]
[ROW][C]R Server[/C][C]'George Udny Yule' @ 72.249.76.132[/C][/ROW]
[/TABLE]
Source: https://freestatistics.org/blog/index.php?pk=77456&T=0

Globally Unique Identifier (entire table): ba.freestatistics.org/blog/index.php?pk=77456&T=0

As an alternative you can also use a QR Code:  

The GUIDs for individual cells are displayed in the table below:

Summary of computational transaction
Raw Inputview raw input (R code)
Raw Outputview raw output of R engine
Computing time1 seconds
R Server'George Udny Yule' @ 72.249.76.132


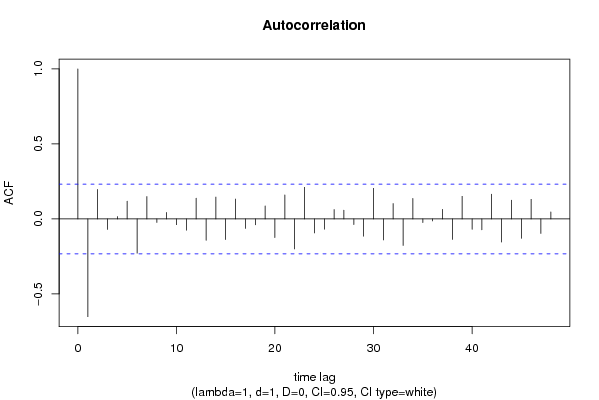
Autocorrelation Function
Time lag kACF(k)T-STATP-value
1-0.65185-5.49260
20.1965591.65620.051044
3-0.069852-0.58860.279006
40.0152950.12890.44891
50.1182040.9960.161314
6-0.22831-1.92380.029196
70.1488651.25440.106912
8-0.023213-0.19560.422742
90.0429970.36230.359102
10-0.038473-0.32420.373379
11-0.07543-0.63560.263545
120.1379651.16250.124459
13-0.142398-1.19990.11709
140.1455911.22680.111981
15-0.138098-1.16360.124234
160.1320351.11250.134828
17-0.063484-0.53490.297185
18-0.039788-0.33530.36921
190.0867170.73070.233687
20-0.124215-1.04670.149404
210.1601171.34920.090785
22-0.199986-1.68510.048179
230.2108961.7770.039923
24-0.093874-0.7910.215791
25-0.068524-0.57740.282749
260.0623660.52550.300436
270.0585010.49290.311787
28-0.037778-0.31830.375586
29-0.115687-0.97480.166485
300.2037191.71660.045209
31-0.140149-1.18090.120789
320.1021630.86080.196111
33-0.177316-1.49410.069791
340.1367191.1520.12659
35-0.024763-0.20870.417656
36-0.01386-0.11680.45368
370.0635680.53560.296944
38-0.136521-1.15030.12693
390.1506721.26960.104189
40-0.069138-0.58260.281016
41-0.072622-0.61190.27127
420.1644421.38560.085101
43-0.154699-1.30350.098304
440.1244931.0490.148869
45-0.129216-1.08880.139964
460.13051.09960.137608
47-0.097057-0.81780.208098
480.0466380.3930.347756

\begin{tabular}{lllllllll}
\hline
Autocorrelation Function \tabularnewline
Time lag k & ACF(k) & T-STAT & P-value \tabularnewline
1 & -0.65185 & -5.4926 & 0 \tabularnewline
2 & 0.196559 & 1.6562 & 0.051044 \tabularnewline
3 & -0.069852 & -0.5886 & 0.279006 \tabularnewline
4 & 0.015295 & 0.1289 & 0.44891 \tabularnewline
5 & 0.118204 & 0.996 & 0.161314 \tabularnewline
6 & -0.22831 & -1.9238 & 0.029196 \tabularnewline
7 & 0.148865 & 1.2544 & 0.106912 \tabularnewline
8 & -0.023213 & -0.1956 & 0.422742 \tabularnewline
9 & 0.042997 & 0.3623 & 0.359102 \tabularnewline
10 & -0.038473 & -0.3242 & 0.373379 \tabularnewline
11 & -0.07543 & -0.6356 & 0.263545 \tabularnewline
12 & 0.137965 & 1.1625 & 0.124459 \tabularnewline
13 & -0.142398 & -1.1999 & 0.11709 \tabularnewline
14 & 0.145591 & 1.2268 & 0.111981 \tabularnewline
15 & -0.138098 & -1.1636 & 0.124234 \tabularnewline
16 & 0.132035 & 1.1125 & 0.134828 \tabularnewline
17 & -0.063484 & -0.5349 & 0.297185 \tabularnewline
18 & -0.039788 & -0.3353 & 0.36921 \tabularnewline
19 & 0.086717 & 0.7307 & 0.233687 \tabularnewline
20 & -0.124215 & -1.0467 & 0.149404 \tabularnewline
21 & 0.160117 & 1.3492 & 0.090785 \tabularnewline
22 & -0.199986 & -1.6851 & 0.048179 \tabularnewline
23 & 0.210896 & 1.777 & 0.039923 \tabularnewline
24 & -0.093874 & -0.791 & 0.215791 \tabularnewline
25 & -0.068524 & -0.5774 & 0.282749 \tabularnewline
26 & 0.062366 & 0.5255 & 0.300436 \tabularnewline
27 & 0.058501 & 0.4929 & 0.311787 \tabularnewline
28 & -0.037778 & -0.3183 & 0.375586 \tabularnewline
29 & -0.115687 & -0.9748 & 0.166485 \tabularnewline
30 & 0.203719 & 1.7166 & 0.045209 \tabularnewline
31 & -0.140149 & -1.1809 & 0.120789 \tabularnewline
32 & 0.102163 & 0.8608 & 0.196111 \tabularnewline
33 & -0.177316 & -1.4941 & 0.069791 \tabularnewline
34 & 0.136719 & 1.152 & 0.12659 \tabularnewline
35 & -0.024763 & -0.2087 & 0.417656 \tabularnewline
36 & -0.01386 & -0.1168 & 0.45368 \tabularnewline
37 & 0.063568 & 0.5356 & 0.296944 \tabularnewline
38 & -0.136521 & -1.1503 & 0.12693 \tabularnewline
39 & 0.150672 & 1.2696 & 0.104189 \tabularnewline
40 & -0.069138 & -0.5826 & 0.281016 \tabularnewline
41 & -0.072622 & -0.6119 & 0.27127 \tabularnewline
42 & 0.164442 & 1.3856 & 0.085101 \tabularnewline
43 & -0.154699 & -1.3035 & 0.098304 \tabularnewline
44 & 0.124493 & 1.049 & 0.148869 \tabularnewline
45 & -0.129216 & -1.0888 & 0.139964 \tabularnewline
46 & 0.1305 & 1.0996 & 0.137608 \tabularnewline
47 & -0.097057 & -0.8178 & 0.208098 \tabularnewline
48 & 0.046638 & 0.393 & 0.347756 \tabularnewline
\hline
\end{tabular}
%Source: https://freestatistics.org/blog/index.php?pk=77456&T=1

[TABLE]
[ROW][C]Autocorrelation Function[/C][/ROW]
[ROW][C]Time lag k[/C][C]ACF(k)[/C][C]T-STAT[/C][C]P-value[/C][/ROW]
[ROW][C]1[/C][C]-0.65185[/C][C]-5.4926[/C][C]0[/C][/ROW]
[ROW][C]2[/C][C]0.196559[/C][C]1.6562[/C][C]0.051044[/C][/ROW]
[ROW][C]3[/C][C]-0.069852[/C][C]-0.5886[/C][C]0.279006[/C][/ROW]
[ROW][C]4[/C][C]0.015295[/C][C]0.1289[/C][C]0.44891[/C][/ROW]
[ROW][C]5[/C][C]0.118204[/C][C]0.996[/C][C]0.161314[/C][/ROW]
[ROW][C]6[/C][C]-0.22831[/C][C]-1.9238[/C][C]0.029196[/C][/ROW]
[ROW][C]7[/C][C]0.148865[/C][C]1.2544[/C][C]0.106912[/C][/ROW]
[ROW][C]8[/C][C]-0.023213[/C][C]-0.1956[/C][C]0.422742[/C][/ROW]
[ROW][C]9[/C][C]0.042997[/C][C]0.3623[/C][C]0.359102[/C][/ROW]
[ROW][C]10[/C][C]-0.038473[/C][C]-0.3242[/C][C]0.373379[/C][/ROW]
[ROW][C]11[/C][C]-0.07543[/C][C]-0.6356[/C][C]0.263545[/C][/ROW]
[ROW][C]12[/C][C]0.137965[/C][C]1.1625[/C][C]0.124459[/C][/ROW]
[ROW][C]13[/C][C]-0.142398[/C][C]-1.1999[/C][C]0.11709[/C][/ROW]
[ROW][C]14[/C][C]0.145591[/C][C]1.2268[/C][C]0.111981[/C][/ROW]
[ROW][C]15[/C][C]-0.138098[/C][C]-1.1636[/C][C]0.124234[/C][/ROW]
[ROW][C]16[/C][C]0.132035[/C][C]1.1125[/C][C]0.134828[/C][/ROW]
[ROW][C]17[/C][C]-0.063484[/C][C]-0.5349[/C][C]0.297185[/C][/ROW]
[ROW][C]18[/C][C]-0.039788[/C][C]-0.3353[/C][C]0.36921[/C][/ROW]
[ROW][C]19[/C][C]0.086717[/C][C]0.7307[/C][C]0.233687[/C][/ROW]
[ROW][C]20[/C][C]-0.124215[/C][C]-1.0467[/C][C]0.149404[/C][/ROW]
[ROW][C]21[/C][C]0.160117[/C][C]1.3492[/C][C]0.090785[/C][/ROW]
[ROW][C]22[/C][C]-0.199986[/C][C]-1.6851[/C][C]0.048179[/C][/ROW]
[ROW][C]23[/C][C]0.210896[/C][C]1.777[/C][C]0.039923[/C][/ROW]
[ROW][C]24[/C][C]-0.093874[/C][C]-0.791[/C][C]0.215791[/C][/ROW]
[ROW][C]25[/C][C]-0.068524[/C][C]-0.5774[/C][C]0.282749[/C][/ROW]
[ROW][C]26[/C][C]0.062366[/C][C]0.5255[/C][C]0.300436[/C][/ROW]
[ROW][C]27[/C][C]0.058501[/C][C]0.4929[/C][C]0.311787[/C][/ROW]
[ROW][C]28[/C][C]-0.037778[/C][C]-0.3183[/C][C]0.375586[/C][/ROW]
[ROW][C]29[/C][C]-0.115687[/C][C]-0.9748[/C][C]0.166485[/C][/ROW]
[ROW][C]30[/C][C]0.203719[/C][C]1.7166[/C][C]0.045209[/C][/ROW]
[ROW][C]31[/C][C]-0.140149[/C][C]-1.1809[/C][C]0.120789[/C][/ROW]
[ROW][C]32[/C][C]0.102163[/C][C]0.8608[/C][C]0.196111[/C][/ROW]
[ROW][C]33[/C][C]-0.177316[/C][C]-1.4941[/C][C]0.069791[/C][/ROW]
[ROW][C]34[/C][C]0.136719[/C][C]1.152[/C][C]0.12659[/C][/ROW]
[ROW][C]35[/C][C]-0.024763[/C][C]-0.2087[/C][C]0.417656[/C][/ROW]
[ROW][C]36[/C][C]-0.01386[/C][C]-0.1168[/C][C]0.45368[/C][/ROW]
[ROW][C]37[/C][C]0.063568[/C][C]0.5356[/C][C]0.296944[/C][/ROW]
[ROW][C]38[/C][C]-0.136521[/C][C]-1.1503[/C][C]0.12693[/C][/ROW]
[ROW][C]39[/C][C]0.150672[/C][C]1.2696[/C][C]0.104189[/C][/ROW]
[ROW][C]40[/C][C]-0.069138[/C][C]-0.5826[/C][C]0.281016[/C][/ROW]
[ROW][C]41[/C][C]-0.072622[/C][C]-0.6119[/C][C]0.27127[/C][/ROW]
[ROW][C]42[/C][C]0.164442[/C][C]1.3856[/C][C]0.085101[/C][/ROW]
[ROW][C]43[/C][C]-0.154699[/C][C]-1.3035[/C][C]0.098304[/C][/ROW]
[ROW][C]44[/C][C]0.124493[/C][C]1.049[/C][C]0.148869[/C][/ROW]
[ROW][C]45[/C][C]-0.129216[/C][C]-1.0888[/C][C]0.139964[/C][/ROW]
[ROW][C]46[/C][C]0.1305[/C][C]1.0996[/C][C]0.137608[/C][/ROW]
[ROW][C]47[/C][C]-0.097057[/C][C]-0.8178[/C][C]0.208098[/C][/ROW]
[ROW][C]48[/C][C]0.046638[/C][C]0.393[/C][C]0.347756[/C][/ROW]
[/TABLE]
Source: https://freestatistics.org/blog/index.php?pk=77456&T=1

Globally Unique Identifier (entire table): ba.freestatistics.org/blog/index.php?pk=77456&T=1

As an alternative you can also use a QR Code:  

The GUIDs for individual cells are displayed in the table below:

Autocorrelation Function
Time lag kACF(k)T-STATP-value
1-0.65185-5.49260
20.1965591.65620.051044
3-0.069852-0.58860.279006
40.0152950.12890.44891
50.1182040.9960.161314
6-0.22831-1.92380.029196
70.1488651.25440.106912
8-0.023213-0.19560.422742
90.0429970.36230.359102
10-0.038473-0.32420.373379
11-0.07543-0.63560.263545
120.1379651.16250.124459
13-0.142398-1.19990.11709
140.1455911.22680.111981
15-0.138098-1.16360.124234
160.1320351.11250.134828
17-0.063484-0.53490.297185
18-0.039788-0.33530.36921
190.0867170.73070.233687
20-0.124215-1.04670.149404
210.1601171.34920.090785
22-0.199986-1.68510.048179
230.2108961.7770.039923
24-0.093874-0.7910.215791
25-0.068524-0.57740.282749
260.0623660.52550.300436
270.0585010.49290.311787
28-0.037778-0.31830.375586
29-0.115687-0.97480.166485
300.2037191.71660.045209
31-0.140149-1.18090.120789
320.1021630.86080.196111
33-0.177316-1.49410.069791
340.1367191.1520.12659
35-0.024763-0.20870.417656
36-0.01386-0.11680.45368
370.0635680.53560.296944
38-0.136521-1.15030.12693
390.1506721.26960.104189
40-0.069138-0.58260.281016
41-0.072622-0.61190.27127
420.1644421.38560.085101
43-0.154699-1.30350.098304
440.1244931.0490.148869
45-0.129216-1.08880.139964
460.13051.09960.137608
47-0.097057-0.81780.208098
480.0466380.3930.347756


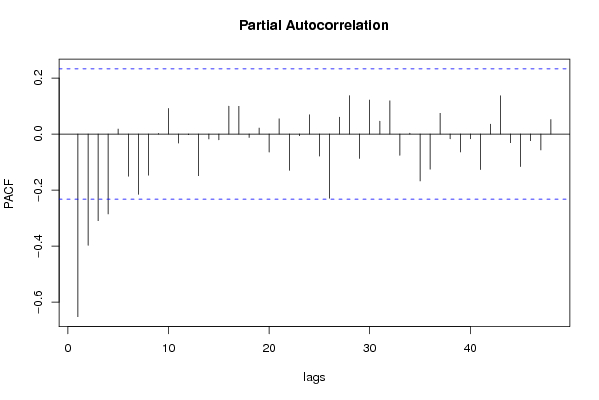
Partial Autocorrelation Function
Time lag kPACF(k)T-STATP-value
1-0.65185-5.49260
2-0.397068-3.34580.000657
3-0.308984-2.60350.005614
4-0.285146-2.40270.009446
50.0179650.15140.440053
6-0.150232-1.26590.104848
7-0.215089-1.81240.037079
8-0.146652-1.23570.11032
90.0023460.01980.492143
100.0914920.77090.221654
11-0.032161-0.2710.39359
12-0.002183-0.01840.492689
13-0.148424-1.25060.107585
14-0.017242-0.14530.442449
15-0.020283-0.17090.432391
160.0997920.84090.201623
170.0990110.83430.203461
18-0.01178-0.09930.460607
190.0214770.1810.428455
20-0.064315-0.54190.294783
210.054640.46040.323317
22-0.129245-1.0890.13991
23-0.005837-0.04920.480457
240.0690320.58170.281314
25-0.078301-0.65980.255767
26-0.22879-1.92780.028939
270.060540.51010.305775
280.1369751.15420.12615
29-0.087038-0.73340.232867
300.1213611.02260.154984
310.0462210.38950.34905
320.1187581.00070.160191
33-0.075599-0.6370.263083
340.0031660.02670.489395
35-0.167492-1.41130.081259
36-0.125516-1.05760.146907
370.0742450.62560.266791
38-0.016738-0.1410.444121
39-0.06395-0.53880.295838
40-0.017073-0.14390.44301
41-0.126591-1.06670.144866
420.0355280.29940.382768
430.1365941.1510.126804
44-0.030495-0.2570.398977
45-0.115871-0.97630.166103
46-0.023497-0.1980.42181
47-0.056439-0.47560.317921
480.0519480.43770.331459

\begin{tabular}{lllllllll}
\hline
Partial Autocorrelation Function \tabularnewline
Time lag k & PACF(k) & T-STAT & P-value \tabularnewline
1 & -0.65185 & -5.4926 & 0 \tabularnewline
2 & -0.397068 & -3.3458 & 0.000657 \tabularnewline
3 & -0.308984 & -2.6035 & 0.005614 \tabularnewline
4 & -0.285146 & -2.4027 & 0.009446 \tabularnewline
5 & 0.017965 & 0.1514 & 0.440053 \tabularnewline
6 & -0.150232 & -1.2659 & 0.104848 \tabularnewline
7 & -0.215089 & -1.8124 & 0.037079 \tabularnewline
8 & -0.146652 & -1.2357 & 0.11032 \tabularnewline
9 & 0.002346 & 0.0198 & 0.492143 \tabularnewline
10 & 0.091492 & 0.7709 & 0.221654 \tabularnewline
11 & -0.032161 & -0.271 & 0.39359 \tabularnewline
12 & -0.002183 & -0.0184 & 0.492689 \tabularnewline
13 & -0.148424 & -1.2506 & 0.107585 \tabularnewline
14 & -0.017242 & -0.1453 & 0.442449 \tabularnewline
15 & -0.020283 & -0.1709 & 0.432391 \tabularnewline
16 & 0.099792 & 0.8409 & 0.201623 \tabularnewline
17 & 0.099011 & 0.8343 & 0.203461 \tabularnewline
18 & -0.01178 & -0.0993 & 0.460607 \tabularnewline
19 & 0.021477 & 0.181 & 0.428455 \tabularnewline
20 & -0.064315 & -0.5419 & 0.294783 \tabularnewline
21 & 0.05464 & 0.4604 & 0.323317 \tabularnewline
22 & -0.129245 & -1.089 & 0.13991 \tabularnewline
23 & -0.005837 & -0.0492 & 0.480457 \tabularnewline
24 & 0.069032 & 0.5817 & 0.281314 \tabularnewline
25 & -0.078301 & -0.6598 & 0.255767 \tabularnewline
26 & -0.22879 & -1.9278 & 0.028939 \tabularnewline
27 & 0.06054 & 0.5101 & 0.305775 \tabularnewline
28 & 0.136975 & 1.1542 & 0.12615 \tabularnewline
29 & -0.087038 & -0.7334 & 0.232867 \tabularnewline
30 & 0.121361 & 1.0226 & 0.154984 \tabularnewline
31 & 0.046221 & 0.3895 & 0.34905 \tabularnewline
32 & 0.118758 & 1.0007 & 0.160191 \tabularnewline
33 & -0.075599 & -0.637 & 0.263083 \tabularnewline
34 & 0.003166 & 0.0267 & 0.489395 \tabularnewline
35 & -0.167492 & -1.4113 & 0.081259 \tabularnewline
36 & -0.125516 & -1.0576 & 0.146907 \tabularnewline
37 & 0.074245 & 0.6256 & 0.266791 \tabularnewline
38 & -0.016738 & -0.141 & 0.444121 \tabularnewline
39 & -0.06395 & -0.5388 & 0.295838 \tabularnewline
40 & -0.017073 & -0.1439 & 0.44301 \tabularnewline
41 & -0.126591 & -1.0667 & 0.144866 \tabularnewline
42 & 0.035528 & 0.2994 & 0.382768 \tabularnewline
43 & 0.136594 & 1.151 & 0.126804 \tabularnewline
44 & -0.030495 & -0.257 & 0.398977 \tabularnewline
45 & -0.115871 & -0.9763 & 0.166103 \tabularnewline
46 & -0.023497 & -0.198 & 0.42181 \tabularnewline
47 & -0.056439 & -0.4756 & 0.317921 \tabularnewline
48 & 0.051948 & 0.4377 & 0.331459 \tabularnewline
\hline
\end{tabular}
%Source: https://freestatistics.org/blog/index.php?pk=77456&T=2

[TABLE]
[ROW][C]Partial Autocorrelation Function[/C][/ROW]
[ROW][C]Time lag k[/C][C]PACF(k)[/C][C]T-STAT[/C][C]P-value[/C][/ROW]
[ROW][C]1[/C][C]-0.65185[/C][C]-5.4926[/C][C]0[/C][/ROW]
[ROW][C]2[/C][C]-0.397068[/C][C]-3.3458[/C][C]0.000657[/C][/ROW]
[ROW][C]3[/C][C]-0.308984[/C][C]-2.6035[/C][C]0.005614[/C][/ROW]
[ROW][C]4[/C][C]-0.285146[/C][C]-2.4027[/C][C]0.009446[/C][/ROW]
[ROW][C]5[/C][C]0.017965[/C][C]0.1514[/C][C]0.440053[/C][/ROW]
[ROW][C]6[/C][C]-0.150232[/C][C]-1.2659[/C][C]0.104848[/C][/ROW]
[ROW][C]7[/C][C]-0.215089[/C][C]-1.8124[/C][C]0.037079[/C][/ROW]
[ROW][C]8[/C][C]-0.146652[/C][C]-1.2357[/C][C]0.11032[/C][/ROW]
[ROW][C]9[/C][C]0.002346[/C][C]0.0198[/C][C]0.492143[/C][/ROW]
[ROW][C]10[/C][C]0.091492[/C][C]0.7709[/C][C]0.221654[/C][/ROW]
[ROW][C]11[/C][C]-0.032161[/C][C]-0.271[/C][C]0.39359[/C][/ROW]
[ROW][C]12[/C][C]-0.002183[/C][C]-0.0184[/C][C]0.492689[/C][/ROW]
[ROW][C]13[/C][C]-0.148424[/C][C]-1.2506[/C][C]0.107585[/C][/ROW]
[ROW][C]14[/C][C]-0.017242[/C][C]-0.1453[/C][C]0.442449[/C][/ROW]
[ROW][C]15[/C][C]-0.020283[/C][C]-0.1709[/C][C]0.432391[/C][/ROW]
[ROW][C]16[/C][C]0.099792[/C][C]0.8409[/C][C]0.201623[/C][/ROW]
[ROW][C]17[/C][C]0.099011[/C][C]0.8343[/C][C]0.203461[/C][/ROW]
[ROW][C]18[/C][C]-0.01178[/C][C]-0.0993[/C][C]0.460607[/C][/ROW]
[ROW][C]19[/C][C]0.021477[/C][C]0.181[/C][C]0.428455[/C][/ROW]
[ROW][C]20[/C][C]-0.064315[/C][C]-0.5419[/C][C]0.294783[/C][/ROW]
[ROW][C]21[/C][C]0.05464[/C][C]0.4604[/C][C]0.323317[/C][/ROW]
[ROW][C]22[/C][C]-0.129245[/C][C]-1.089[/C][C]0.13991[/C][/ROW]
[ROW][C]23[/C][C]-0.005837[/C][C]-0.0492[/C][C]0.480457[/C][/ROW]
[ROW][C]24[/C][C]0.069032[/C][C]0.5817[/C][C]0.281314[/C][/ROW]
[ROW][C]25[/C][C]-0.078301[/C][C]-0.6598[/C][C]0.255767[/C][/ROW]
[ROW][C]26[/C][C]-0.22879[/C][C]-1.9278[/C][C]0.028939[/C][/ROW]
[ROW][C]27[/C][C]0.06054[/C][C]0.5101[/C][C]0.305775[/C][/ROW]
[ROW][C]28[/C][C]0.136975[/C][C]1.1542[/C][C]0.12615[/C][/ROW]
[ROW][C]29[/C][C]-0.087038[/C][C]-0.7334[/C][C]0.232867[/C][/ROW]
[ROW][C]30[/C][C]0.121361[/C][C]1.0226[/C][C]0.154984[/C][/ROW]
[ROW][C]31[/C][C]0.046221[/C][C]0.3895[/C][C]0.34905[/C][/ROW]
[ROW][C]32[/C][C]0.118758[/C][C]1.0007[/C][C]0.160191[/C][/ROW]
[ROW][C]33[/C][C]-0.075599[/C][C]-0.637[/C][C]0.263083[/C][/ROW]
[ROW][C]34[/C][C]0.003166[/C][C]0.0267[/C][C]0.489395[/C][/ROW]
[ROW][C]35[/C][C]-0.167492[/C][C]-1.4113[/C][C]0.081259[/C][/ROW]
[ROW][C]36[/C][C]-0.125516[/C][C]-1.0576[/C][C]0.146907[/C][/ROW]
[ROW][C]37[/C][C]0.074245[/C][C]0.6256[/C][C]0.266791[/C][/ROW]
[ROW][C]38[/C][C]-0.016738[/C][C]-0.141[/C][C]0.444121[/C][/ROW]
[ROW][C]39[/C][C]-0.06395[/C][C]-0.5388[/C][C]0.295838[/C][/ROW]
[ROW][C]40[/C][C]-0.017073[/C][C]-0.1439[/C][C]0.44301[/C][/ROW]
[ROW][C]41[/C][C]-0.126591[/C][C]-1.0667[/C][C]0.144866[/C][/ROW]
[ROW][C]42[/C][C]0.035528[/C][C]0.2994[/C][C]0.382768[/C][/ROW]
[ROW][C]43[/C][C]0.136594[/C][C]1.151[/C][C]0.126804[/C][/ROW]
[ROW][C]44[/C][C]-0.030495[/C][C]-0.257[/C][C]0.398977[/C][/ROW]
[ROW][C]45[/C][C]-0.115871[/C][C]-0.9763[/C][C]0.166103[/C][/ROW]
[ROW][C]46[/C][C]-0.023497[/C][C]-0.198[/C][C]0.42181[/C][/ROW]
[ROW][C]47[/C][C]-0.056439[/C][C]-0.4756[/C][C]0.317921[/C][/ROW]
[ROW][C]48[/C][C]0.051948[/C][C]0.4377[/C][C]0.331459[/C][/ROW]
[/TABLE]
Source: https://freestatistics.org/blog/index.php?pk=77456&T=2

Globally Unique Identifier (entire table): ba.freestatistics.org/blog/index.php?pk=77456&T=2

As an alternative you can also use a QR Code:  

The GUIDs for individual cells are displayed in the table below:

Partial Autocorrelation Function
Time lag kPACF(k)T-STATP-value
1-0.65185-5.49260
2-0.397068-3.34580.000657
3-0.308984-2.60350.005614
4-0.285146-2.40270.009446
50.0179650.15140.440053
6-0.150232-1.26590.104848
7-0.215089-1.81240.037079
8-0.146652-1.23570.11032
90.0023460.01980.492143
100.0914920.77090.221654
11-0.032161-0.2710.39359
12-0.002183-0.01840.492689
13-0.148424-1.25060.107585
14-0.017242-0.14530.442449
15-0.020283-0.17090.432391
160.0997920.84090.201623
170.0990110.83430.203461
18-0.01178-0.09930.460607
190.0214770.1810.428455
20-0.064315-0.54190.294783
210.054640.46040.323317
22-0.129245-1.0890.13991
23-0.005837-0.04920.480457
240.0690320.58170.281314
25-0.078301-0.65980.255767
26-0.22879-1.92780.028939
270.060540.51010.305775
280.1369751.15420.12615
29-0.087038-0.73340.232867
300.1213611.02260.154984
310.0462210.38950.34905
320.1187581.00070.160191
33-0.075599-0.6370.263083
340.0031660.02670.489395
35-0.167492-1.41130.081259
36-0.125516-1.05760.146907
370.0742450.62560.266791
38-0.016738-0.1410.444121
39-0.06395-0.53880.295838
40-0.017073-0.14390.44301
41-0.126591-1.06670.144866
420.0355280.29940.382768
430.1365941.1510.126804
44-0.030495-0.2570.398977
45-0.115871-0.97630.166103
46-0.023497-0.1980.42181
47-0.056439-0.47560.317921
480.0519480.43770.331459


Parameters (Session):
par1 = 48 ; par2 = 1 ; par3 = 1 ; par4 = 0 ; par5 = 12 ; par6 = White Noise ; par7 = 0.95 ;
Parameters (R input):
par1 = 48 ; par2 = 1 ; par3 = 1 ; par4 = 0 ; par5 = 12 ; par6 = White Noise ; par7 = 0.95 ;
R code (references can be found in the software module):
if (par1 == 'Default') {
par1 = 10*log10(length(x))
} else {
par1 <- as.numeric(par1)
}
par2 <- as.numeric(par2)
par3 <- as.numeric(par3)
par4 <- as.numeric(par4)
par5 <- as.numeric(par5)
if (par6 == 'White Noise') par6 <- 'white' else par6 <- 'ma'
par7 <- as.numeric(par7)
if (par2 == 0) {
x <- log(x)
} else {
x <- (x ^ par2 - 1) / par2
}
if (par3 > 0) x <- diff(x,lag=1,difference=par3)
if (par4 > 0) x <- diff(x,lag=par5,difference=par4)
bitmap(file='pic1.png')
racf <- acf(x, par1, main='Autocorrelation', xlab='time lag', ylab='ACF', ci.type=par6, ci=par7, sub=paste('(lambda=',par2,', d=',par3,', D=',par4,', CI=', par7, ', CI type=',par6,')',sep=''))
dev.off()
bitmap(file='pic2.png')
rpacf <- pacf(x,par1,main='Partial Autocorrelation',xlab='lags',ylab='PACF')
dev.off()
(myacf <- c(racf$acf))
(mypacf <- c(rpacf$acf))
lengthx <- length(x)
sqrtn <- sqrt(lengthx)
load(file='createtable')
a<-table.start()
a<-table.row.start(a)
a<-table.element(a,'Autocorrelation Function',4,TRUE)
a<-table.row.end(a)
a<-table.row.start(a)
a<-table.element(a,'Time lag k',header=TRUE)
a<-table.element(a,hyperlink('basics.htm','ACF(k)','click here for more information about the Autocorrelation Function'),header=TRUE)
a<-table.element(a,'T-STAT',header=TRUE)
a<-table.element(a,'P-value',header=TRUE)
a<-table.row.end(a)
for (i in 2:(par1+1)) {
a<-table.row.start(a)
a<-table.element(a,i-1,header=TRUE)
a<-table.element(a,round(myacf[i],6))
mytstat <- myacf[i]*sqrtn
a<-table.element(a,round(mytstat,4))
a<-table.element(a,round(1-pt(abs(mytstat),lengthx),6))
a<-table.row.end(a)
}
a<-table.end(a)
table.save(a,file='mytable.tab')
a<-table.start()
a<-table.row.start(a)
a<-table.element(a,'Partial Autocorrelation Function',4,TRUE)
a<-table.row.end(a)
a<-table.row.start(a)
a<-table.element(a,'Time lag k',header=TRUE)
a<-table.element(a,hyperlink('basics.htm','PACF(k)','click here for more information about the Partial Autocorrelation Function'),header=TRUE)
a<-table.element(a,'T-STAT',header=TRUE)
a<-table.element(a,'P-value',header=TRUE)
a<-table.row.end(a)
for (i in 1:par1) {
a<-table.row.start(a)
a<-table.element(a,i,header=TRUE)
a<-table.element(a,round(mypacf[i],6))
mytstat <- mypacf[i]*sqrtn
a<-table.element(a,round(mytstat,4))
a<-table.element(a,round(1-pt(abs(mytstat),lengthx),6))
a<-table.row.end(a)
}
a<-table.end(a)
table.save(a,file='mytable1.tab')