Free Statistics

of Irreproducible Research!

Author's title

Author*Unverified author*
R Software Modulerwasp_autocorrelation.wasp
Title produced by software(Partial) Autocorrelation Function
Date of computationFri, 04 Jun 2010 13:59:57 +0000
Cite this page as followsStatistical Computations at FreeStatistics.org, Office for Research Development and Education, URL https://freestatistics.org/blog/index.php?v=date/2010/Jun/04/t1275660044yyqvqocr4ktlwju.htm/, Retrieved Sun, 28 Apr 2024 23:03:53 +0000
Statistical Computations at FreeStatistics.org, Office for Research Development and Education, URL https://freestatistics.org/blog/index.php?pk=77454, Retrieved Sun, 28 Apr 2024 23:03:53 +0000
QR Codes:

Original text written by user:
IsPrivate?No (this computation is public)
User-defined keywordsKDGP2W2
Estimated Impact167
Family? (F = Feedback message, R = changed R code, M = changed R Module, P = changed Parameters, D = changed Data)
-     [(Partial) Autocorrelation Function] [Opgave6BIS Goudko...] [2010-05-05 21:40:25] [6161c2e3b695d45e6326d4bda3093101]
- R P     [(Partial) Autocorrelation Function] [Opgave 6 BIS: Gou...] [2010-06-04 13:59:57] [52430d682409e27a0d0e07da361cea73] [Current]
Feedback Forum

Post a new message
Dataseries X:
23100
22650
22440
22910
22980
22535
22300
22780
22780
23300
23800
24510
24660
24730
25070
24690
24880
23920
23880
23990
24590
23610
23580
23360
23910
23940
23060
22800
23020
22890
22780
22530
22290
22820
22480
22110
22000
22230
22260
22590
22820
22420
22230
21600
21000
21360
21640
21450
21710
21620
21800
21490
21670
22130
22050
22050
22140
22390
22220
21790
21510
21670
21745
21850
22105
22050
21670
21680
21800
21920
21980
22270
21740
21950
22010
21890
21920
22110
22340
22210
22240
21960
22220
22060
22090
21960
21940
21790
21710
21690
21710
21670
21640
21500
21290
21250
21580
21670
21620
21510
21360
21420
21470
21370
21370
21340
21130
21130
20990
21240
21320
21430
21390
21530
21510
21630
21560
21610
21560
21310
21340
21410
21550
21380
21600
21530
21560
21670
21540
21540
21550
21590
21420
21420
21370
21380
21210
21505
21365
21385
21350
21360
21530
21380
21630
22145
22315
22340
22440
22135
21955
22060
22050
22035
22280
22315
22205
21970
22075
22115
22105
21885
21805
21910
21995
22245
22100
22130
22300
22915
23040
22880
23000
23160
23020
22770
22660
22740
22905
22720
22705
22735
22600
22510
22560
22575
22685
22980
23275
23845
23640
23640
23835
23625
24055
24005
24325
24445
24670
24615
24700
25065
25185
25220
25235
24975
25055
25520
25880
25960
25740
24965
25235
24895
24635
24835
24635
24695
25090
25220
24740
25005
24650
24460
24680
24840
24630
24490
24695


Summary of computational transaction
Raw Inputview raw input (R code)
Raw Outputview raw output of R engine
Computing time1 seconds
R Server'RServer@AstonUniversity' @ vre.aston.ac.uk

\begin{tabular}{lllllllll}
\hline
Summary of computational transaction \tabularnewline
Raw Input & view raw input (R code)  \tabularnewline
Raw Output & view raw output of R engine  \tabularnewline
Computing time & 1 seconds \tabularnewline
R Server & 'RServer@AstonUniversity' @ vre.aston.ac.uk \tabularnewline
\hline
\end{tabular}
%Source: https://freestatistics.org/blog/index.php?pk=77454&T=0

[TABLE]
[ROW][C]Summary of computational transaction[/C][/ROW]
[ROW][C]Raw Input[/C][C]view raw input (R code) [/C][/ROW]
[ROW][C]Raw Output[/C][C]view raw output of R engine [/C][/ROW]
[ROW][C]Computing time[/C][C]1 seconds[/C][/ROW]
[ROW][C]R Server[/C][C]'RServer@AstonUniversity' @ vre.aston.ac.uk[/C][/ROW]
[/TABLE]
Source: https://freestatistics.org/blog/index.php?pk=77454&T=0

Globally Unique Identifier (entire table): ba.freestatistics.org/blog/index.php?pk=77454&T=0

As an alternative you can also use a QR Code:  

The GUIDs for individual cells are displayed in the table below:

Summary of computational transaction
Raw Inputview raw input (R code)
Raw Outputview raw output of R engine
Computing time1 seconds
R Server'RServer@AstonUniversity' @ vre.aston.ac.uk


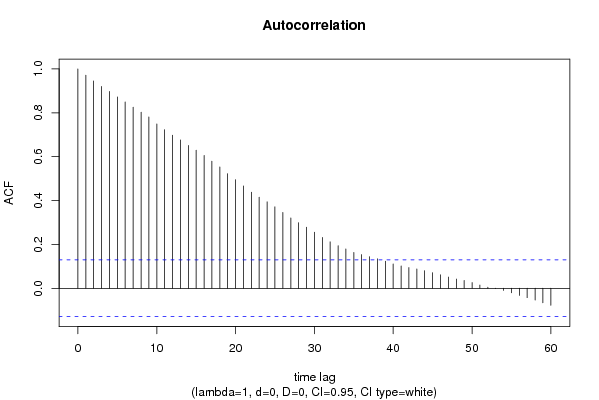
Autocorrelation Function
Time lag kACF(k)T-STATP-value
10.97182314.70640
20.94491814.29920
30.92031213.92680
40.89719513.5770
50.87190813.19440
60.84902512.84810
70.82516712.4870
80.8022512.14020
90.78108111.81990
100.74940111.34050
110.72312110.94280
120.69817210.56530
130.67643110.23630
140.6512479.85510
150.6296589.52850
160.6054839.16260
170.5794028.76790
180.5527358.36440
190.5224067.90540
200.495077.49180
210.4661927.05480
220.4377456.62430
230.4148266.27750
240.394035.96280
250.3711035.61580
260.345415.2270
270.3202684.84651e-06
280.2989964.52465e-06
290.2782634.21091.8e-05
300.2557053.86957.1e-05
310.2314723.50280.000277
320.2116043.20210.000779
330.1937112.93140.001858
340.1787252.70460.003676
350.1629142.46530.007212
360.1533892.32120.010578
370.1434112.17020.01551
380.1340532.02860.021829
390.1232811.86560.031689
400.1106661.67470.047681
410.1013421.53360.063257
420.0940961.42390.077914
430.0881771.33440.091706
440.0795391.20360.114985
450.07091.07290.142219
460.0610710.92420.178186
470.0509170.77050.220894
480.0416590.63040.264525
490.035310.53430.296811
500.0256780.38860.348974
510.0144960.21940.413284
520.0050070.07580.469836
53-0.001535-0.02320.490743
54-0.00977-0.14790.441294
55-0.020508-0.31030.378292
56-0.032717-0.49510.310505
57-0.042981-0.65040.258035
58-0.053885-0.81540.207836
59-0.066215-1.0020.158697
60-0.078034-1.18090.11944

\begin{tabular}{lllllllll}
\hline
Autocorrelation Function \tabularnewline
Time lag k & ACF(k) & T-STAT & P-value \tabularnewline
1 & 0.971823 & 14.7064 & 0 \tabularnewline
2 & 0.944918 & 14.2992 & 0 \tabularnewline
3 & 0.920312 & 13.9268 & 0 \tabularnewline
4 & 0.897195 & 13.577 & 0 \tabularnewline
5 & 0.871908 & 13.1944 & 0 \tabularnewline
6 & 0.849025 & 12.8481 & 0 \tabularnewline
7 & 0.825167 & 12.487 & 0 \tabularnewline
8 & 0.80225 & 12.1402 & 0 \tabularnewline
9 & 0.781081 & 11.8199 & 0 \tabularnewline
10 & 0.749401 & 11.3405 & 0 \tabularnewline
11 & 0.723121 & 10.9428 & 0 \tabularnewline
12 & 0.698172 & 10.5653 & 0 \tabularnewline
13 & 0.676431 & 10.2363 & 0 \tabularnewline
14 & 0.651247 & 9.8551 & 0 \tabularnewline
15 & 0.629658 & 9.5285 & 0 \tabularnewline
16 & 0.605483 & 9.1626 & 0 \tabularnewline
17 & 0.579402 & 8.7679 & 0 \tabularnewline
18 & 0.552735 & 8.3644 & 0 \tabularnewline
19 & 0.522406 & 7.9054 & 0 \tabularnewline
20 & 0.49507 & 7.4918 & 0 \tabularnewline
21 & 0.466192 & 7.0548 & 0 \tabularnewline
22 & 0.437745 & 6.6243 & 0 \tabularnewline
23 & 0.414826 & 6.2775 & 0 \tabularnewline
24 & 0.39403 & 5.9628 & 0 \tabularnewline
25 & 0.371103 & 5.6158 & 0 \tabularnewline
26 & 0.34541 & 5.227 & 0 \tabularnewline
27 & 0.320268 & 4.8465 & 1e-06 \tabularnewline
28 & 0.298996 & 4.5246 & 5e-06 \tabularnewline
29 & 0.278263 & 4.2109 & 1.8e-05 \tabularnewline
30 & 0.255705 & 3.8695 & 7.1e-05 \tabularnewline
31 & 0.231472 & 3.5028 & 0.000277 \tabularnewline
32 & 0.211604 & 3.2021 & 0.000779 \tabularnewline
33 & 0.193711 & 2.9314 & 0.001858 \tabularnewline
34 & 0.178725 & 2.7046 & 0.003676 \tabularnewline
35 & 0.162914 & 2.4653 & 0.007212 \tabularnewline
36 & 0.153389 & 2.3212 & 0.010578 \tabularnewline
37 & 0.143411 & 2.1702 & 0.01551 \tabularnewline
38 & 0.134053 & 2.0286 & 0.021829 \tabularnewline
39 & 0.123281 & 1.8656 & 0.031689 \tabularnewline
40 & 0.110666 & 1.6747 & 0.047681 \tabularnewline
41 & 0.101342 & 1.5336 & 0.063257 \tabularnewline
42 & 0.094096 & 1.4239 & 0.077914 \tabularnewline
43 & 0.088177 & 1.3344 & 0.091706 \tabularnewline
44 & 0.079539 & 1.2036 & 0.114985 \tabularnewline
45 & 0.0709 & 1.0729 & 0.142219 \tabularnewline
46 & 0.061071 & 0.9242 & 0.178186 \tabularnewline
47 & 0.050917 & 0.7705 & 0.220894 \tabularnewline
48 & 0.041659 & 0.6304 & 0.264525 \tabularnewline
49 & 0.03531 & 0.5343 & 0.296811 \tabularnewline
50 & 0.025678 & 0.3886 & 0.348974 \tabularnewline
51 & 0.014496 & 0.2194 & 0.413284 \tabularnewline
52 & 0.005007 & 0.0758 & 0.469836 \tabularnewline
53 & -0.001535 & -0.0232 & 0.490743 \tabularnewline
54 & -0.00977 & -0.1479 & 0.441294 \tabularnewline
55 & -0.020508 & -0.3103 & 0.378292 \tabularnewline
56 & -0.032717 & -0.4951 & 0.310505 \tabularnewline
57 & -0.042981 & -0.6504 & 0.258035 \tabularnewline
58 & -0.053885 & -0.8154 & 0.207836 \tabularnewline
59 & -0.066215 & -1.002 & 0.158697 \tabularnewline
60 & -0.078034 & -1.1809 & 0.11944 \tabularnewline
\hline
\end{tabular}
%Source: https://freestatistics.org/blog/index.php?pk=77454&T=1

[TABLE]
[ROW][C]Autocorrelation Function[/C][/ROW]
[ROW][C]Time lag k[/C][C]ACF(k)[/C][C]T-STAT[/C][C]P-value[/C][/ROW]
[ROW][C]1[/C][C]0.971823[/C][C]14.7064[/C][C]0[/C][/ROW]
[ROW][C]2[/C][C]0.944918[/C][C]14.2992[/C][C]0[/C][/ROW]
[ROW][C]3[/C][C]0.920312[/C][C]13.9268[/C][C]0[/C][/ROW]
[ROW][C]4[/C][C]0.897195[/C][C]13.577[/C][C]0[/C][/ROW]
[ROW][C]5[/C][C]0.871908[/C][C]13.1944[/C][C]0[/C][/ROW]
[ROW][C]6[/C][C]0.849025[/C][C]12.8481[/C][C]0[/C][/ROW]
[ROW][C]7[/C][C]0.825167[/C][C]12.487[/C][C]0[/C][/ROW]
[ROW][C]8[/C][C]0.80225[/C][C]12.1402[/C][C]0[/C][/ROW]
[ROW][C]9[/C][C]0.781081[/C][C]11.8199[/C][C]0[/C][/ROW]
[ROW][C]10[/C][C]0.749401[/C][C]11.3405[/C][C]0[/C][/ROW]
[ROW][C]11[/C][C]0.723121[/C][C]10.9428[/C][C]0[/C][/ROW]
[ROW][C]12[/C][C]0.698172[/C][C]10.5653[/C][C]0[/C][/ROW]
[ROW][C]13[/C][C]0.676431[/C][C]10.2363[/C][C]0[/C][/ROW]
[ROW][C]14[/C][C]0.651247[/C][C]9.8551[/C][C]0[/C][/ROW]
[ROW][C]15[/C][C]0.629658[/C][C]9.5285[/C][C]0[/C][/ROW]
[ROW][C]16[/C][C]0.605483[/C][C]9.1626[/C][C]0[/C][/ROW]
[ROW][C]17[/C][C]0.579402[/C][C]8.7679[/C][C]0[/C][/ROW]
[ROW][C]18[/C][C]0.552735[/C][C]8.3644[/C][C]0[/C][/ROW]
[ROW][C]19[/C][C]0.522406[/C][C]7.9054[/C][C]0[/C][/ROW]
[ROW][C]20[/C][C]0.49507[/C][C]7.4918[/C][C]0[/C][/ROW]
[ROW][C]21[/C][C]0.466192[/C][C]7.0548[/C][C]0[/C][/ROW]
[ROW][C]22[/C][C]0.437745[/C][C]6.6243[/C][C]0[/C][/ROW]
[ROW][C]23[/C][C]0.414826[/C][C]6.2775[/C][C]0[/C][/ROW]
[ROW][C]24[/C][C]0.39403[/C][C]5.9628[/C][C]0[/C][/ROW]
[ROW][C]25[/C][C]0.371103[/C][C]5.6158[/C][C]0[/C][/ROW]
[ROW][C]26[/C][C]0.34541[/C][C]5.227[/C][C]0[/C][/ROW]
[ROW][C]27[/C][C]0.320268[/C][C]4.8465[/C][C]1e-06[/C][/ROW]
[ROW][C]28[/C][C]0.298996[/C][C]4.5246[/C][C]5e-06[/C][/ROW]
[ROW][C]29[/C][C]0.278263[/C][C]4.2109[/C][C]1.8e-05[/C][/ROW]
[ROW][C]30[/C][C]0.255705[/C][C]3.8695[/C][C]7.1e-05[/C][/ROW]
[ROW][C]31[/C][C]0.231472[/C][C]3.5028[/C][C]0.000277[/C][/ROW]
[ROW][C]32[/C][C]0.211604[/C][C]3.2021[/C][C]0.000779[/C][/ROW]
[ROW][C]33[/C][C]0.193711[/C][C]2.9314[/C][C]0.001858[/C][/ROW]
[ROW][C]34[/C][C]0.178725[/C][C]2.7046[/C][C]0.003676[/C][/ROW]
[ROW][C]35[/C][C]0.162914[/C][C]2.4653[/C][C]0.007212[/C][/ROW]
[ROW][C]36[/C][C]0.153389[/C][C]2.3212[/C][C]0.010578[/C][/ROW]
[ROW][C]37[/C][C]0.143411[/C][C]2.1702[/C][C]0.01551[/C][/ROW]
[ROW][C]38[/C][C]0.134053[/C][C]2.0286[/C][C]0.021829[/C][/ROW]
[ROW][C]39[/C][C]0.123281[/C][C]1.8656[/C][C]0.031689[/C][/ROW]
[ROW][C]40[/C][C]0.110666[/C][C]1.6747[/C][C]0.047681[/C][/ROW]
[ROW][C]41[/C][C]0.101342[/C][C]1.5336[/C][C]0.063257[/C][/ROW]
[ROW][C]42[/C][C]0.094096[/C][C]1.4239[/C][C]0.077914[/C][/ROW]
[ROW][C]43[/C][C]0.088177[/C][C]1.3344[/C][C]0.091706[/C][/ROW]
[ROW][C]44[/C][C]0.079539[/C][C]1.2036[/C][C]0.114985[/C][/ROW]
[ROW][C]45[/C][C]0.0709[/C][C]1.0729[/C][C]0.142219[/C][/ROW]
[ROW][C]46[/C][C]0.061071[/C][C]0.9242[/C][C]0.178186[/C][/ROW]
[ROW][C]47[/C][C]0.050917[/C][C]0.7705[/C][C]0.220894[/C][/ROW]
[ROW][C]48[/C][C]0.041659[/C][C]0.6304[/C][C]0.264525[/C][/ROW]
[ROW][C]49[/C][C]0.03531[/C][C]0.5343[/C][C]0.296811[/C][/ROW]
[ROW][C]50[/C][C]0.025678[/C][C]0.3886[/C][C]0.348974[/C][/ROW]
[ROW][C]51[/C][C]0.014496[/C][C]0.2194[/C][C]0.413284[/C][/ROW]
[ROW][C]52[/C][C]0.005007[/C][C]0.0758[/C][C]0.469836[/C][/ROW]
[ROW][C]53[/C][C]-0.001535[/C][C]-0.0232[/C][C]0.490743[/C][/ROW]
[ROW][C]54[/C][C]-0.00977[/C][C]-0.1479[/C][C]0.441294[/C][/ROW]
[ROW][C]55[/C][C]-0.020508[/C][C]-0.3103[/C][C]0.378292[/C][/ROW]
[ROW][C]56[/C][C]-0.032717[/C][C]-0.4951[/C][C]0.310505[/C][/ROW]
[ROW][C]57[/C][C]-0.042981[/C][C]-0.6504[/C][C]0.258035[/C][/ROW]
[ROW][C]58[/C][C]-0.053885[/C][C]-0.8154[/C][C]0.207836[/C][/ROW]
[ROW][C]59[/C][C]-0.066215[/C][C]-1.002[/C][C]0.158697[/C][/ROW]
[ROW][C]60[/C][C]-0.078034[/C][C]-1.1809[/C][C]0.11944[/C][/ROW]
[/TABLE]
Source: https://freestatistics.org/blog/index.php?pk=77454&T=1

Globally Unique Identifier (entire table): ba.freestatistics.org/blog/index.php?pk=77454&T=1

As an alternative you can also use a QR Code:  

The GUIDs for individual cells are displayed in the table below:

Autocorrelation Function
Time lag kACF(k)T-STATP-value
10.97182314.70640
20.94491814.29920
30.92031213.92680
40.89719513.5770
50.87190813.19440
60.84902512.84810
70.82516712.4870
80.8022512.14020
90.78108111.81990
100.74940111.34050
110.72312110.94280
120.69817210.56530
130.67643110.23630
140.6512479.85510
150.6296589.52850
160.6054839.16260
170.5794028.76790
180.5527358.36440
190.5224067.90540
200.495077.49180
210.4661927.05480
220.4377456.62430
230.4148266.27750
240.394035.96280
250.3711035.61580
260.345415.2270
270.3202684.84651e-06
280.2989964.52465e-06
290.2782634.21091.8e-05
300.2557053.86957.1e-05
310.2314723.50280.000277
320.2116043.20210.000779
330.1937112.93140.001858
340.1787252.70460.003676
350.1629142.46530.007212
360.1533892.32120.010578
370.1434112.17020.01551
380.1340532.02860.021829
390.1232811.86560.031689
400.1106661.67470.047681
410.1013421.53360.063257
420.0940961.42390.077914
430.0881771.33440.091706
440.0795391.20360.114985
450.07091.07290.142219
460.0610710.92420.178186
470.0509170.77050.220894
480.0416590.63040.264525
490.035310.53430.296811
500.0256780.38860.348974
510.0144960.21940.413284
520.0050070.07580.469836
53-0.001535-0.02320.490743
54-0.00977-0.14790.441294
55-0.020508-0.31030.378292
56-0.032717-0.49510.310505
57-0.042981-0.65040.258035
58-0.053885-0.81540.207836
59-0.066215-1.0020.158697
60-0.078034-1.18090.11944


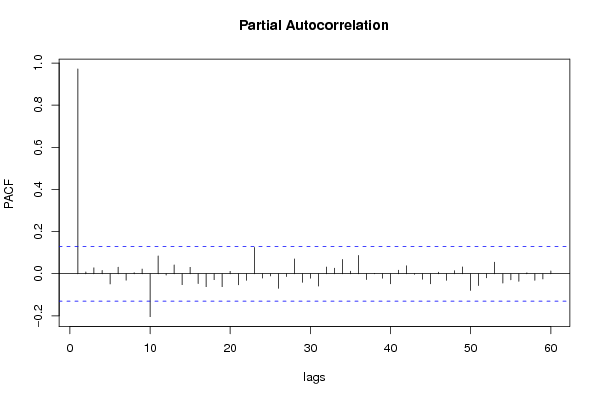
Partial Autocorrelation Function
Time lag kPACF(k)T-STATP-value
10.97182314.70640
20.0085990.13010.448289
30.0280530.42450.335791
40.0158430.23970.405372
5-0.048413-0.73260.232271
60.0304640.4610.322617
7-0.030446-0.46070.322717
80.00470.07110.471682
90.0218670.33090.370507
10-0.2037-3.08250.001152
110.0838511.26890.102882
12-0.005831-0.08820.464881
130.041740.63160.264127
14-0.051909-0.78550.216479
150.0302790.45820.323618
16-0.046461-0.70310.241361
17-0.06137-0.92870.177013
18-0.028233-0.42720.334799
19-0.061448-0.92990.176707
200.0112080.16960.432737
21-0.052293-0.79130.214784
22-0.030933-0.46810.320076
230.1242961.88090.030624
24-0.020608-0.31190.377718
25-0.010462-0.15830.437173
26-0.068725-1.040.149717
27-0.013697-0.20730.417988
280.0699141.0580.145587
29-0.040749-0.61660.269043
30-0.020924-0.31660.375903
31-0.058203-0.88080.189684
320.0315460.47740.316775
330.0260610.39440.346835
340.0672221.01730.155052
350.0116830.17680.429911
360.0866331.3110.095585
37-0.027174-0.41120.340649
380.0014890.02250.491022
39-0.020887-0.31610.376118
40-0.047658-0.72120.235762
410.0164230.24850.401978
420.0373280.56490.286358
43-0.002861-0.04330.482751
44-0.02579-0.39030.348351
45-0.047973-0.7260.2343
460.006950.10520.458165
47-0.031185-0.47190.318719
480.0145770.22060.412801
490.0324580.49120.311885
50-0.079048-1.19620.116424
51-0.055833-0.84490.199522
52-0.019165-0.290.386033
530.0541890.820.206528
54-0.044362-0.67130.251346
55-0.02869-0.43420.332288
56-0.035728-0.54070.294633
570.004290.06490.474145
58-0.031528-0.47710.316869
59-0.024691-0.37360.354509
600.013310.20140.420273

\begin{tabular}{lllllllll}
\hline
Partial Autocorrelation Function \tabularnewline
Time lag k & PACF(k) & T-STAT & P-value \tabularnewline
1 & 0.971823 & 14.7064 & 0 \tabularnewline
2 & 0.008599 & 0.1301 & 0.448289 \tabularnewline
3 & 0.028053 & 0.4245 & 0.335791 \tabularnewline
4 & 0.015843 & 0.2397 & 0.405372 \tabularnewline
5 & -0.048413 & -0.7326 & 0.232271 \tabularnewline
6 & 0.030464 & 0.461 & 0.322617 \tabularnewline
7 & -0.030446 & -0.4607 & 0.322717 \tabularnewline
8 & 0.0047 & 0.0711 & 0.471682 \tabularnewline
9 & 0.021867 & 0.3309 & 0.370507 \tabularnewline
10 & -0.2037 & -3.0825 & 0.001152 \tabularnewline
11 & 0.083851 & 1.2689 & 0.102882 \tabularnewline
12 & -0.005831 & -0.0882 & 0.464881 \tabularnewline
13 & 0.04174 & 0.6316 & 0.264127 \tabularnewline
14 & -0.051909 & -0.7855 & 0.216479 \tabularnewline
15 & 0.030279 & 0.4582 & 0.323618 \tabularnewline
16 & -0.046461 & -0.7031 & 0.241361 \tabularnewline
17 & -0.06137 & -0.9287 & 0.177013 \tabularnewline
18 & -0.028233 & -0.4272 & 0.334799 \tabularnewline
19 & -0.061448 & -0.9299 & 0.176707 \tabularnewline
20 & 0.011208 & 0.1696 & 0.432737 \tabularnewline
21 & -0.052293 & -0.7913 & 0.214784 \tabularnewline
22 & -0.030933 & -0.4681 & 0.320076 \tabularnewline
23 & 0.124296 & 1.8809 & 0.030624 \tabularnewline
24 & -0.020608 & -0.3119 & 0.377718 \tabularnewline
25 & -0.010462 & -0.1583 & 0.437173 \tabularnewline
26 & -0.068725 & -1.04 & 0.149717 \tabularnewline
27 & -0.013697 & -0.2073 & 0.417988 \tabularnewline
28 & 0.069914 & 1.058 & 0.145587 \tabularnewline
29 & -0.040749 & -0.6166 & 0.269043 \tabularnewline
30 & -0.020924 & -0.3166 & 0.375903 \tabularnewline
31 & -0.058203 & -0.8808 & 0.189684 \tabularnewline
32 & 0.031546 & 0.4774 & 0.316775 \tabularnewline
33 & 0.026061 & 0.3944 & 0.346835 \tabularnewline
34 & 0.067222 & 1.0173 & 0.155052 \tabularnewline
35 & 0.011683 & 0.1768 & 0.429911 \tabularnewline
36 & 0.086633 & 1.311 & 0.095585 \tabularnewline
37 & -0.027174 & -0.4112 & 0.340649 \tabularnewline
38 & 0.001489 & 0.0225 & 0.491022 \tabularnewline
39 & -0.020887 & -0.3161 & 0.376118 \tabularnewline
40 & -0.047658 & -0.7212 & 0.235762 \tabularnewline
41 & 0.016423 & 0.2485 & 0.401978 \tabularnewline
42 & 0.037328 & 0.5649 & 0.286358 \tabularnewline
43 & -0.002861 & -0.0433 & 0.482751 \tabularnewline
44 & -0.02579 & -0.3903 & 0.348351 \tabularnewline
45 & -0.047973 & -0.726 & 0.2343 \tabularnewline
46 & 0.00695 & 0.1052 & 0.458165 \tabularnewline
47 & -0.031185 & -0.4719 & 0.318719 \tabularnewline
48 & 0.014577 & 0.2206 & 0.412801 \tabularnewline
49 & 0.032458 & 0.4912 & 0.311885 \tabularnewline
50 & -0.079048 & -1.1962 & 0.116424 \tabularnewline
51 & -0.055833 & -0.8449 & 0.199522 \tabularnewline
52 & -0.019165 & -0.29 & 0.386033 \tabularnewline
53 & 0.054189 & 0.82 & 0.206528 \tabularnewline
54 & -0.044362 & -0.6713 & 0.251346 \tabularnewline
55 & -0.02869 & -0.4342 & 0.332288 \tabularnewline
56 & -0.035728 & -0.5407 & 0.294633 \tabularnewline
57 & 0.00429 & 0.0649 & 0.474145 \tabularnewline
58 & -0.031528 & -0.4771 & 0.316869 \tabularnewline
59 & -0.024691 & -0.3736 & 0.354509 \tabularnewline
60 & 0.01331 & 0.2014 & 0.420273 \tabularnewline
\hline
\end{tabular}
%Source: https://freestatistics.org/blog/index.php?pk=77454&T=2

[TABLE]
[ROW][C]Partial Autocorrelation Function[/C][/ROW]
[ROW][C]Time lag k[/C][C]PACF(k)[/C][C]T-STAT[/C][C]P-value[/C][/ROW]
[ROW][C]1[/C][C]0.971823[/C][C]14.7064[/C][C]0[/C][/ROW]
[ROW][C]2[/C][C]0.008599[/C][C]0.1301[/C][C]0.448289[/C][/ROW]
[ROW][C]3[/C][C]0.028053[/C][C]0.4245[/C][C]0.335791[/C][/ROW]
[ROW][C]4[/C][C]0.015843[/C][C]0.2397[/C][C]0.405372[/C][/ROW]
[ROW][C]5[/C][C]-0.048413[/C][C]-0.7326[/C][C]0.232271[/C][/ROW]
[ROW][C]6[/C][C]0.030464[/C][C]0.461[/C][C]0.322617[/C][/ROW]
[ROW][C]7[/C][C]-0.030446[/C][C]-0.4607[/C][C]0.322717[/C][/ROW]
[ROW][C]8[/C][C]0.0047[/C][C]0.0711[/C][C]0.471682[/C][/ROW]
[ROW][C]9[/C][C]0.021867[/C][C]0.3309[/C][C]0.370507[/C][/ROW]
[ROW][C]10[/C][C]-0.2037[/C][C]-3.0825[/C][C]0.001152[/C][/ROW]
[ROW][C]11[/C][C]0.083851[/C][C]1.2689[/C][C]0.102882[/C][/ROW]
[ROW][C]12[/C][C]-0.005831[/C][C]-0.0882[/C][C]0.464881[/C][/ROW]
[ROW][C]13[/C][C]0.04174[/C][C]0.6316[/C][C]0.264127[/C][/ROW]
[ROW][C]14[/C][C]-0.051909[/C][C]-0.7855[/C][C]0.216479[/C][/ROW]
[ROW][C]15[/C][C]0.030279[/C][C]0.4582[/C][C]0.323618[/C][/ROW]
[ROW][C]16[/C][C]-0.046461[/C][C]-0.7031[/C][C]0.241361[/C][/ROW]
[ROW][C]17[/C][C]-0.06137[/C][C]-0.9287[/C][C]0.177013[/C][/ROW]
[ROW][C]18[/C][C]-0.028233[/C][C]-0.4272[/C][C]0.334799[/C][/ROW]
[ROW][C]19[/C][C]-0.061448[/C][C]-0.9299[/C][C]0.176707[/C][/ROW]
[ROW][C]20[/C][C]0.011208[/C][C]0.1696[/C][C]0.432737[/C][/ROW]
[ROW][C]21[/C][C]-0.052293[/C][C]-0.7913[/C][C]0.214784[/C][/ROW]
[ROW][C]22[/C][C]-0.030933[/C][C]-0.4681[/C][C]0.320076[/C][/ROW]
[ROW][C]23[/C][C]0.124296[/C][C]1.8809[/C][C]0.030624[/C][/ROW]
[ROW][C]24[/C][C]-0.020608[/C][C]-0.3119[/C][C]0.377718[/C][/ROW]
[ROW][C]25[/C][C]-0.010462[/C][C]-0.1583[/C][C]0.437173[/C][/ROW]
[ROW][C]26[/C][C]-0.068725[/C][C]-1.04[/C][C]0.149717[/C][/ROW]
[ROW][C]27[/C][C]-0.013697[/C][C]-0.2073[/C][C]0.417988[/C][/ROW]
[ROW][C]28[/C][C]0.069914[/C][C]1.058[/C][C]0.145587[/C][/ROW]
[ROW][C]29[/C][C]-0.040749[/C][C]-0.6166[/C][C]0.269043[/C][/ROW]
[ROW][C]30[/C][C]-0.020924[/C][C]-0.3166[/C][C]0.375903[/C][/ROW]
[ROW][C]31[/C][C]-0.058203[/C][C]-0.8808[/C][C]0.189684[/C][/ROW]
[ROW][C]32[/C][C]0.031546[/C][C]0.4774[/C][C]0.316775[/C][/ROW]
[ROW][C]33[/C][C]0.026061[/C][C]0.3944[/C][C]0.346835[/C][/ROW]
[ROW][C]34[/C][C]0.067222[/C][C]1.0173[/C][C]0.155052[/C][/ROW]
[ROW][C]35[/C][C]0.011683[/C][C]0.1768[/C][C]0.429911[/C][/ROW]
[ROW][C]36[/C][C]0.086633[/C][C]1.311[/C][C]0.095585[/C][/ROW]
[ROW][C]37[/C][C]-0.027174[/C][C]-0.4112[/C][C]0.340649[/C][/ROW]
[ROW][C]38[/C][C]0.001489[/C][C]0.0225[/C][C]0.491022[/C][/ROW]
[ROW][C]39[/C][C]-0.020887[/C][C]-0.3161[/C][C]0.376118[/C][/ROW]
[ROW][C]40[/C][C]-0.047658[/C][C]-0.7212[/C][C]0.235762[/C][/ROW]
[ROW][C]41[/C][C]0.016423[/C][C]0.2485[/C][C]0.401978[/C][/ROW]
[ROW][C]42[/C][C]0.037328[/C][C]0.5649[/C][C]0.286358[/C][/ROW]
[ROW][C]43[/C][C]-0.002861[/C][C]-0.0433[/C][C]0.482751[/C][/ROW]
[ROW][C]44[/C][C]-0.02579[/C][C]-0.3903[/C][C]0.348351[/C][/ROW]
[ROW][C]45[/C][C]-0.047973[/C][C]-0.726[/C][C]0.2343[/C][/ROW]
[ROW][C]46[/C][C]0.00695[/C][C]0.1052[/C][C]0.458165[/C][/ROW]
[ROW][C]47[/C][C]-0.031185[/C][C]-0.4719[/C][C]0.318719[/C][/ROW]
[ROW][C]48[/C][C]0.014577[/C][C]0.2206[/C][C]0.412801[/C][/ROW]
[ROW][C]49[/C][C]0.032458[/C][C]0.4912[/C][C]0.311885[/C][/ROW]
[ROW][C]50[/C][C]-0.079048[/C][C]-1.1962[/C][C]0.116424[/C][/ROW]
[ROW][C]51[/C][C]-0.055833[/C][C]-0.8449[/C][C]0.199522[/C][/ROW]
[ROW][C]52[/C][C]-0.019165[/C][C]-0.29[/C][C]0.386033[/C][/ROW]
[ROW][C]53[/C][C]0.054189[/C][C]0.82[/C][C]0.206528[/C][/ROW]
[ROW][C]54[/C][C]-0.044362[/C][C]-0.6713[/C][C]0.251346[/C][/ROW]
[ROW][C]55[/C][C]-0.02869[/C][C]-0.4342[/C][C]0.332288[/C][/ROW]
[ROW][C]56[/C][C]-0.035728[/C][C]-0.5407[/C][C]0.294633[/C][/ROW]
[ROW][C]57[/C][C]0.00429[/C][C]0.0649[/C][C]0.474145[/C][/ROW]
[ROW][C]58[/C][C]-0.031528[/C][C]-0.4771[/C][C]0.316869[/C][/ROW]
[ROW][C]59[/C][C]-0.024691[/C][C]-0.3736[/C][C]0.354509[/C][/ROW]
[ROW][C]60[/C][C]0.01331[/C][C]0.2014[/C][C]0.420273[/C][/ROW]
[/TABLE]
Source: https://freestatistics.org/blog/index.php?pk=77454&T=2

Globally Unique Identifier (entire table): ba.freestatistics.org/blog/index.php?pk=77454&T=2

As an alternative you can also use a QR Code:  

The GUIDs for individual cells are displayed in the table below:

Partial Autocorrelation Function
Time lag kPACF(k)T-STATP-value
10.97182314.70640
20.0085990.13010.448289
30.0280530.42450.335791
40.0158430.23970.405372
5-0.048413-0.73260.232271
60.0304640.4610.322617
7-0.030446-0.46070.322717
80.00470.07110.471682
90.0218670.33090.370507
10-0.2037-3.08250.001152
110.0838511.26890.102882
12-0.005831-0.08820.464881
130.041740.63160.264127
14-0.051909-0.78550.216479
150.0302790.45820.323618
16-0.046461-0.70310.241361
17-0.06137-0.92870.177013
18-0.028233-0.42720.334799
19-0.061448-0.92990.176707
200.0112080.16960.432737
21-0.052293-0.79130.214784
22-0.030933-0.46810.320076
230.1242961.88090.030624
24-0.020608-0.31190.377718
25-0.010462-0.15830.437173
26-0.068725-1.040.149717
27-0.013697-0.20730.417988
280.0699141.0580.145587
29-0.040749-0.61660.269043
30-0.020924-0.31660.375903
31-0.058203-0.88080.189684
320.0315460.47740.316775
330.0260610.39440.346835
340.0672221.01730.155052
350.0116830.17680.429911
360.0866331.3110.095585
37-0.027174-0.41120.340649
380.0014890.02250.491022
39-0.020887-0.31610.376118
40-0.047658-0.72120.235762
410.0164230.24850.401978
420.0373280.56490.286358
43-0.002861-0.04330.482751
44-0.02579-0.39030.348351
45-0.047973-0.7260.2343
460.006950.10520.458165
47-0.031185-0.47190.318719
480.0145770.22060.412801
490.0324580.49120.311885
50-0.079048-1.19620.116424
51-0.055833-0.84490.199522
52-0.019165-0.290.386033
530.0541890.820.206528
54-0.044362-0.67130.251346
55-0.02869-0.43420.332288
56-0.035728-0.54070.294633
570.004290.06490.474145
58-0.031528-0.47710.316869
59-0.024691-0.37360.354509
600.013310.20140.420273


Parameters (Session):
par1 = 60 ; par2 = 1 ; par3 = 0 ; par4 = 0 ; par5 = 1 ; par6 = White Noise ; par7 = 0.95 ;
Parameters (R input):
par1 = 60 ; par2 = 1 ; par3 = 0 ; par4 = 0 ; par5 = 1 ; par6 = White Noise ; par7 = 0.95 ;
R code (references can be found in the software module):
if (par1 == 'Default') {
par1 = 10*log10(length(x))
} else {
par1 <- as.numeric(par1)
}
par2 <- as.numeric(par2)
par3 <- as.numeric(par3)
par4 <- as.numeric(par4)
par5 <- as.numeric(par5)
if (par6 == 'White Noise') par6 <- 'white' else par6 <- 'ma'
par7 <- as.numeric(par7)
if (par2 == 0) {
x <- log(x)
} else {
x <- (x ^ par2 - 1) / par2
}
if (par3 > 0) x <- diff(x,lag=1,difference=par3)
if (par4 > 0) x <- diff(x,lag=par5,difference=par4)
bitmap(file='pic1.png')
racf <- acf(x, par1, main='Autocorrelation', xlab='time lag', ylab='ACF', ci.type=par6, ci=par7, sub=paste('(lambda=',par2,', d=',par3,', D=',par4,', CI=', par7, ', CI type=',par6,')',sep=''))
dev.off()
bitmap(file='pic2.png')
rpacf <- pacf(x,par1,main='Partial Autocorrelation',xlab='lags',ylab='PACF')
dev.off()
(myacf <- c(racf$acf))
(mypacf <- c(rpacf$acf))
lengthx <- length(x)
sqrtn <- sqrt(lengthx)
load(file='createtable')
a<-table.start()
a<-table.row.start(a)
a<-table.element(a,'Autocorrelation Function',4,TRUE)
a<-table.row.end(a)
a<-table.row.start(a)
a<-table.element(a,'Time lag k',header=TRUE)
a<-table.element(a,hyperlink('basics.htm','ACF(k)','click here for more information about the Autocorrelation Function'),header=TRUE)
a<-table.element(a,'T-STAT',header=TRUE)
a<-table.element(a,'P-value',header=TRUE)
a<-table.row.end(a)
for (i in 2:(par1+1)) {
a<-table.row.start(a)
a<-table.element(a,i-1,header=TRUE)
a<-table.element(a,round(myacf[i],6))
mytstat <- myacf[i]*sqrtn
a<-table.element(a,round(mytstat,4))
a<-table.element(a,round(1-pt(abs(mytstat),lengthx),6))
a<-table.row.end(a)
}
a<-table.end(a)
table.save(a,file='mytable.tab')
a<-table.start()
a<-table.row.start(a)
a<-table.element(a,'Partial Autocorrelation Function',4,TRUE)
a<-table.row.end(a)
a<-table.row.start(a)
a<-table.element(a,'Time lag k',header=TRUE)
a<-table.element(a,hyperlink('basics.htm','PACF(k)','click here for more information about the Partial Autocorrelation Function'),header=TRUE)
a<-table.element(a,'T-STAT',header=TRUE)
a<-table.element(a,'P-value',header=TRUE)
a<-table.row.end(a)
for (i in 1:par1) {
a<-table.row.start(a)
a<-table.element(a,i,header=TRUE)
a<-table.element(a,round(mypacf[i],6))
mytstat <- mypacf[i]*sqrtn
a<-table.element(a,round(mytstat,4))
a<-table.element(a,round(1-pt(abs(mytstat),lengthx),6))
a<-table.row.end(a)
}
a<-table.end(a)
table.save(a,file='mytable1.tab')